
Gold Analysis 2026/05/27
【Daily chart】
Downward bias with a bearish outside from the short-term MA
However, personally I have a superstition that an outside move based on the short-term MA tends to become a bike rally or a selling-closing pattern
【4-hour chart】
It will be a rebound from the lower edge, so the range is 4580–4482
There are many bullish candles, but since they are part of a sequence of downward candles, I wonder if a long position is advisable
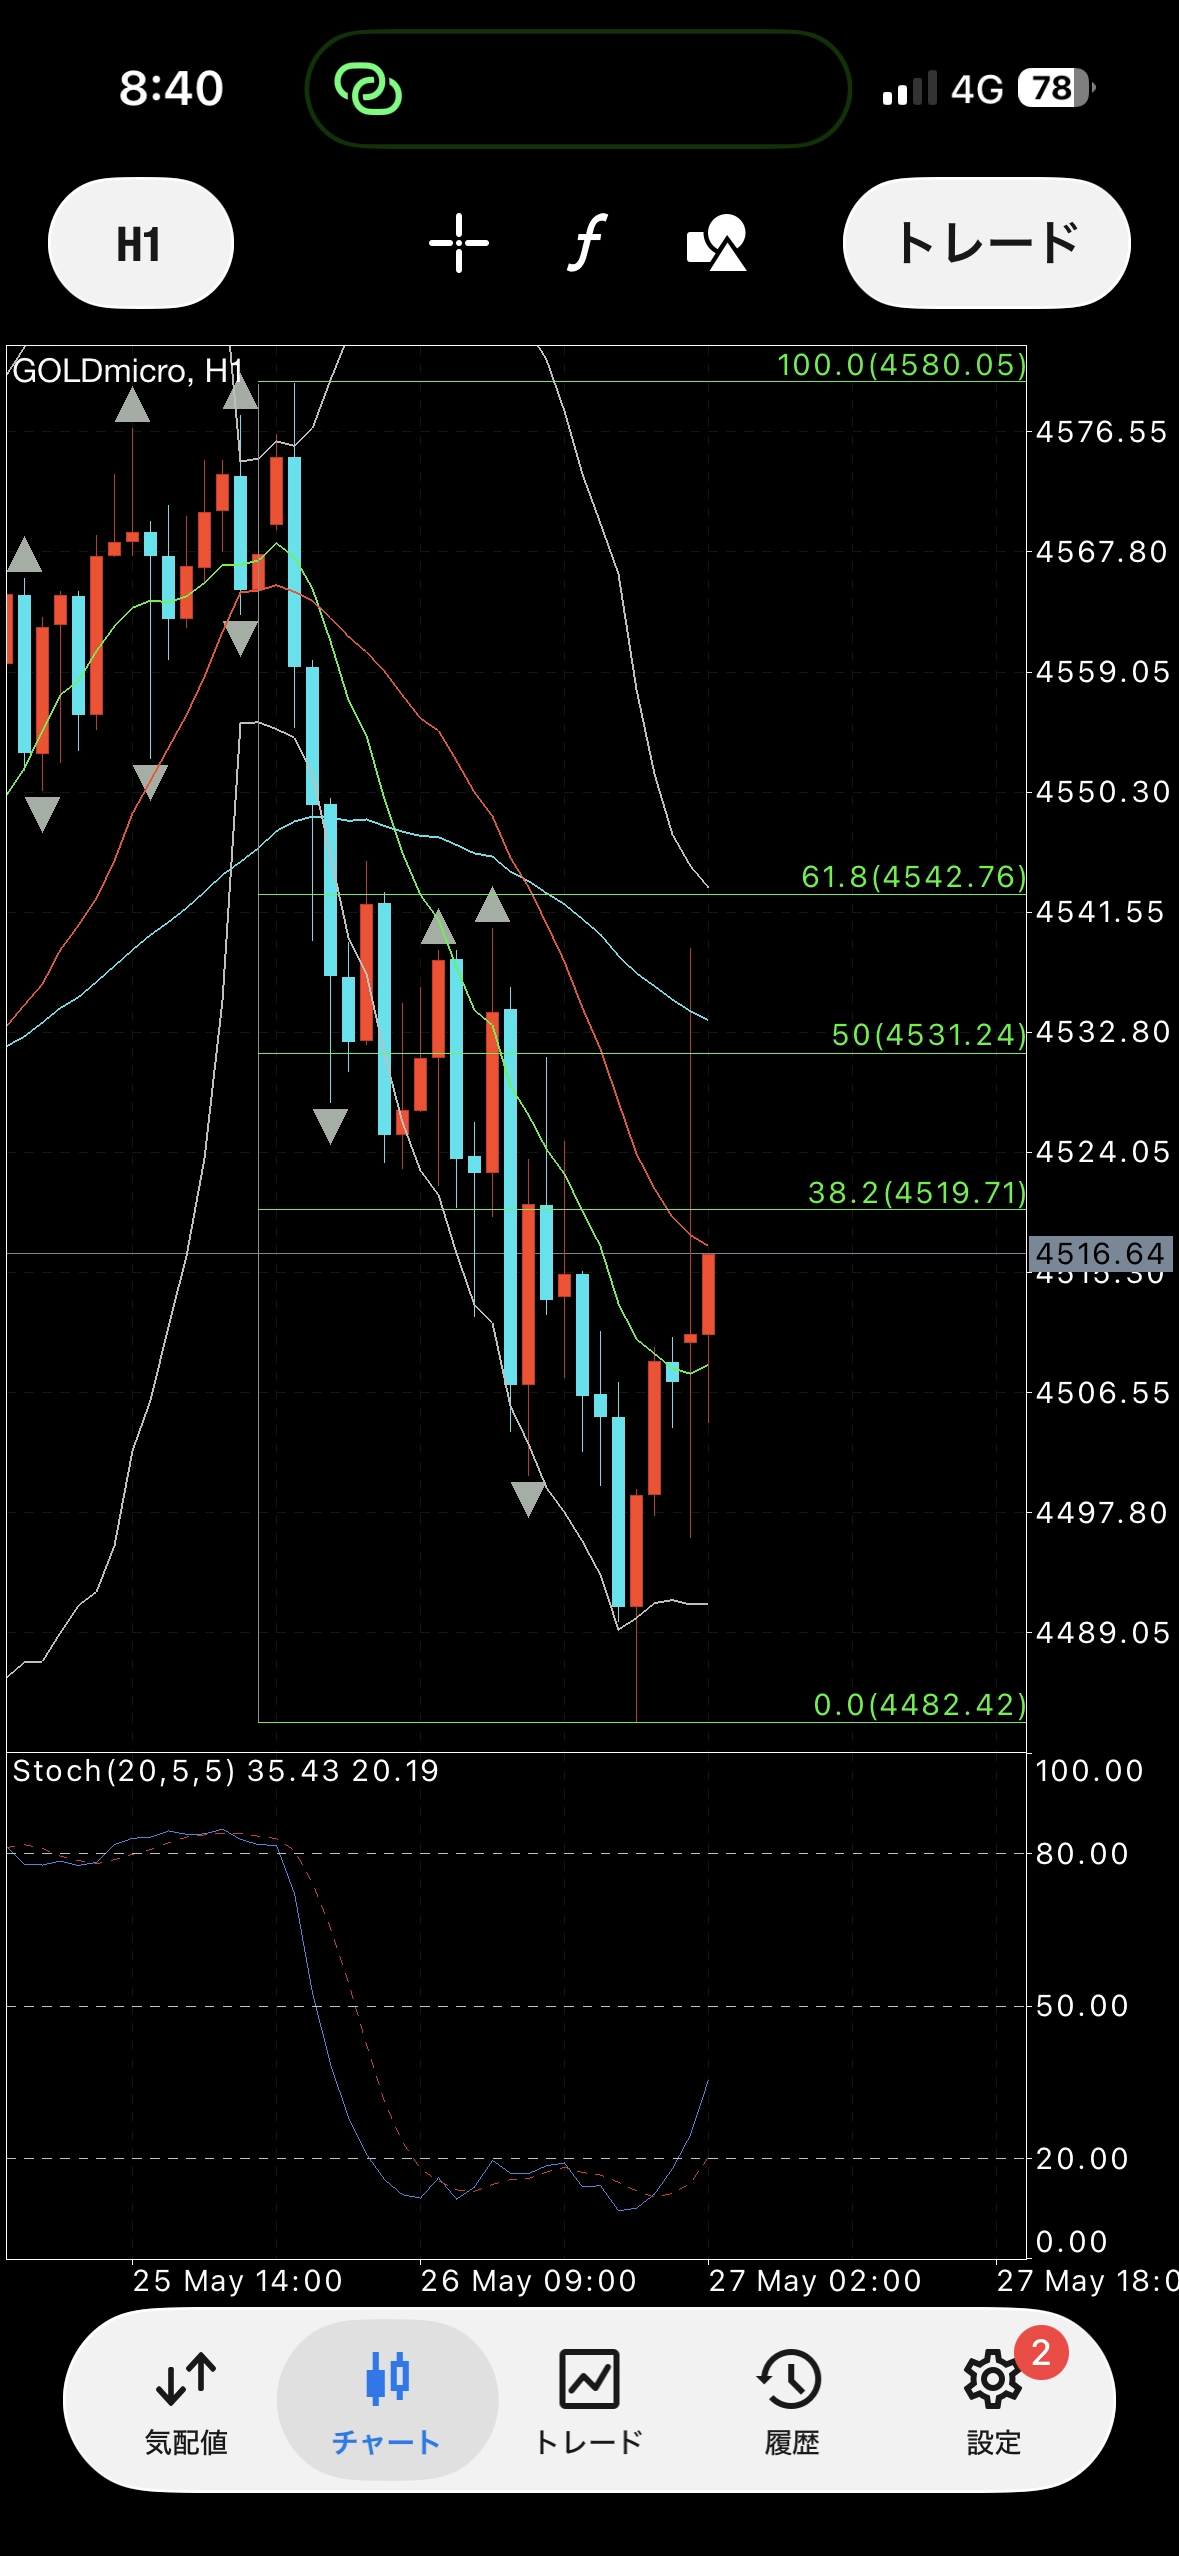
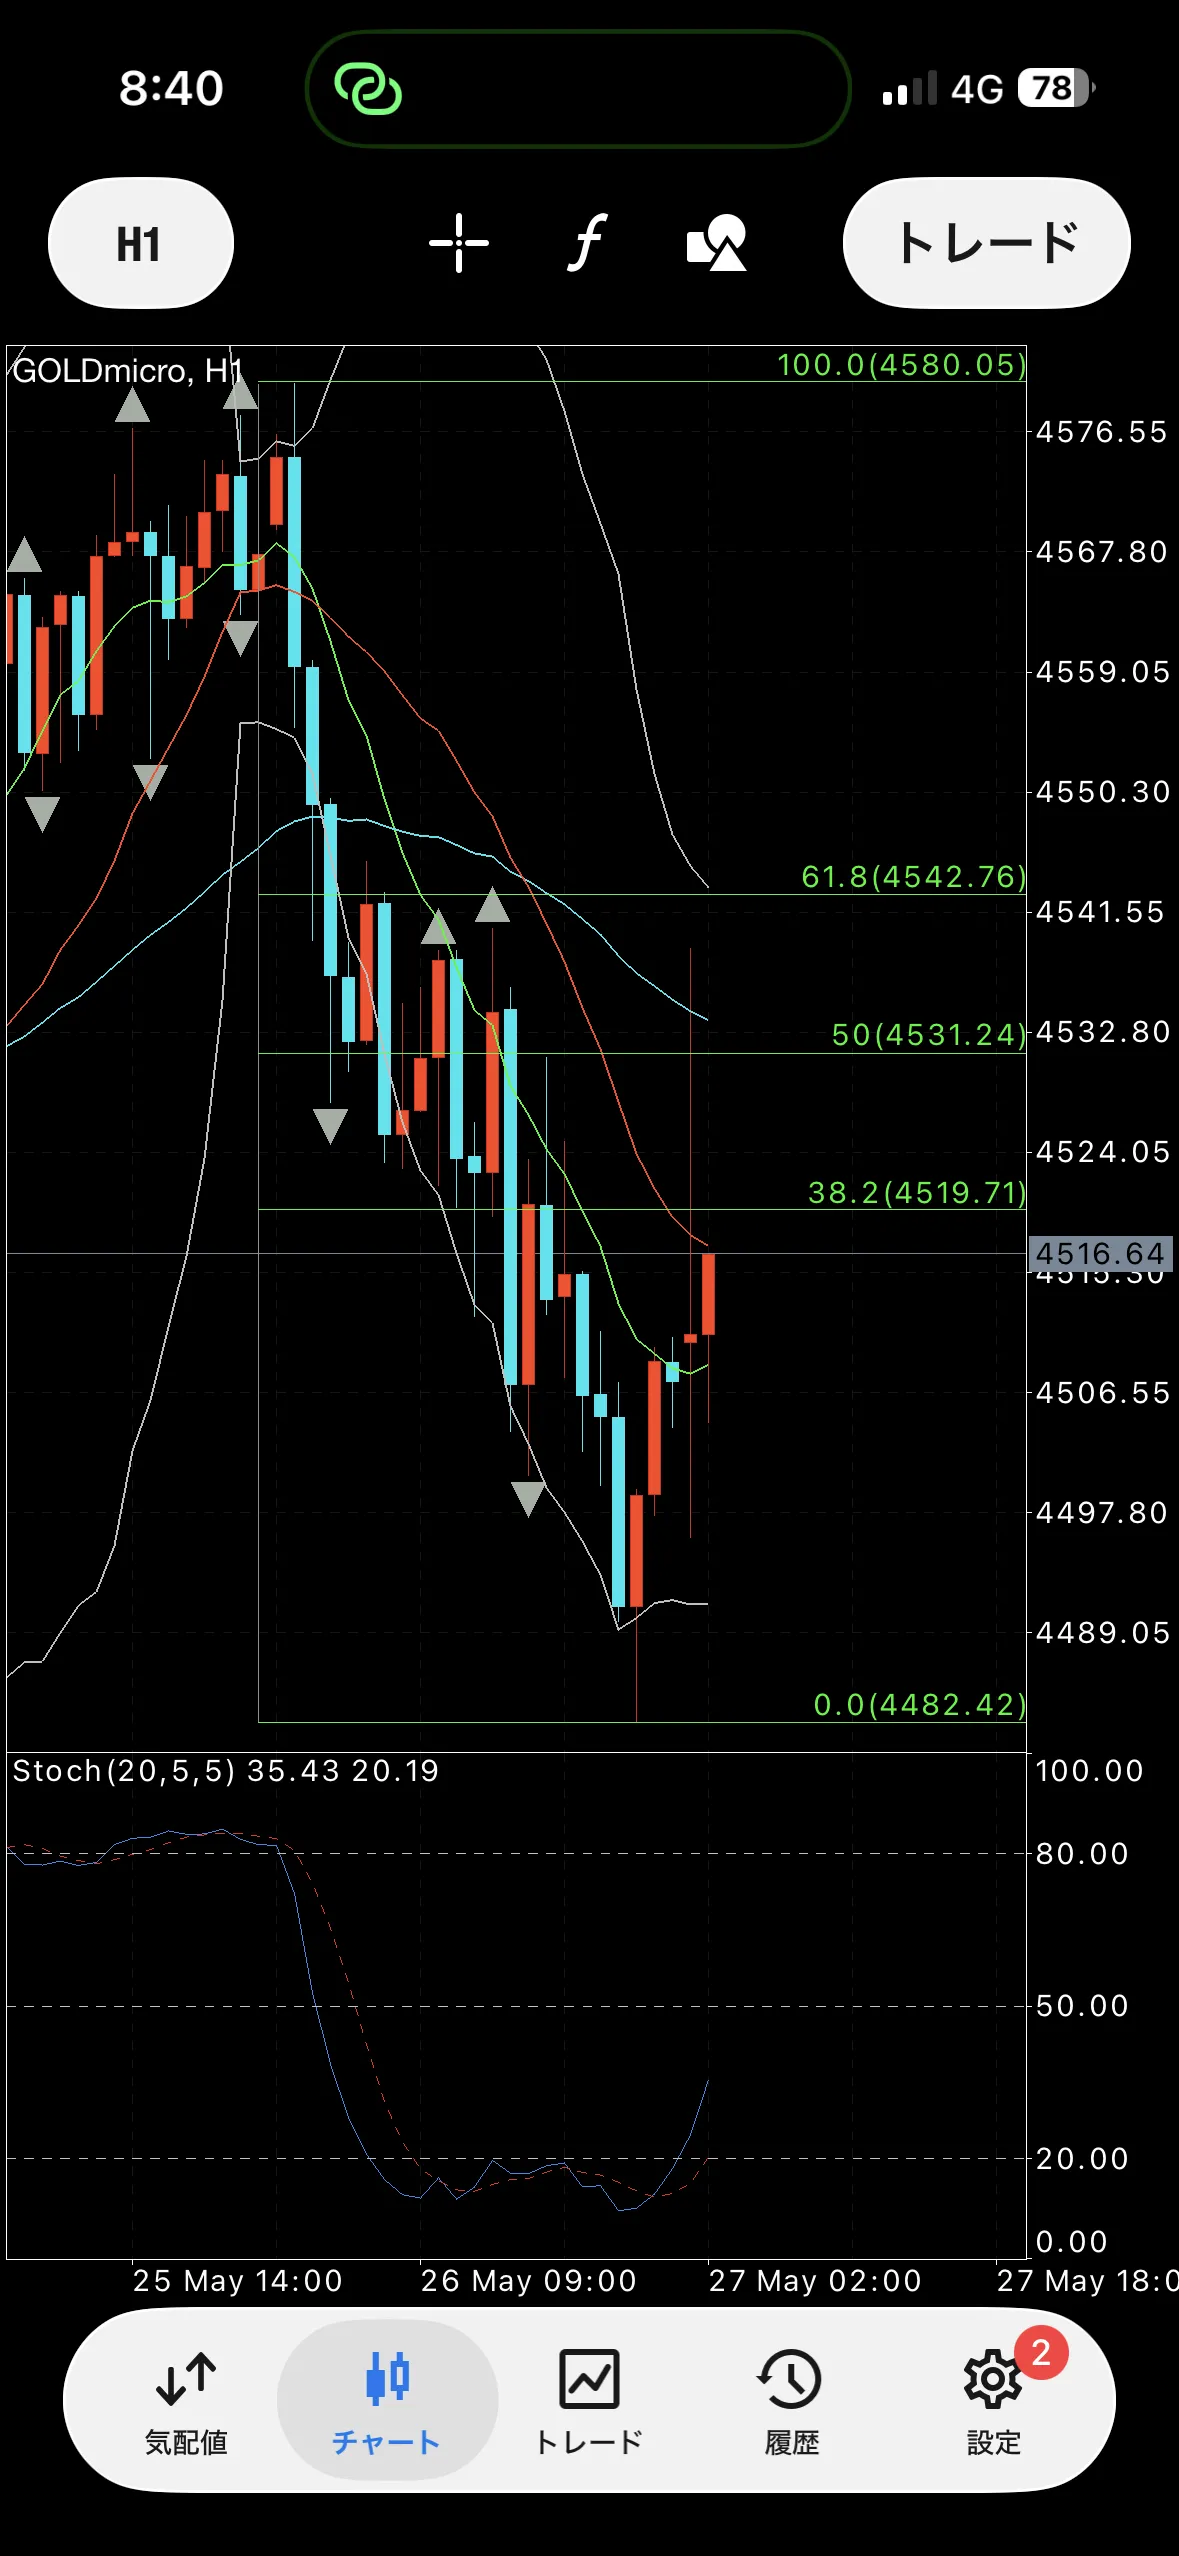
【1-hour chart】
Rising from the MA wedge
But since it is below the mid-term MA, please consider the bias to be bearish until this crosses
【Sell defense lines】
4531
4542
4580
【Buy defense lines】
4582
4445
4422
4384