
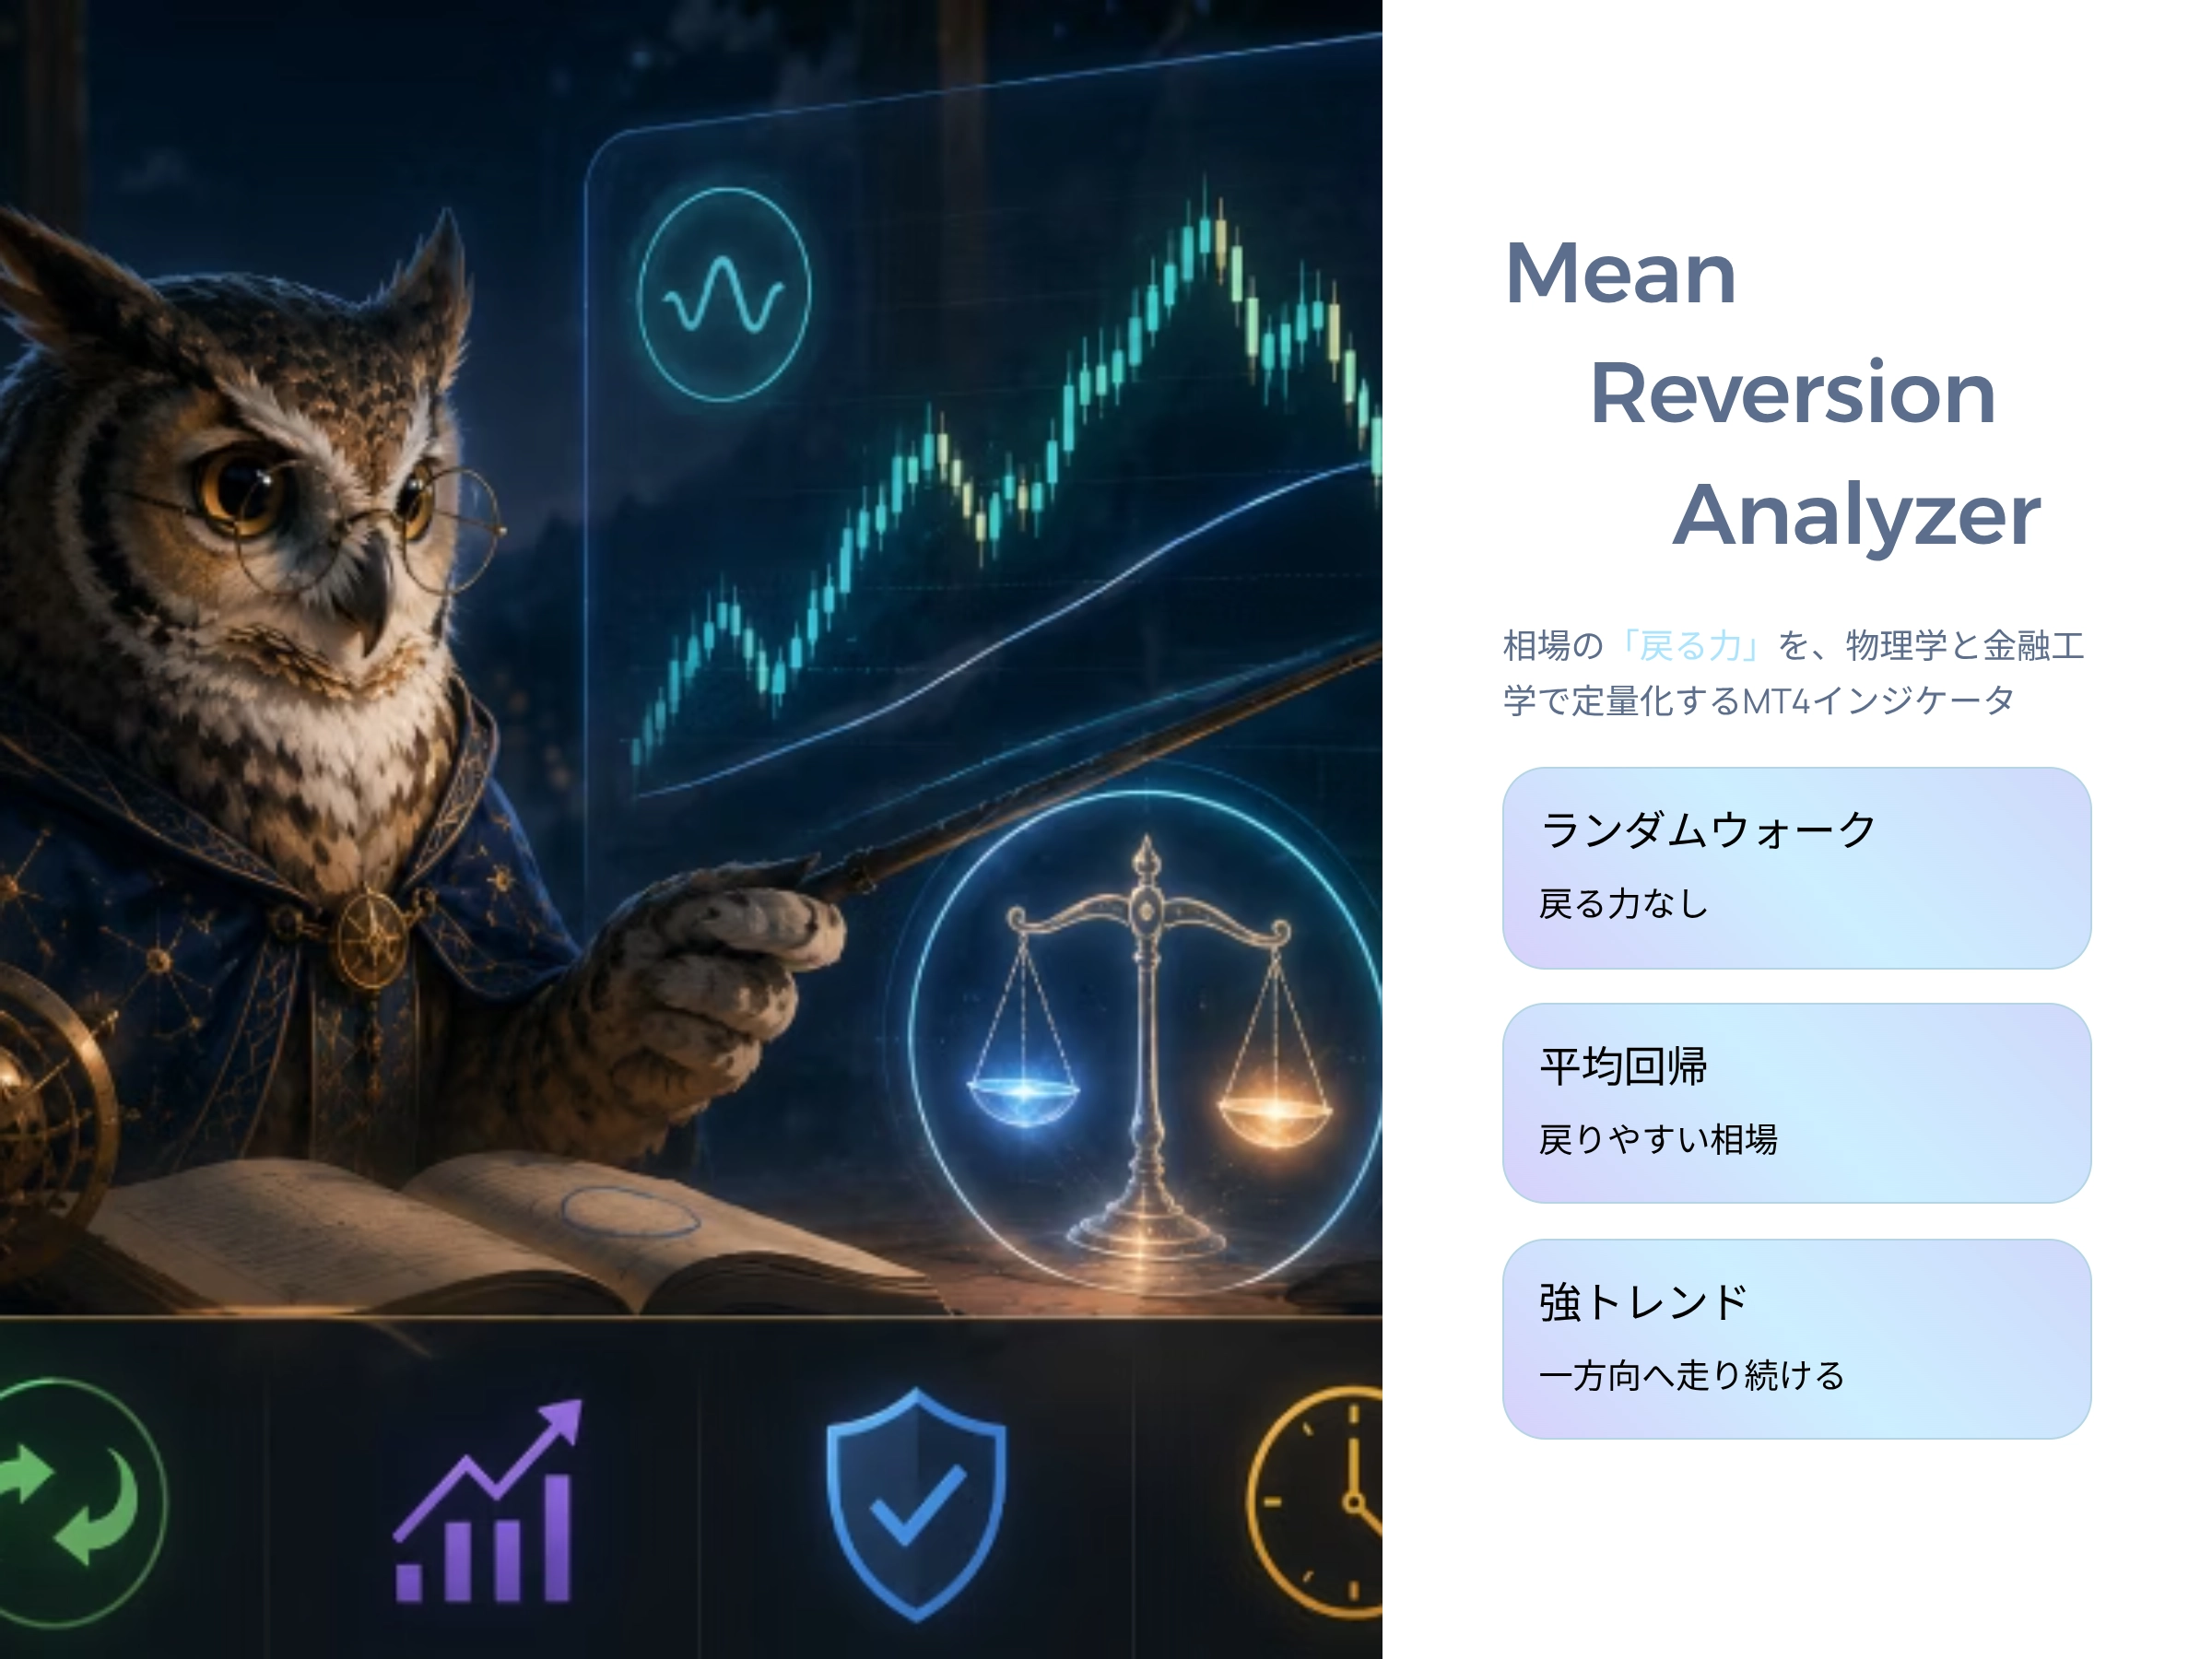
第6回:平均回帰力を“見える化”する ─ MeanReversionAnalyzer 開発編 Translated: Episode 6: Visualizing Mean Reversion Power — Development of MeanReversionAnalyzer
In the articles up to this point,
- Random walk
- Mean reversion
- OU process
- Half-Life
- The impact of “pullback force” on the mean
we have examined these through theory and simulations.
And what became clear is
“Depending on the market, the tendency to return varies greatly.”
This is the fact.
USDJPY tends to revert relatively easily.
On the other hand, EURTRY and BTC
often move in one direction without much reversal.
In other words,
“If we can quantify which currency reverts how much on average?”
then we should be able to objectively classify
- markets where contrarian strategies work
- markets where pullbacks are effective
- markets where trends tend to continue
accordingly.
So this time,
to analyze that “pullback power” in real time, we developed
MeanReversionAnalyzer
.
■ What is MeanReversionAnalyzer?
MeanReversionAnalyzer measures the
“pull back force toward the mean” of currency pairs
「Mean reversion power」
using models from physics and financial engineering
as an MT4 indicator.
Many traders have a sense that
“if price strays too far from the moving average, it will come back eventually.”
But in reality,
- some currencies revert quickly
- some never revert
- some simply keep marching
exist.
This indicator visualizes that difference as
a single value called θ (theta).
■ The image is a “price connected to a spring”
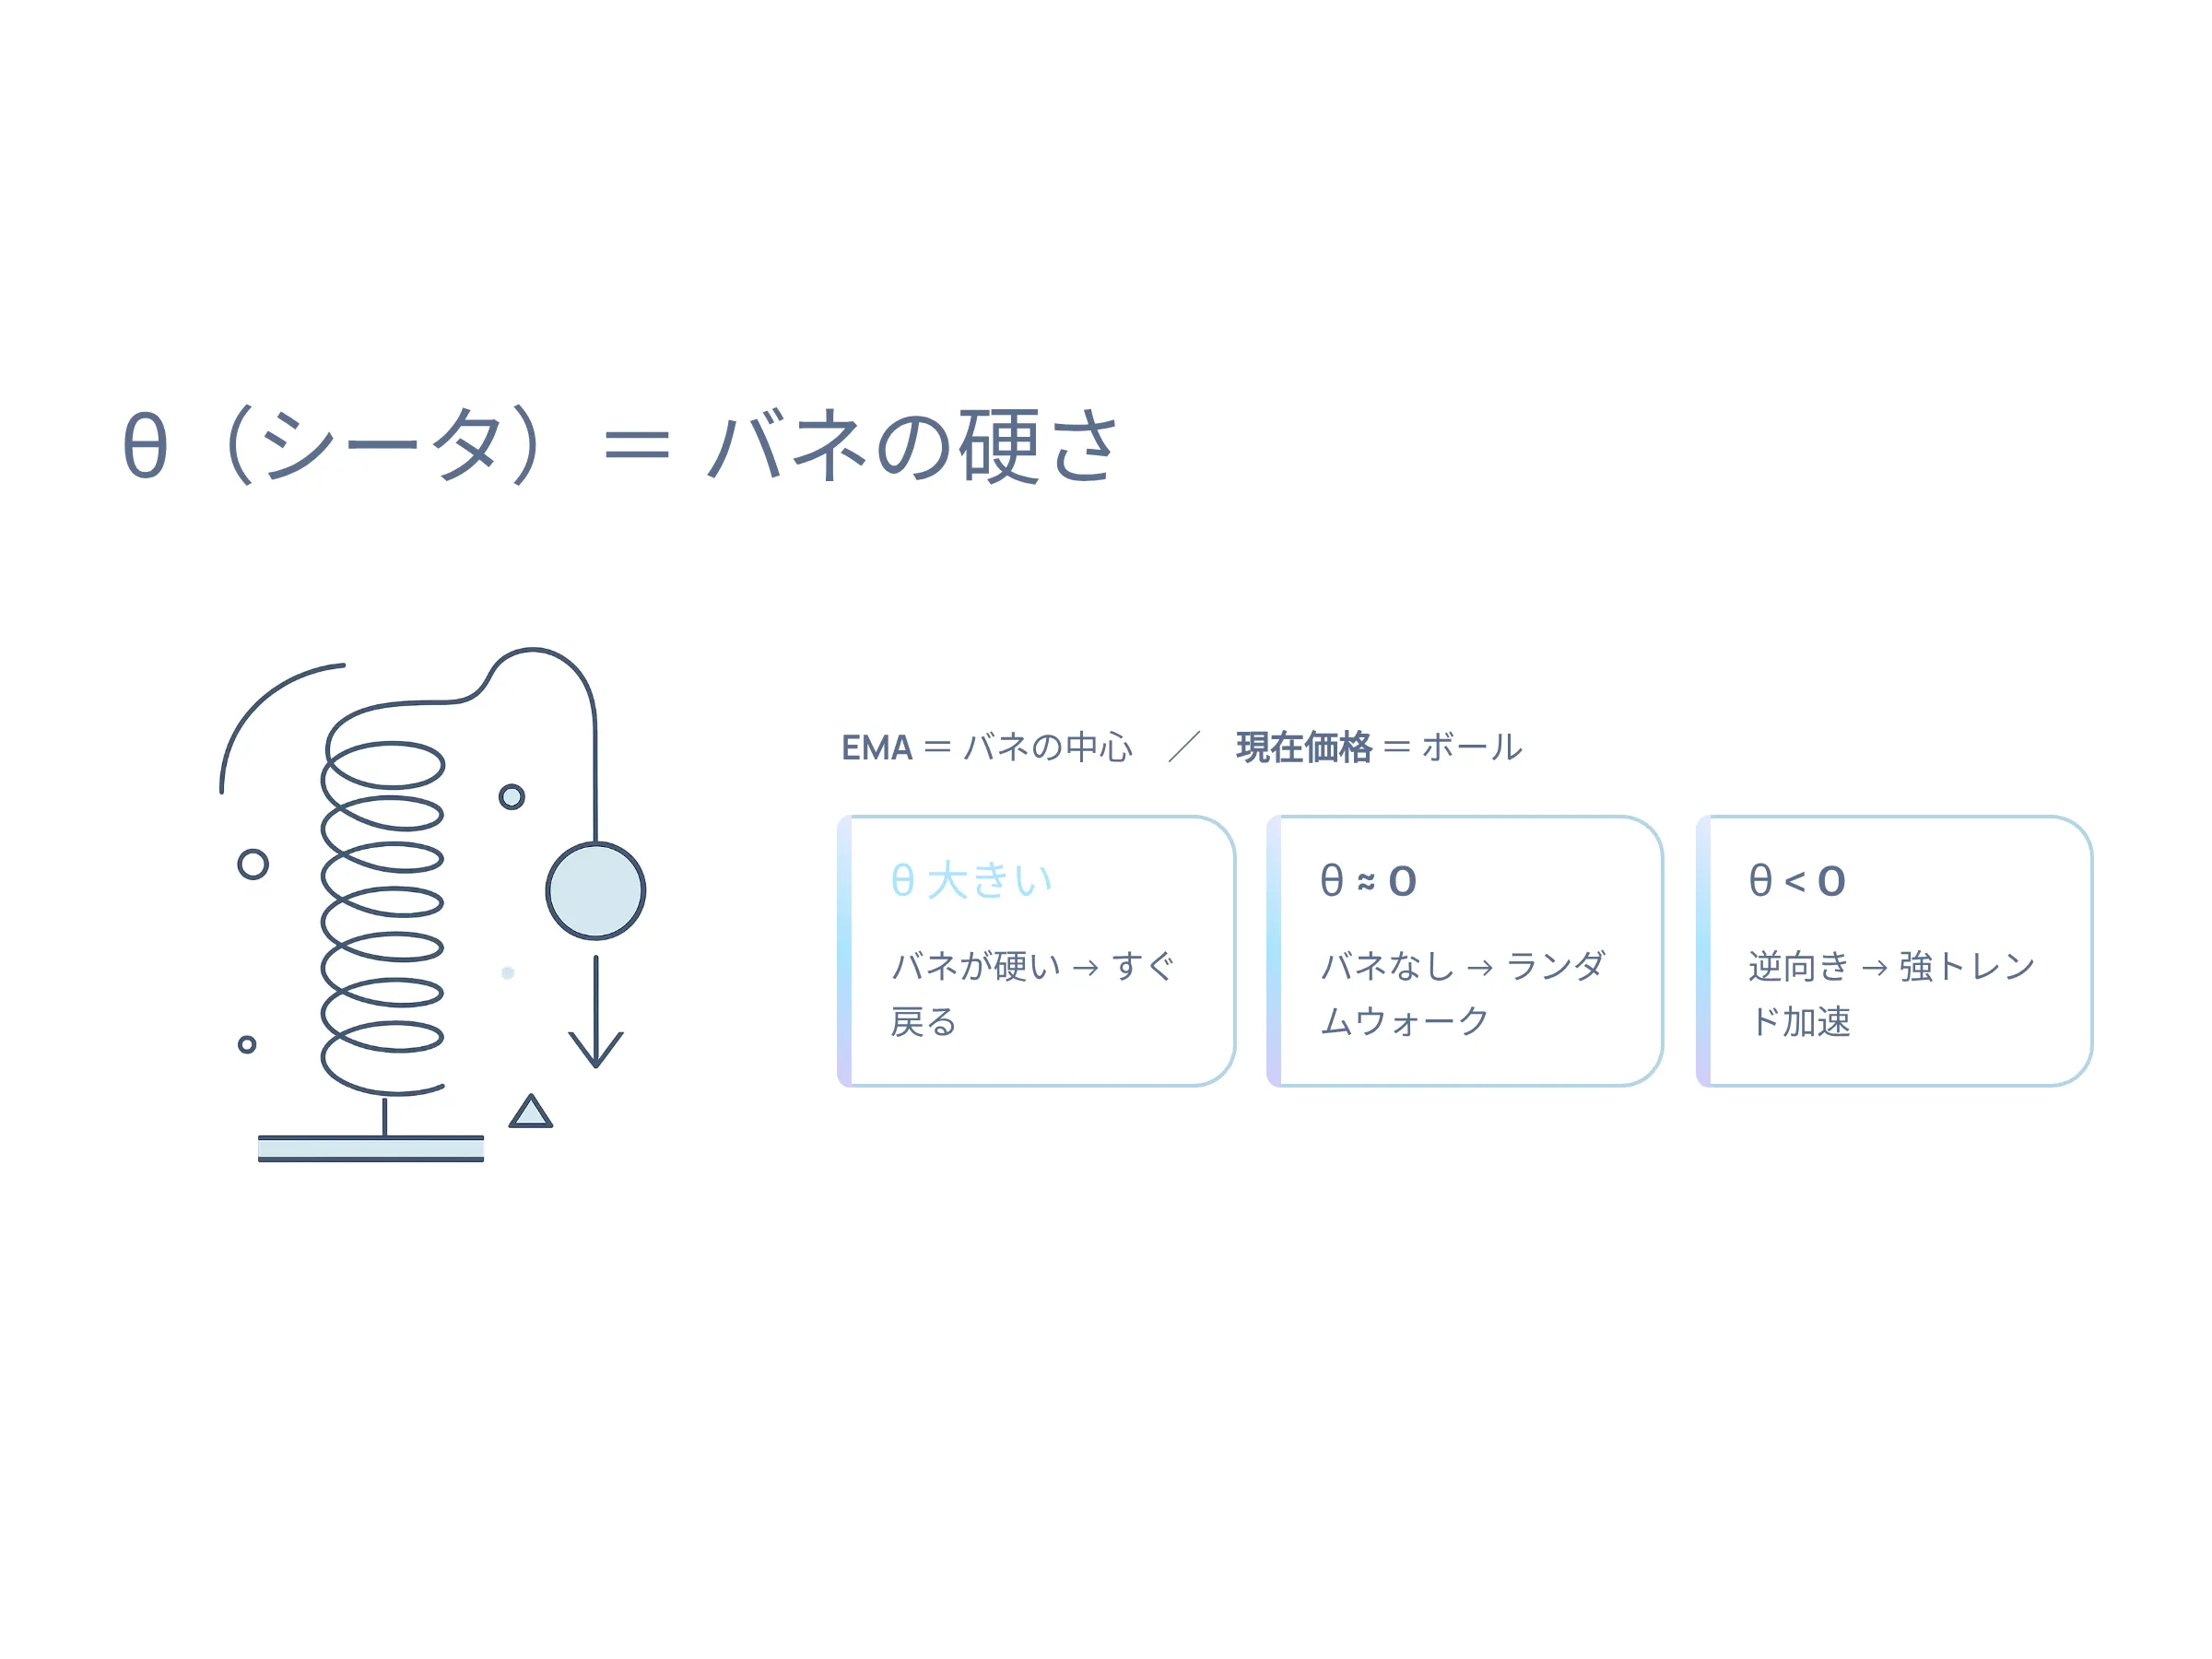
It’s easy to understand if you imagine it.
● EMA (moving average) = center of the spring
● Current price = ball
● θ (theta) = stiffness of the spring
When the price moves away from the EMA,
the market tries to bring it back to that price.
However,
that “pullback force” differs by currency.
θ large
→ spring is stiff
→ price reverts quickly
→ mean reversion is easy
θ ≈ 0
→ almost no spring
→ drift randomly
→ close to a random walk
θ < 0
→ spring in the opposite direction
→ diverges faster as it moves away
→ strong trend
■ Why not analyze price itself?
This is quite important in this work.
First,
to regress and obtain a mean-reversion coefficient.
However, with this,
- EURTRY
- BTC
- NASDAQ
being long-term rising assets,
“they are mean reverting”
could be misjudged as mean-reverting.
The reason is that,
actual markets are:
That’s why.
In other words,
“Price itself”
is not what we should look at,
“How far it deviates from the mean”
should be examined.
■ The core of MeanReversionAnalyzer
is created,
and then its deviation is analyzed to see whether it
- reverts
- expands
to determine the behavior.
“not the price itself, but how far it deviates from the average”
.
■ Mathematical background: OU process
The model used is well-known in financial engineering:
the Ornstein-Uhlenbeck Process (OU process).
It can be written as:
The meaning is simple.
If Z drifts away from the mean
↓
−θ works to pull it back
↓
but there is also random σ noise
In other words,
“pullback force” and “randomness”
are balanced.
■ What actually appears on the screen?
In the top left of the chart,
the real-time analysis results are displayed.
=== MeanReversionAnalyzer ===

Pair : USDJPY
TF   : H1
EMA  : 200

--- TREND ---
Theta(Raw) : 0.0012
EMA Slope  : -0.12%

--- REVERSION ---
Theta(Dev) : 0.0531
HalfLife   : 13.2 bars
Deviation  : -1.82%

ADF         : Stationary
Hurst       : 0.37

--- REGIME ---
Range Mean Reversion
■ Half-Life is quite interesting
What is particularly important here is:
Half-Life
This means:
“the average time for the deviation to revert to half”
For example:
- HalfLife = 5
→ reverts quite quickly - HalfLife = 50
→ does not revert easily
In short,
“how long to wait before it reverts”
is observable.
This is also quite useful for discretionary traders.
■ Automatically identifying four market regimes
In this indicator,
the market is classified into four types.
| Regime | State |
|---|---|
| Range Mean Reversion | Range reversion |
| Trend + Pullback Reversion | Trend + pullback |
| Strong Trend | One-way trend |
| Random Walk | Random |
This is very convenient.
For example:
- Markets where RSI contrarian strategies work
- Markets where dips are good to buy
- Markets where only trend-following is dangerous
can be distinguished.
This indicator is not a forward-looking predictive tool.
Rather, it analyzes
“whether there is statistical edge in the current market”
.
In other words:
- edge of mean reversion
- edge of trend continuation
- or the absence of any edge
to see.
■ What I want to do next
Even now it’s quite interesting, but
in the future I’d like to add:
- Multi-pair ranking
- Combination with currency strength
- AI-based regime classification
- Pair-specific optimal Half-Life
- Theta maps by time frame
and other enhancements.
■ Summary of Episode 6
- Markets have a varying strength of pullback power
- That power can be quantified by θ (theta)
- What matters is not the price itself but its deviation from the mean
- We can measure mean-reversion in OU processes
- Half-Life tells us the speed of return
- We can classify market regimes
- MeanReversionAnalyzer is a tool to analyze market properties
■ Next episode preview (Episode 7)
Next time,
“How much mean reversion do actual 28 currency pairs exhibit?”
will be analyzed in ranking form.
- Is USDJPY really easy to revert?