
Gold Analysis 2026/05/26
【Daily chart】
It is a bullish candle, but because it touches the short-term MA with an upper shadow, I personally am bearish.
【4-hour chart】
It is declining from the neck line of a head-and-shoulders pattern.
If it closes above around 4579, an rise up to around 4625 is expected.
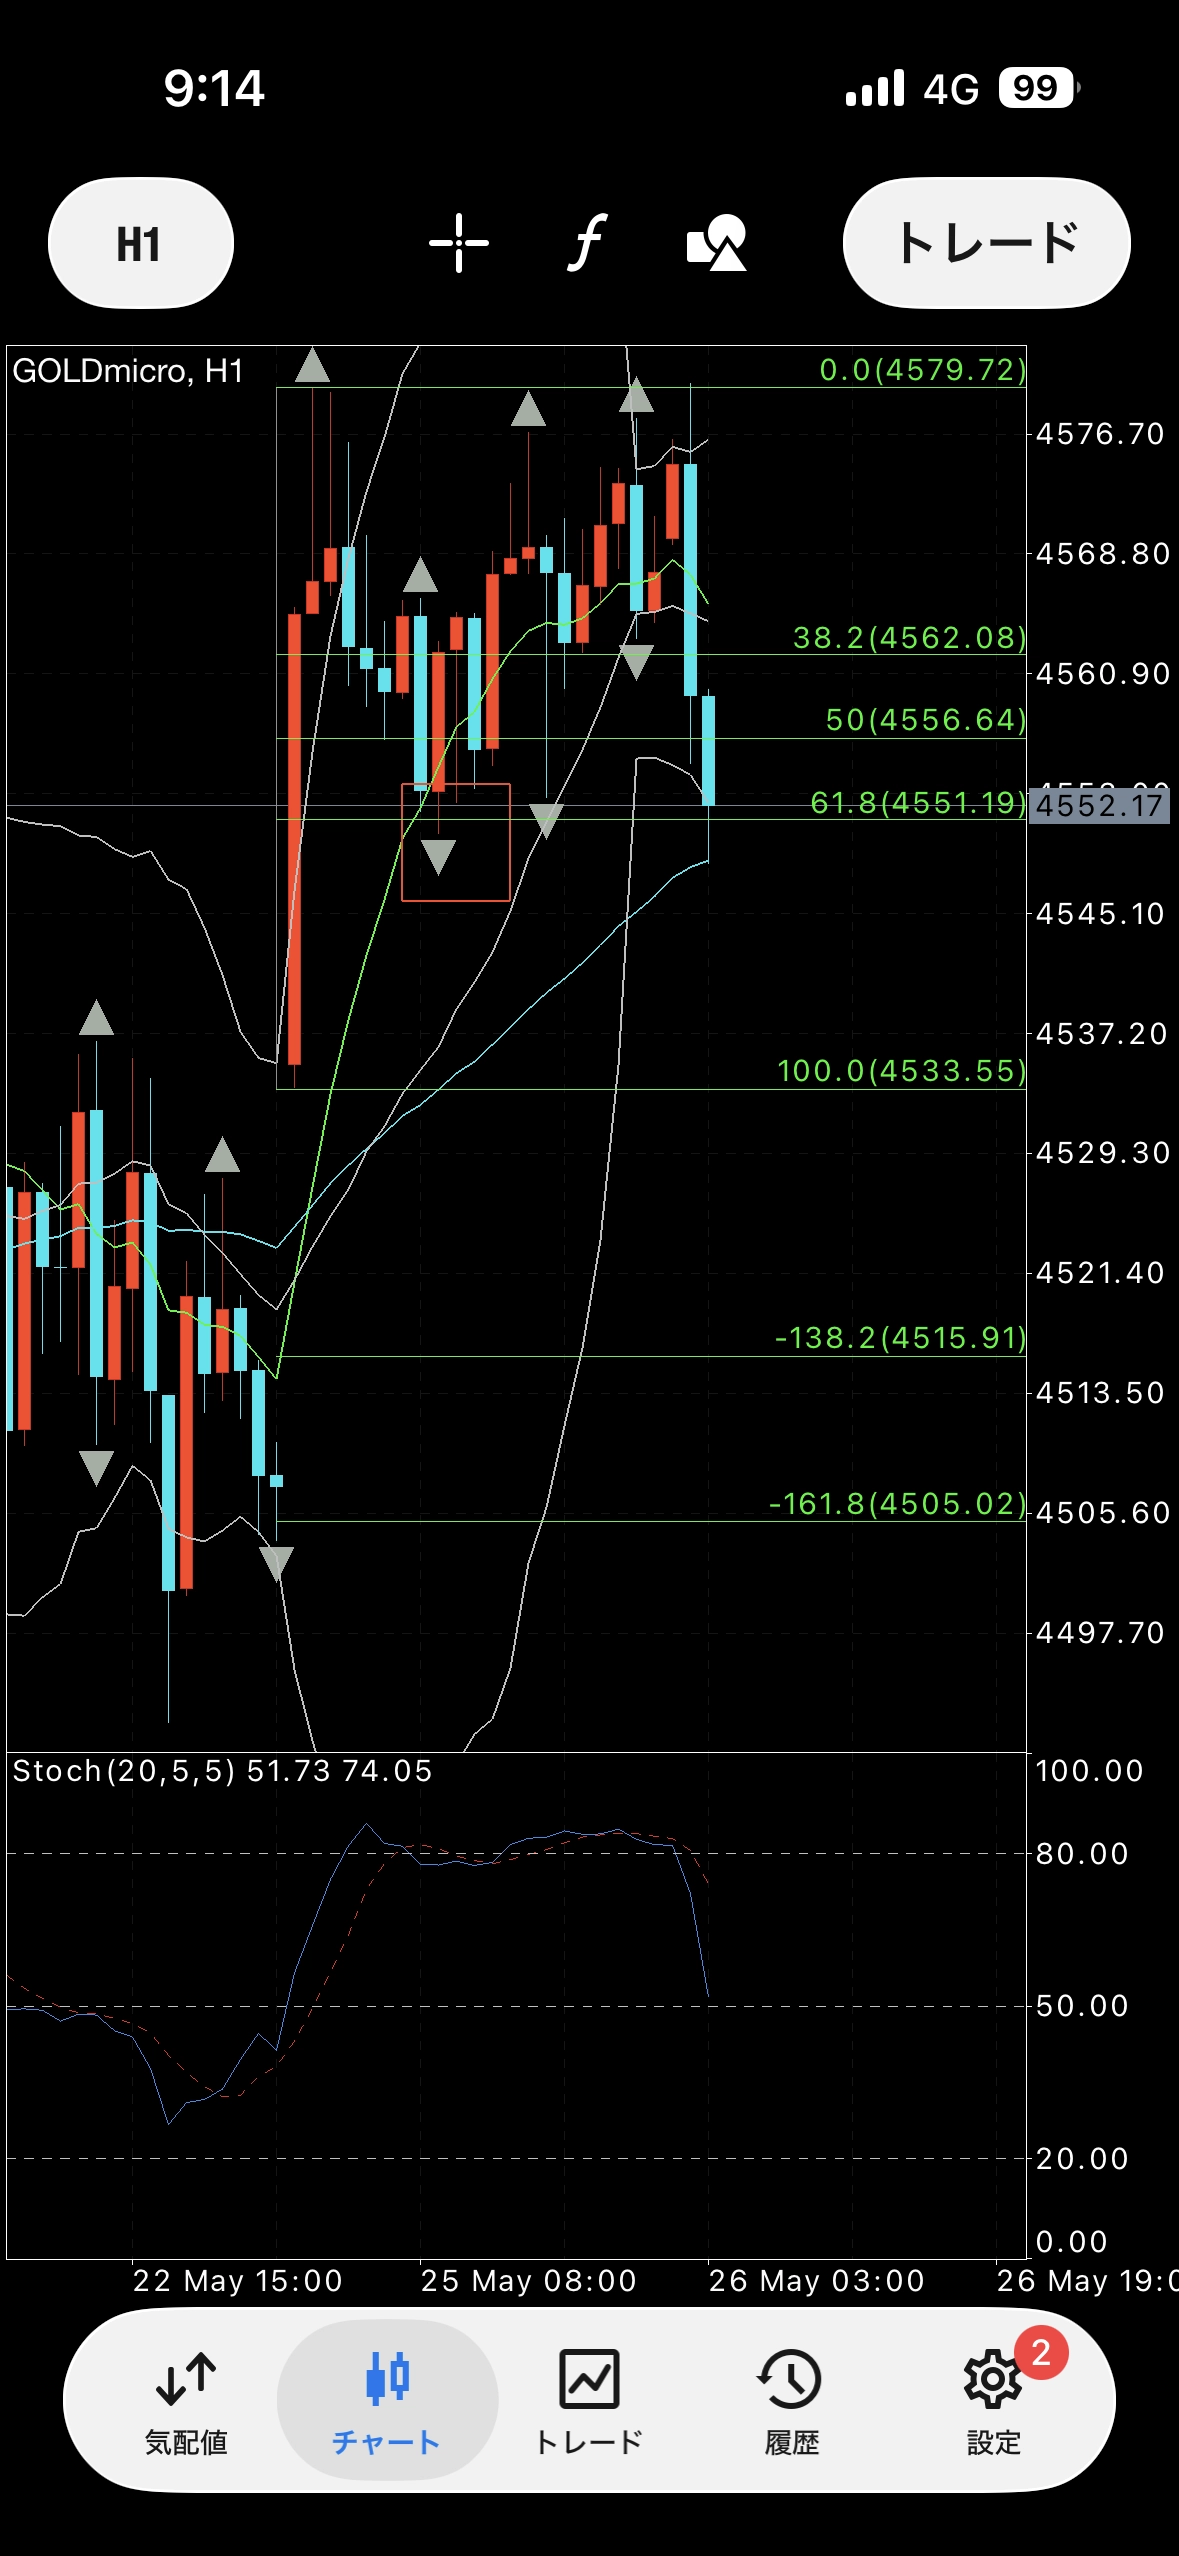
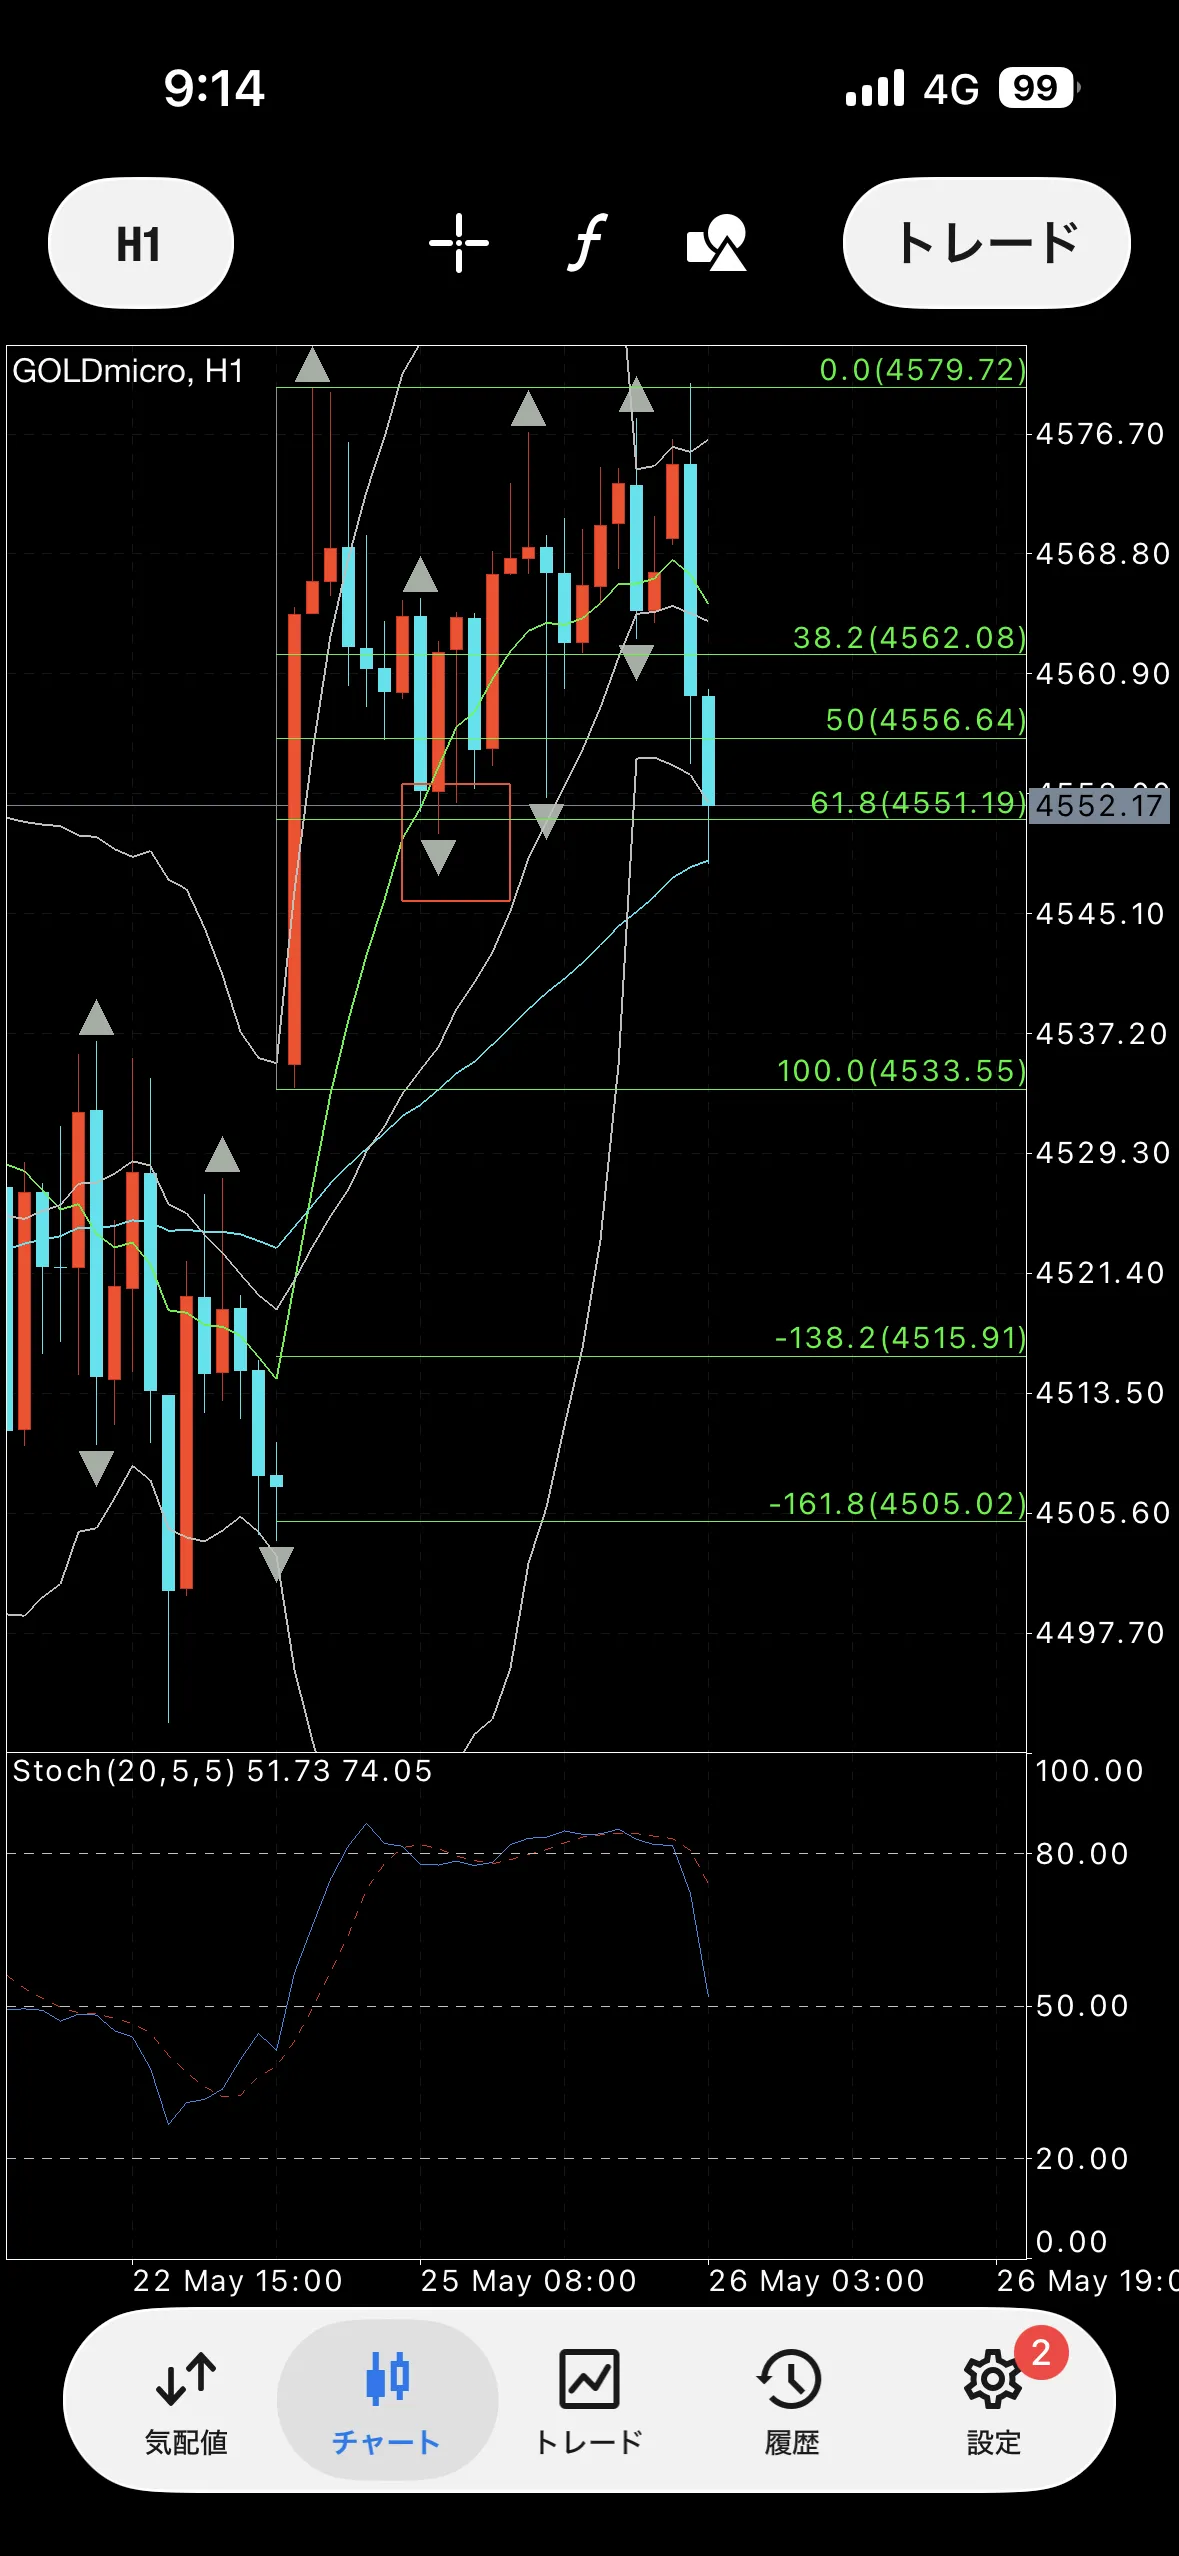
【1-hour chart】
It had been in an uptrend, but a bar that may bend downward is appearing.
If it breaks 4551, which could become the neck line, a W reversal pattern may be formed.
【Sell defense line】
4579
Around 4556
【Buy defense lines】
4533
4515
4505