

Intervention Aftermath PRO Catcher × TEPPAN|XAUUSD M15 EA Verification Report
The previous GOLD 15-minute example,
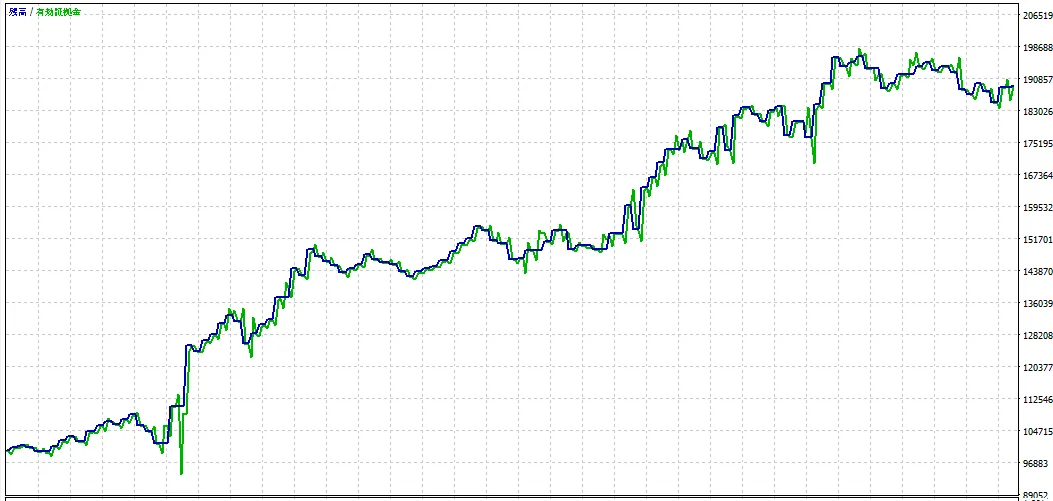
has been quantified through about 9 months of backtesting![]()
The decision process of the three-currency parity analysis × TEPPAN as seen on XAUUSD M15
This article is a sequel and deep-dive to the post dated May 11, 2026, titled “【Three-Currency Parity Analysis】GOLD 15-minute Example 공개 | Intervention Ripple PRO × TEPPAN.” Last time, we explained one real chart by eye, but this time we extend that thinking to approximately the past 9 months of XAUUSD M15, and quantify it with backtest results from a development-stage EA.
From visual inspection to numerical validation
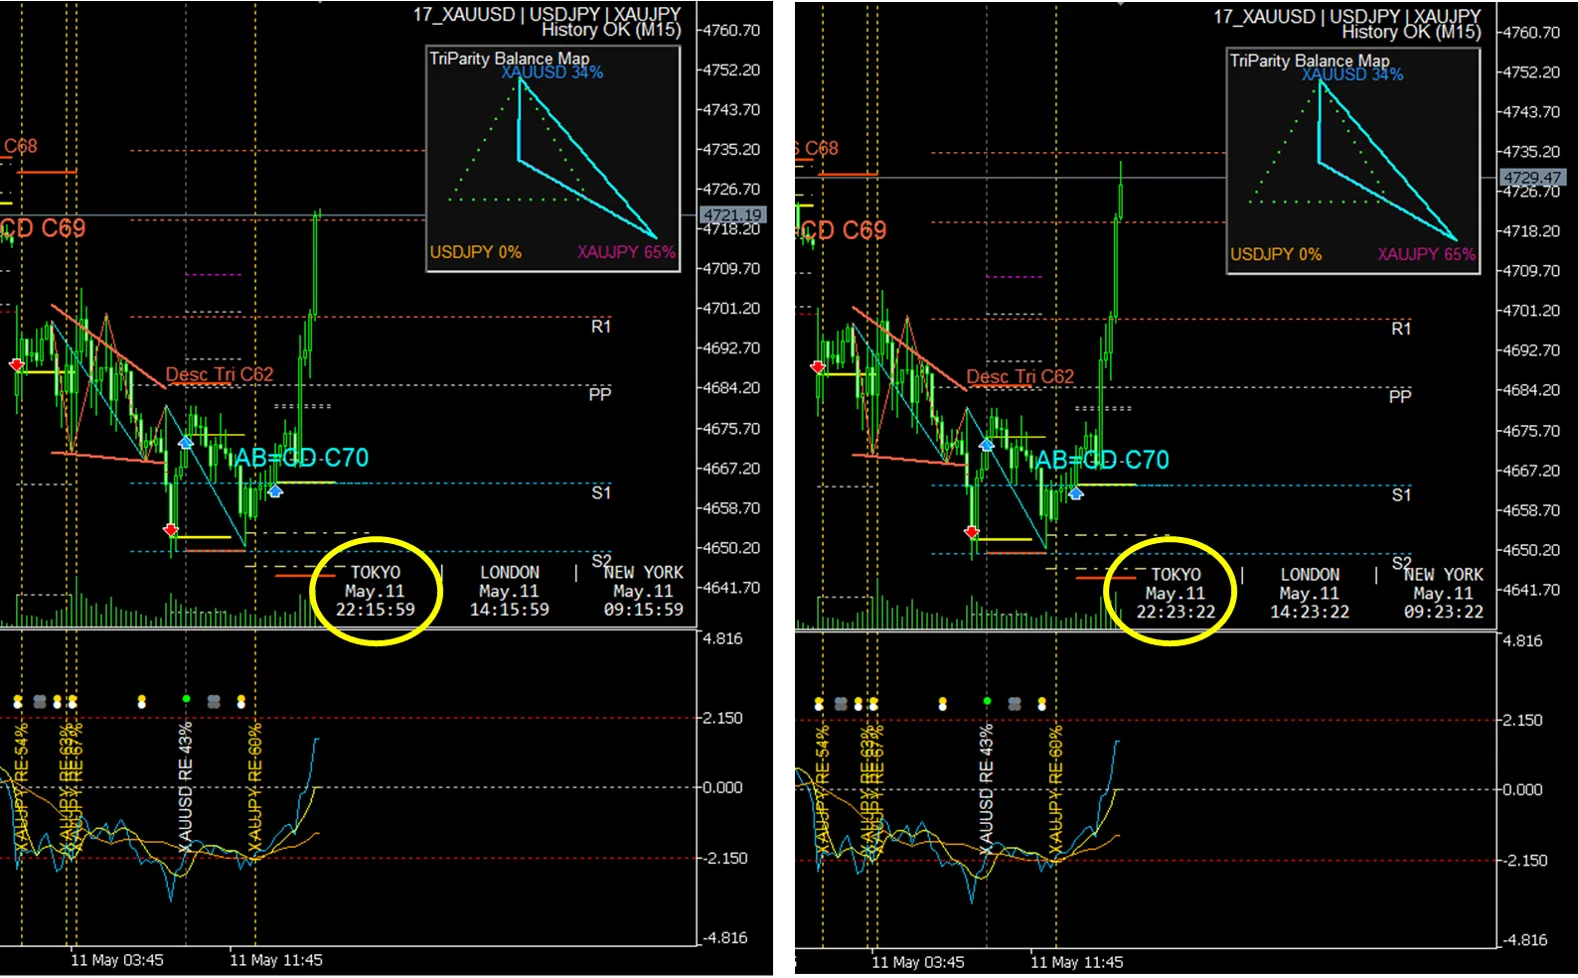
In the previous article, in XAUUSD M15, after the Long signal of Intervention Ripple PRO Catcher fired, the price turned back near the pivot line S1 just before hitting the SL, and moved upward in the Z=0 direction.
Subsequently, the AB=CD pattern of TEPPAN appeared, and with an overlay of an additional long signal, it was explained as an example where the “distortion regression” in three-currency parity analysis and the “rising structure” in price-pattern analysis pointed in the same direction.
In this article, we share the results of quantifying such visually observed advantages as backtests over approximately the past 9 months using automated trading. However, the important point is not the EA’s performance itself. The EA is to automate Catcher and TEPPAN’s decision process and verify it on historical data.
XAUUSD M15|Backtest results for the past ~9 months
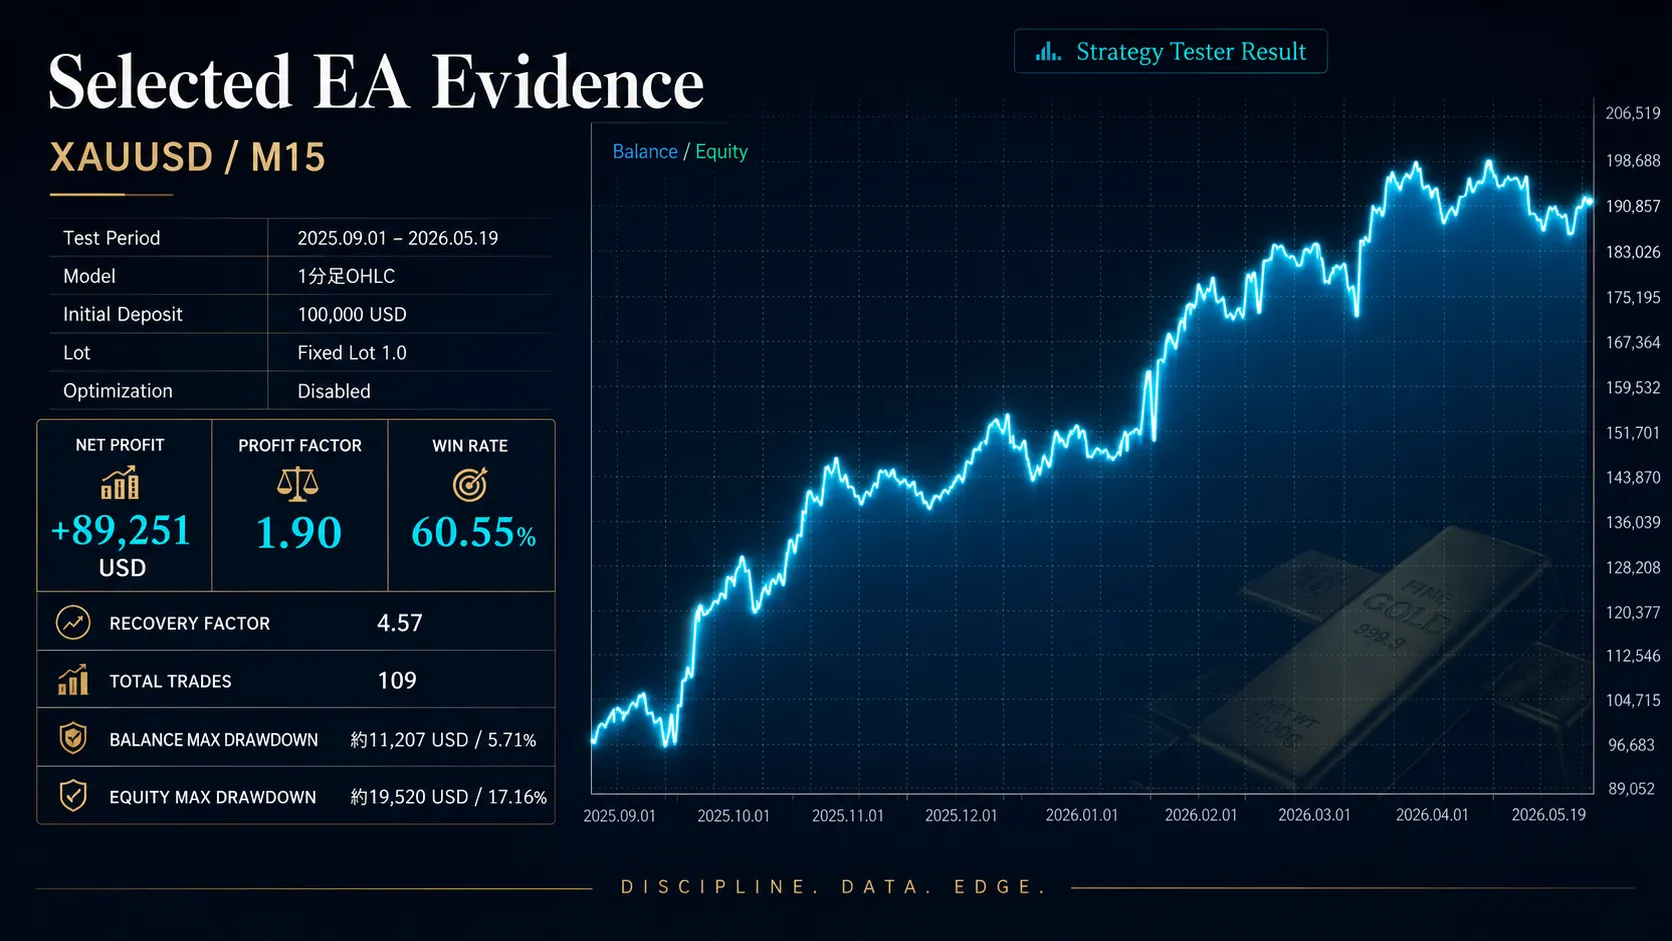
This verification targets XAUUSD 15-minute bars. The period is from 2025-09-01 to 2026-05-19, the model uses 1-minute OHLC, the lot size is Fixed Lot 1.0, and optimization is Disabled.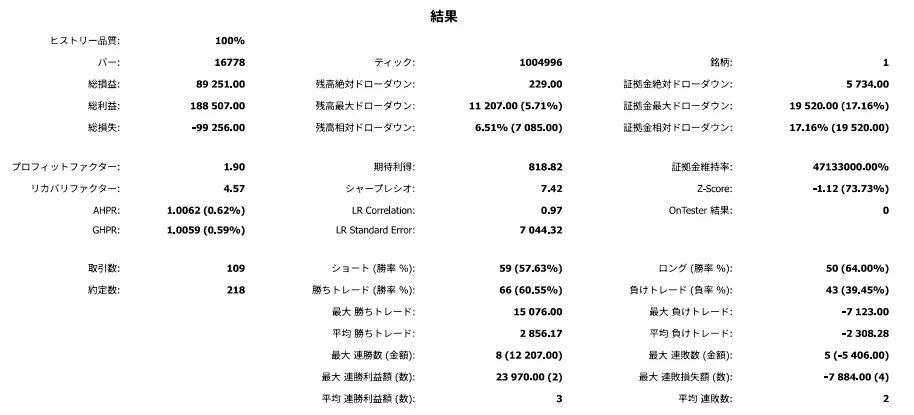
This is not a finished EA sale record
These results are validation results from Strategy Tester on a development EA. They do not guarantee profits in actual operation. Also, these results are for a specific period and conditions of XAUUSD M15 and do not imply the same results across all instruments and timeframes. However,they provide initial evidence that the Catcher and TEPPAN decision process shows a certain edge on historical data and is therefore very important validation.
Relationship between prior visual verification and this time’s numerical verification
The prior article introduced the Catcher and TEPPAN combined usage concept based on one real chart example. This article applies that concept to about the past 9 months of XAUUSD M15 and quantifies it as an automated backtest. This is not just a single success story; it’s a step to validate the same thinking on historical data.
What was seen in the May 11 real example
The backtest this time mechanically verifies such decision-making ideas using the developing EA. In other words, it is an attempt to confirm the advantages observed by eye as a verification result.and to confirm it as evidence.
Differences from typical XAUUSD analysis
Typically, XAUUSD analysis centers on XAUUSD’s own candlesticks, moving averages, RSI, horizontal lines, pivots, price patterns, etc. In contrast,Intervention Ripple PRO Catcherlooks at three currencies and three markets: XAUUSD, USDJPY, XAUJPY, to observe distortions and misalignments in price relationships, i.e., “distortions.” Furthermore,TEPPAN VIEWER / CONFIDENCEcombined with them allows verification of distortion direction against price patterns, entry candidates, SL candidates, TP candidates, and confidence.
Trading signals are not just arrows
The developing EA does not treat trading signals as simple arrows.When multiple elements overlap—pattern recognition, Confidence Score, three-currency parity environment, RR conditionsthe signal becomes a potential trading candidate.
Flow to signal firing
In short, the signal is not simply pattern recognition; only when pattern recognition × Confidence Score × three-currency parity environment × RR conditions overlap is it treated as a trading candidate.
Exit logic|Do not think of take-profit and stop-loss only as fixed pips
In this verification, entries were Market Only, and exit design used TP2 / SLTP1-type exits with good results. Importantly, exit should not be viewed as mere fixed-pip profit-taking or loss-cutting.
Basic philosophy of exit
Based on the pattern targets and neutralization lines that TEPPAN presents, recent highs/lows, PRZ, and TP candidates, together with the distortion-resolving direction shown by Catcher, we set exits. In other words, exits are designed to consider“how far this pattern can extend”and“where on the three-currency parity the distortion is likely to resolve”in combination.
Take-profit logic|Don’t stop at TP1; also consider TP2 direction
Profit-taking is guided by TP suggestions from TEPPAN. TP1 is the initial target; TP2 is the next target if the pattern extends straightforwardly. For volatile instruments like XAUUSD M15, extending toward TP2 under certain conditions can be beneficial. However, to target TP2, ensure that at entry RR is not deteriorated, Catcher distortion direction remains, and CONFIDENCE direction remains valid.
Stop-loss logic|SL as a scenario-denial line
Stop-loss is not just about “how many pips against you to cut.”Base it on where TEPPAN-patterns collapse, near recent highs/lows, or outside PRZ. For LONG, SL candidate is a lower line that would break the pattern; for SHORT, an upper line that would break the pattern.
SL is not only to limit losses but also to mark a boundary where the scenario is deemed incorrect. Check SL candidates from TEPPAN VIEWER and the state of CONFIDENCE together.
Discretion allows flexible exits by watching screen changes
In an EA, entries hit TP/SL and exit mechanically. In discretionary trading, you can make more flexible exit decisions while watching Catcher and TEPPAN screens.
Even without EA, the decision process can be reproduced
EA is for automating and validating this decision process. However, the core information can be verified on Catcher and TEPPAN VIEWER / CONFIDENCE screens. In other words, you can apply the same thinking to discretionary judgments without EA.
Steps to reproduce discretionary decisions
How to read backtest results
In this result, Net Profit is +89,251 USD, Profit Factor is 1.90, Recovery Factor is 4.57, Total Trades are 109, and Win Rate is 60.55%.
Rather than just looking at the 60.55% win rate, consider the balance of PF 1.90, Recovery Factor 4.57, and drawdown to view results as not merely a high-win-rate type but a balance-inclusive verification.
Equity Max Drawdown is about 19,520 USD / 17.16%. XAUUSD is a highly volatile instrument, so for live use, carefully check lot size, acceptable loss, indicator avoidance, spread, and broker environment.
Future verification items
Flow from the previous article to this one
In the previous article, we introduced Catcher’s distortion regression and TEPPAN’s AB=CD pattern aligning in the same direction based on a single XAUUSD M15 chart example.This article expands such judgments to about the past 9 months and quantifies them as backtests with a development-stage EA. This is not just a single success story, but the next step to validate the same thinking on historical data.
Related products
Intervention Ripple PRO Catcher
A three-currency parity analysis tool that visualizes market distortions, Z-Score, Balance Map, and distortion direction that aren’t easily seen on a single chart.
From the XAUUSD / USDJPY / XAUJPY relationships, you can observe a distortion reversion that isn’t obvious on a single chart.
View Intervention Ripple PRO product pageTEPPAN VIEWER / CONFIDENCE
TEPPAN VIEWER visualizes price patterns, Entry candidates, SL candidates, and TP candidates on the chart. TEPPAN CONFIDENCE helps determine whether there is the quality to enter the pattern.
Using Catcher together makes it easier to confirm that the price-pattern shape aligns with the distortion direction on three-currency parity.
View TEPPAN product pageThree-Currency Parity Analysis Master Material
A learning resource that covers distortion fundamentals, observation, recording, and verification, not merely “a tool to see signals.”
If you want to understand Catcher and TEPPAN decisions more deeply, this serves as supplementary WHY material.
View Master Material product pageEnter not because a shape appeared, but after confirming distortion, pattern, confidence, and exit
The prior article introduced the Catcher and TEPPAN usage concept on a real XAUUSD M15 chart. This article quantifies that decision process as backtests over about 9 months.
TEPPAN VIEWER visualizes patterns, entries, SLs, and TPs on the chart. TEPPAN CONFIDENCE confirms whether there is the quality to enter that pattern. And Intervention Ripple PRO Catcher confirms market distortions across markets and the direction in which they resolve.
By combining these, you can make more structural decisions: not “enter because a shape appeared,” but “enter only when distortions, patterns, confidence, and exits align.” The EA is an ongoing development to validate and automate this decision process, and Catcher plus TEPPAN is considered a valuable analytical approach for discretionary traders as well.
This article is intended to share indicator display examples, backtest results, and analysis processes, and is not investment advice or a buy/sell recommendation.
The backtest results, signals, target lines, pattern displays, Confidence, Z-Score, etc., do not guarantee future price movements, profits, win rates, or specific trade outcomes.
The verification results are for specific conditions on Strategy Tester and may vary in real operation due to spread, fills, slippage, broker environment, and market regime.
Please make actual trading decisions with your own responsibility and proper risk management.