

2026/5/23 Dollar-Yen, Gold, SP500, and Nikkei 225 environment
“Trend Line Pro 3”Page under construction
“World Standard MA Pro 3”Page under construction
To make the lines easier to see, we have reduced the chart scale.
Please check how the “Line” and “MA” are functioning as “support/resistance.”
For behavior verification, we prepare a weekly video of USD/JPY price movement.
USD/JPY
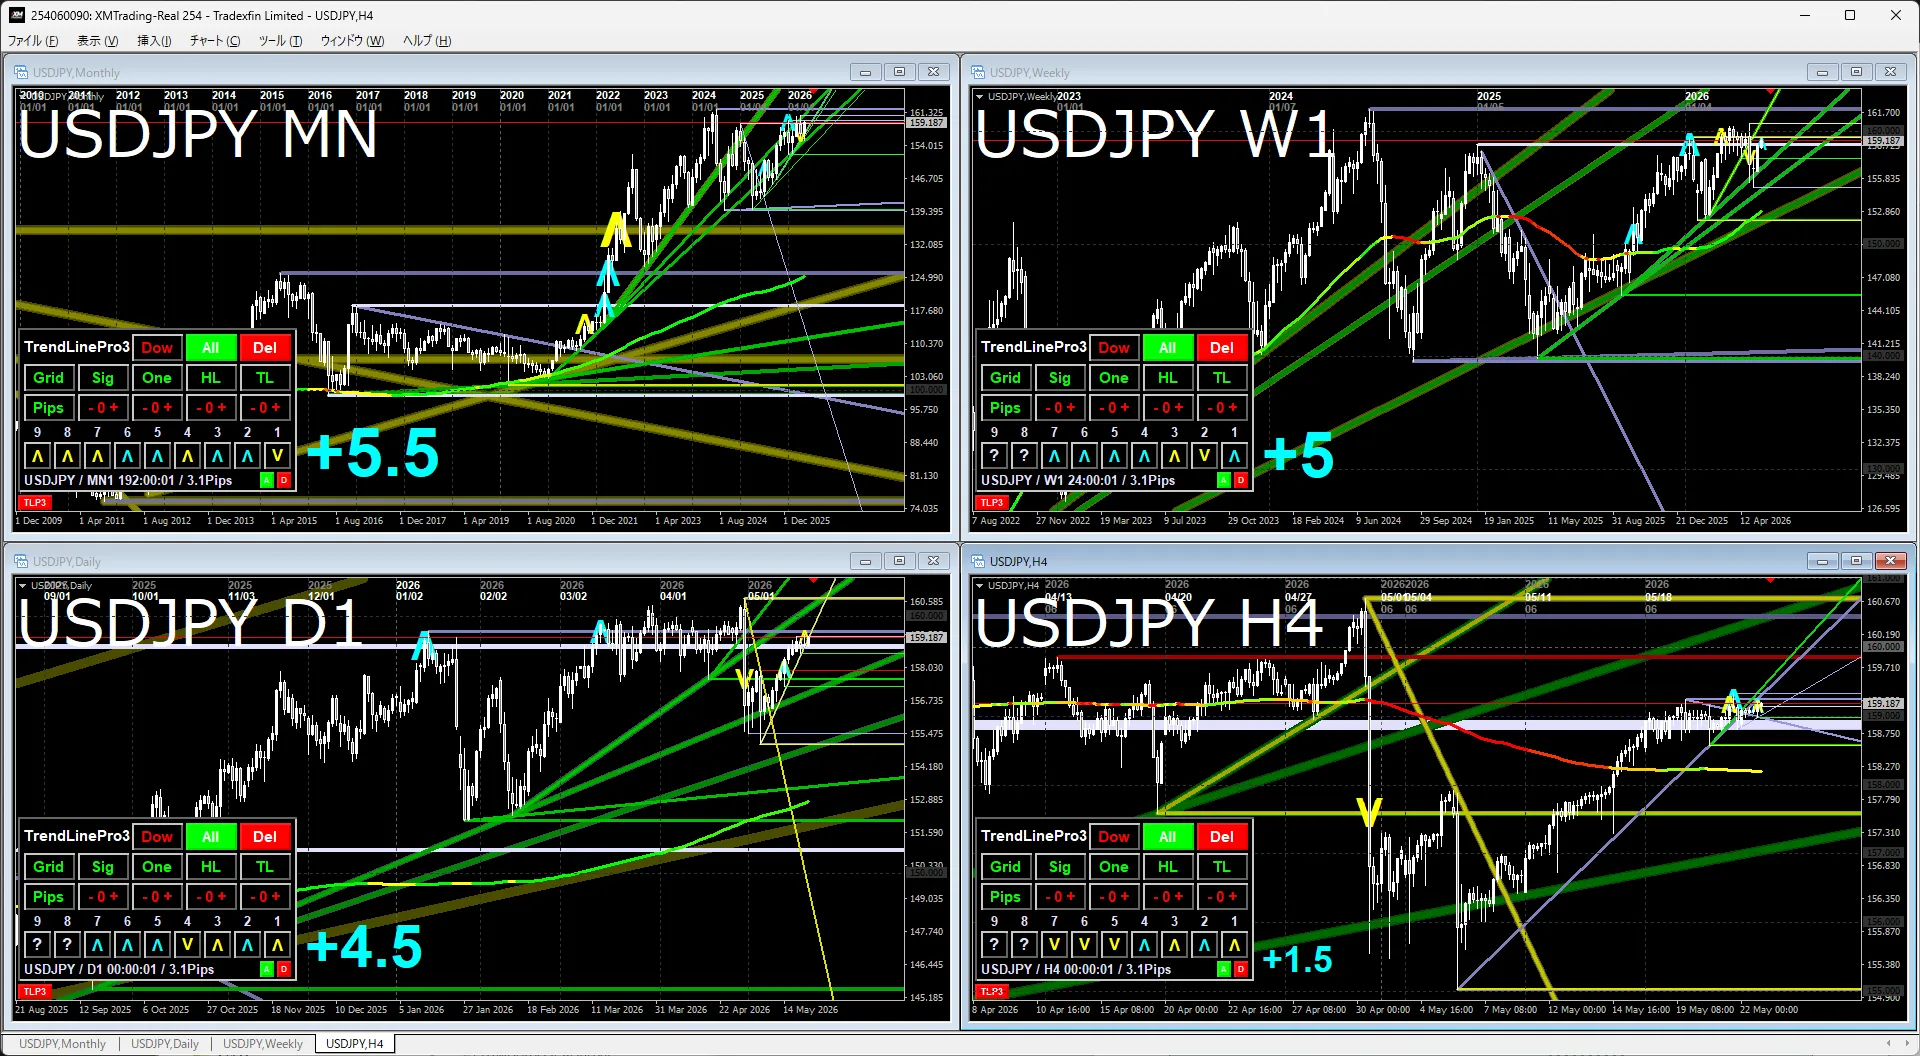
Monthly and weeklyIt has updated to a recent high, and it seems the next move is to test the monthly high.
Daily and 4-hourIf we want to properly strengthen the yen, we need daily adjustments on a monthly basis. For now, we are watching whether it stays flat or rises straightforwardly.
Gold
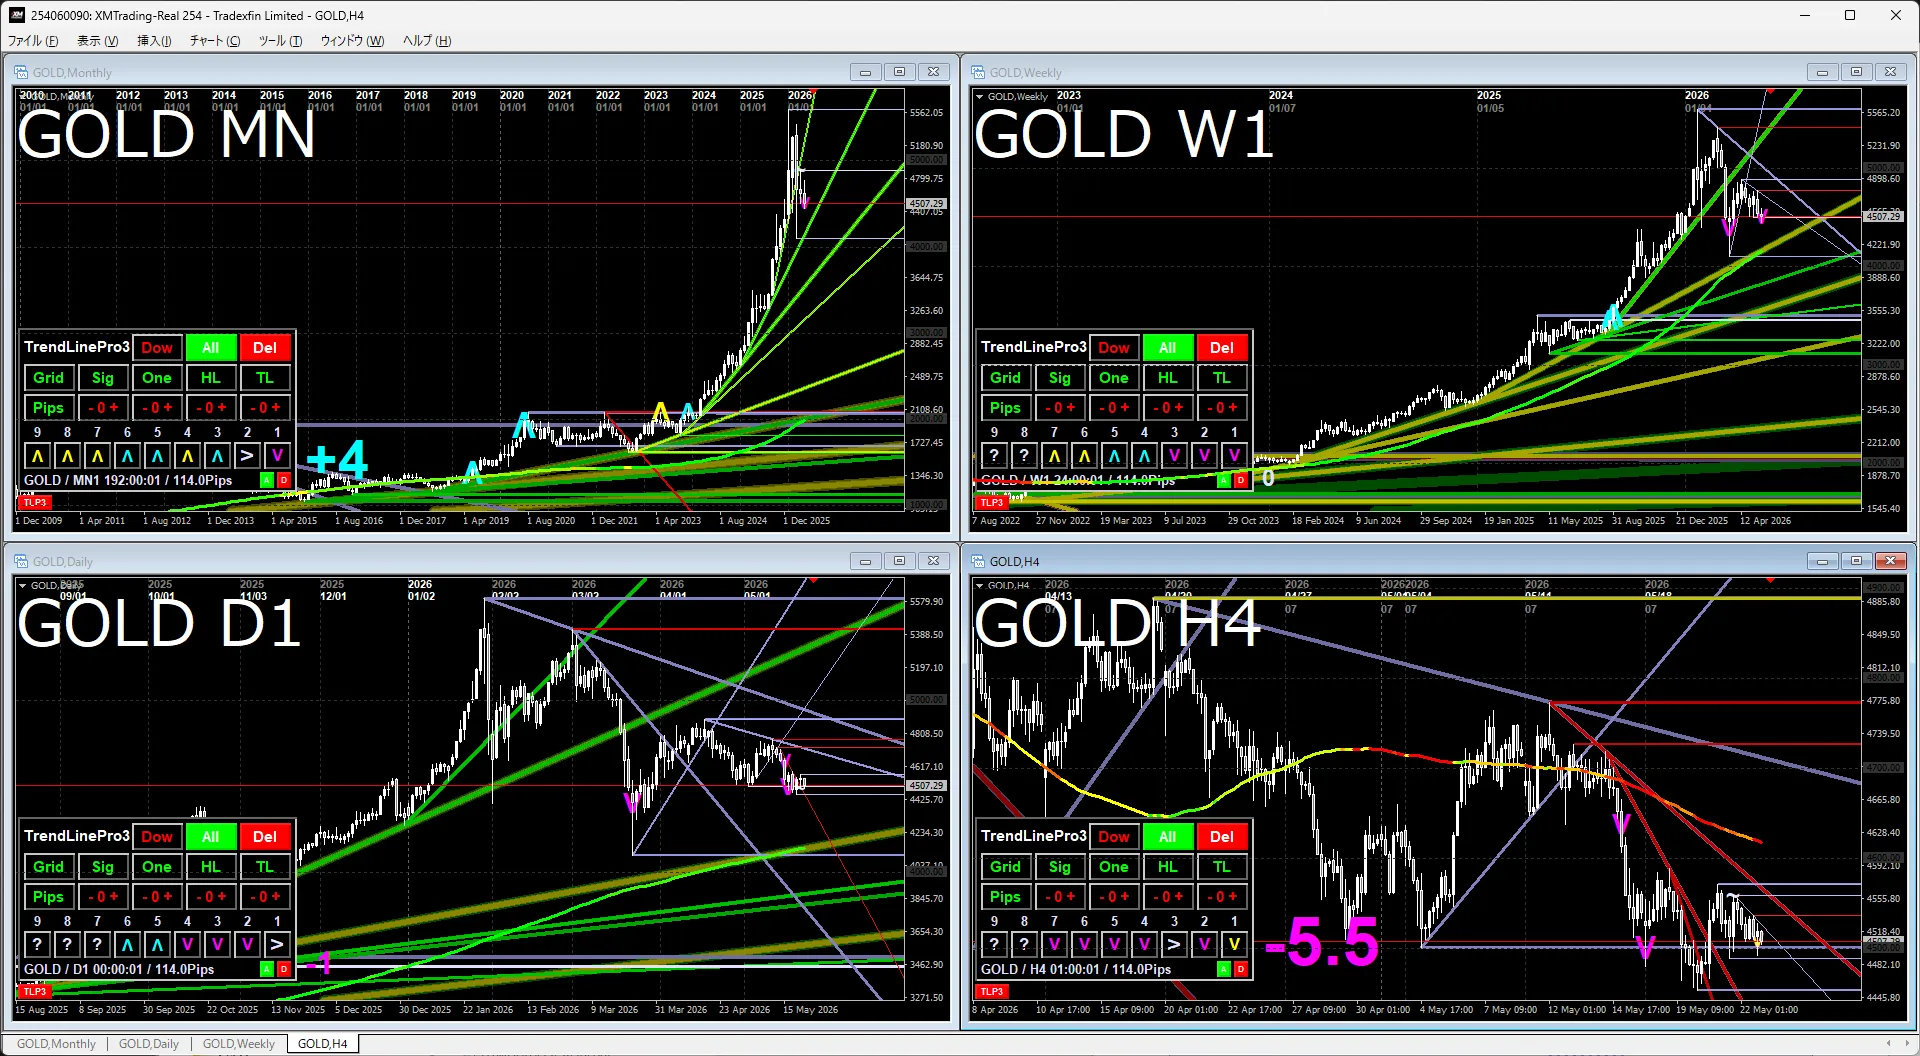
Monthly and weeklyAttention is on the depreciation of currency value, and gold remains a clear buy. Since money is flowing into stocks, it may move within the weekly triangle until that settles.
Daily and 4-hourEven if the daily price breaks recent lows, there is no clear directional signal on the score, so it may not drop all the way. On the 4-hour chart, a small inverted head-and-shoulders could form, suggesting a possible rise in the near term, and if it surpasses 4780, a larger inverted head-and-shoulders could be formed with the current level acting as the head, potentially turning market participants' view to the upside.
S&P 500
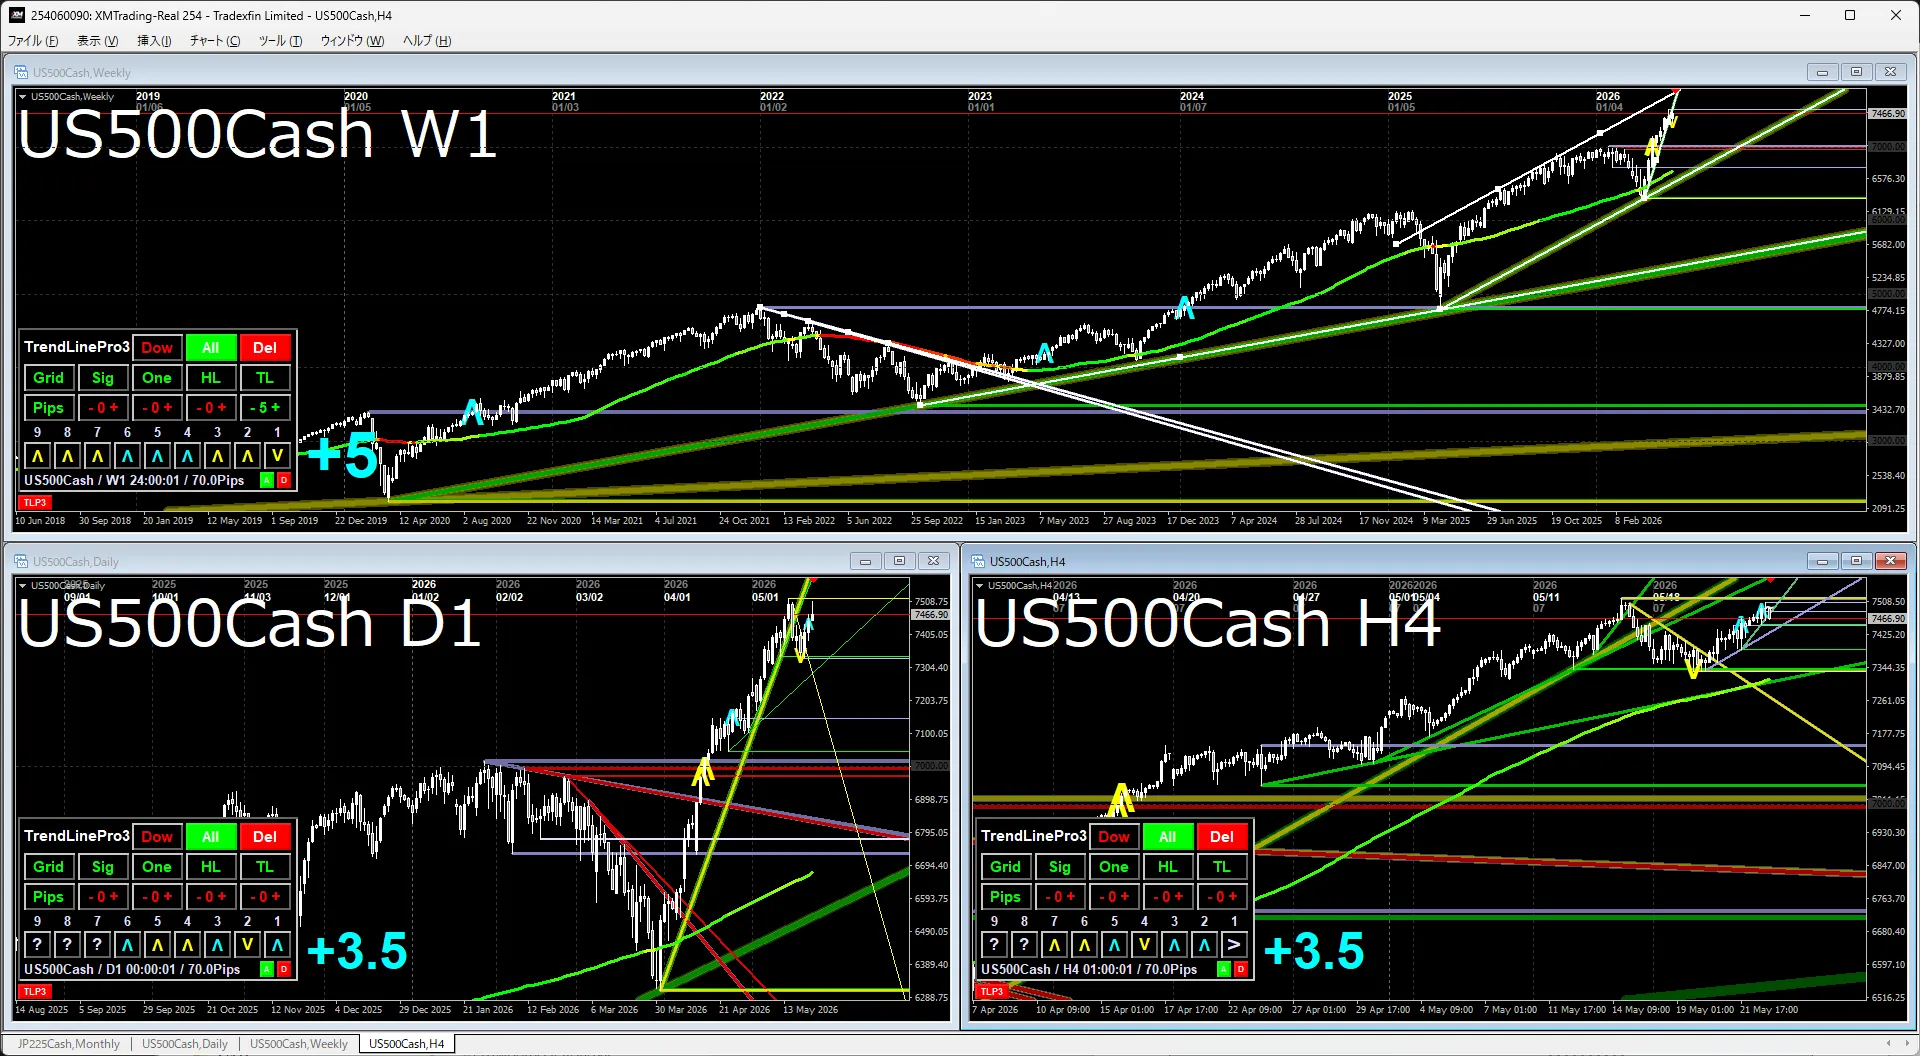
Monthly and weeklyRecent highs have been surpassed, and the uptrend is confirmed. It tends to attract buying due to favorable market sentiment.
Daily and 4-hourIn the near term, key levels to watch are the upper bound of the channel and a fall from around 7000 to around 6300, near 7700.
※ On the weekly chart, a white channel line is drawn by manipulating the panel buttons.
Nikkei 225
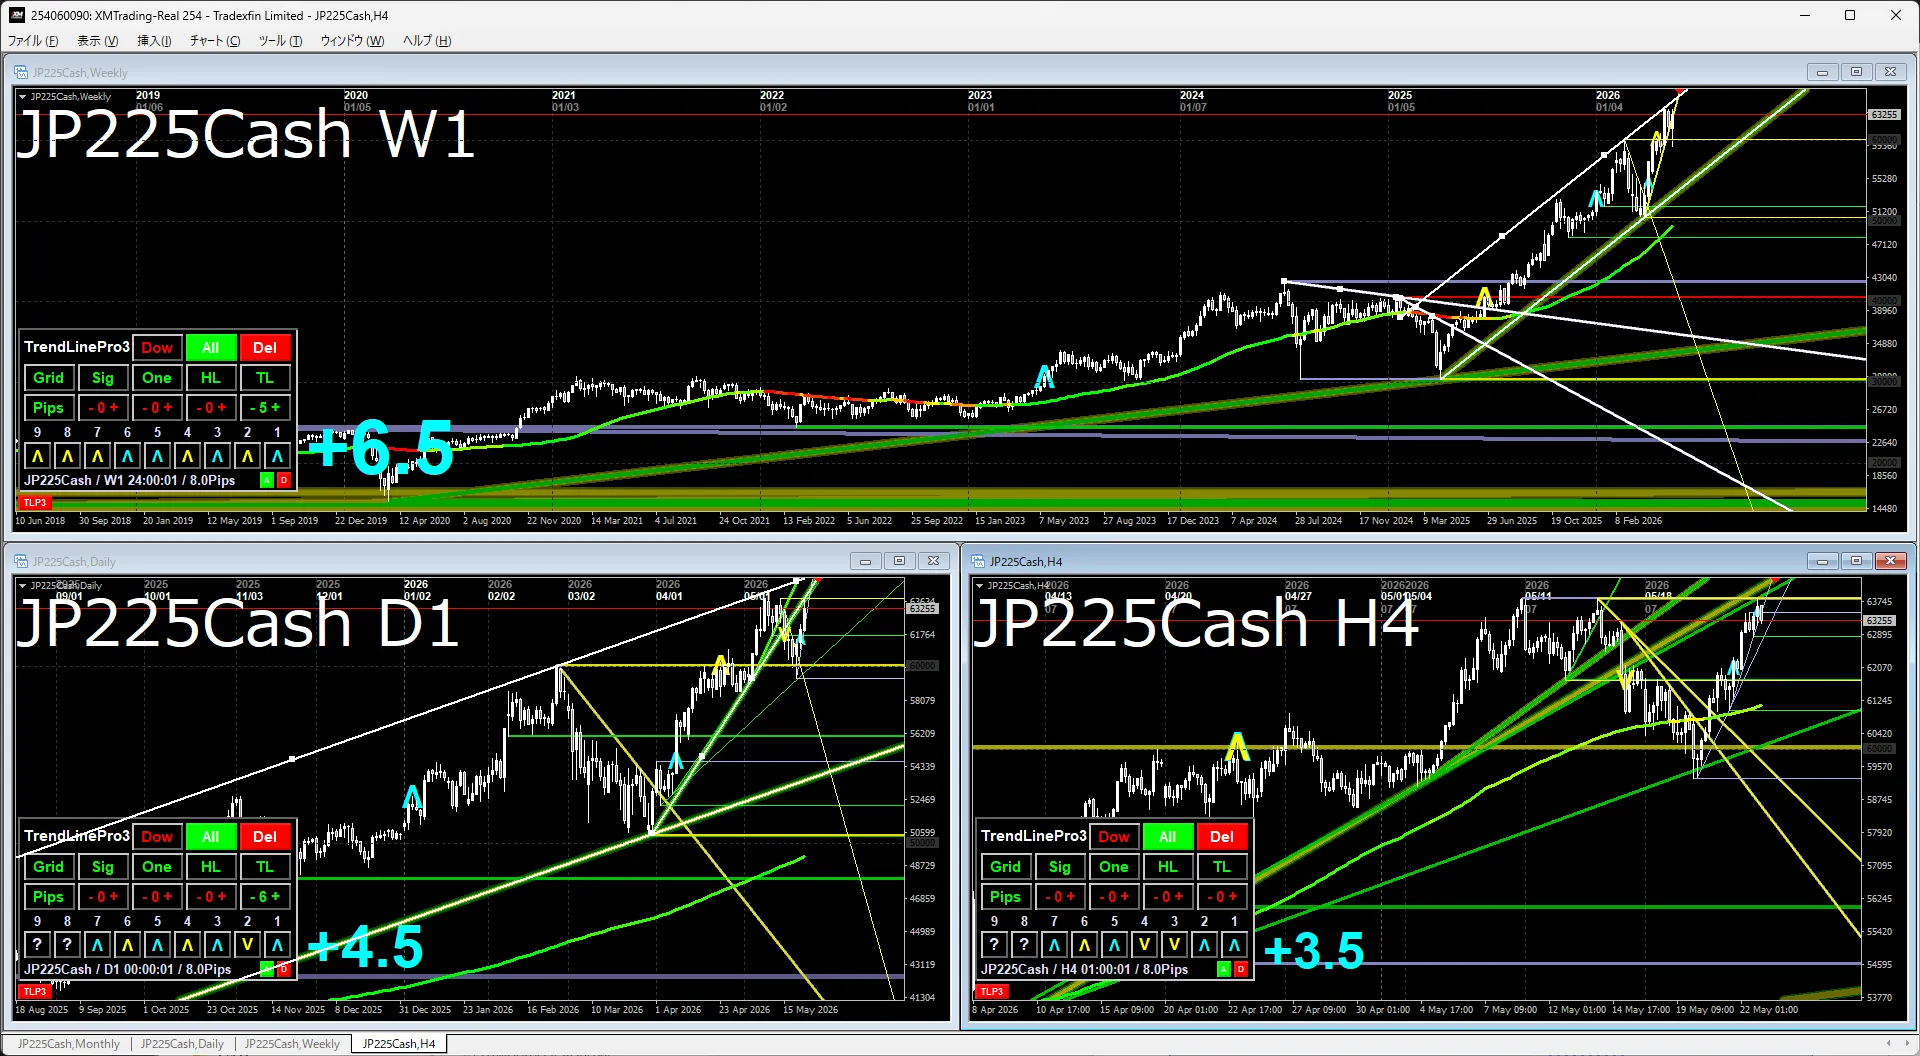
Monthly and weeklyWith a new high, the trendline has been redrawn, and the recent rise clearly indicates an uptrend. In the near term, it looks like it may pull back near the channel line.
Daily and 4-hourIt has risen close to the recent high, showing strength. We anticipate highs to be broken, but it may stay flat for a while.
※ On the weekly chart, a white channel line is drawn by manipulating the panel buttons.
The attached image indicators use the indicators listed below.
If you are interested, please take a look.