

[VP_GB Weekly Report] May 22, 2026 4 Stocks Price Trend
【VP_GB Weekly Report】May 22, 2026 - Market Trends of 4 Instruments
This week we continue with a review of the market using the VP_GB indicator. This time we checked four instruments—USDJPY, AUDJPY, GOLD, and NZDJPY—on M15 candles.
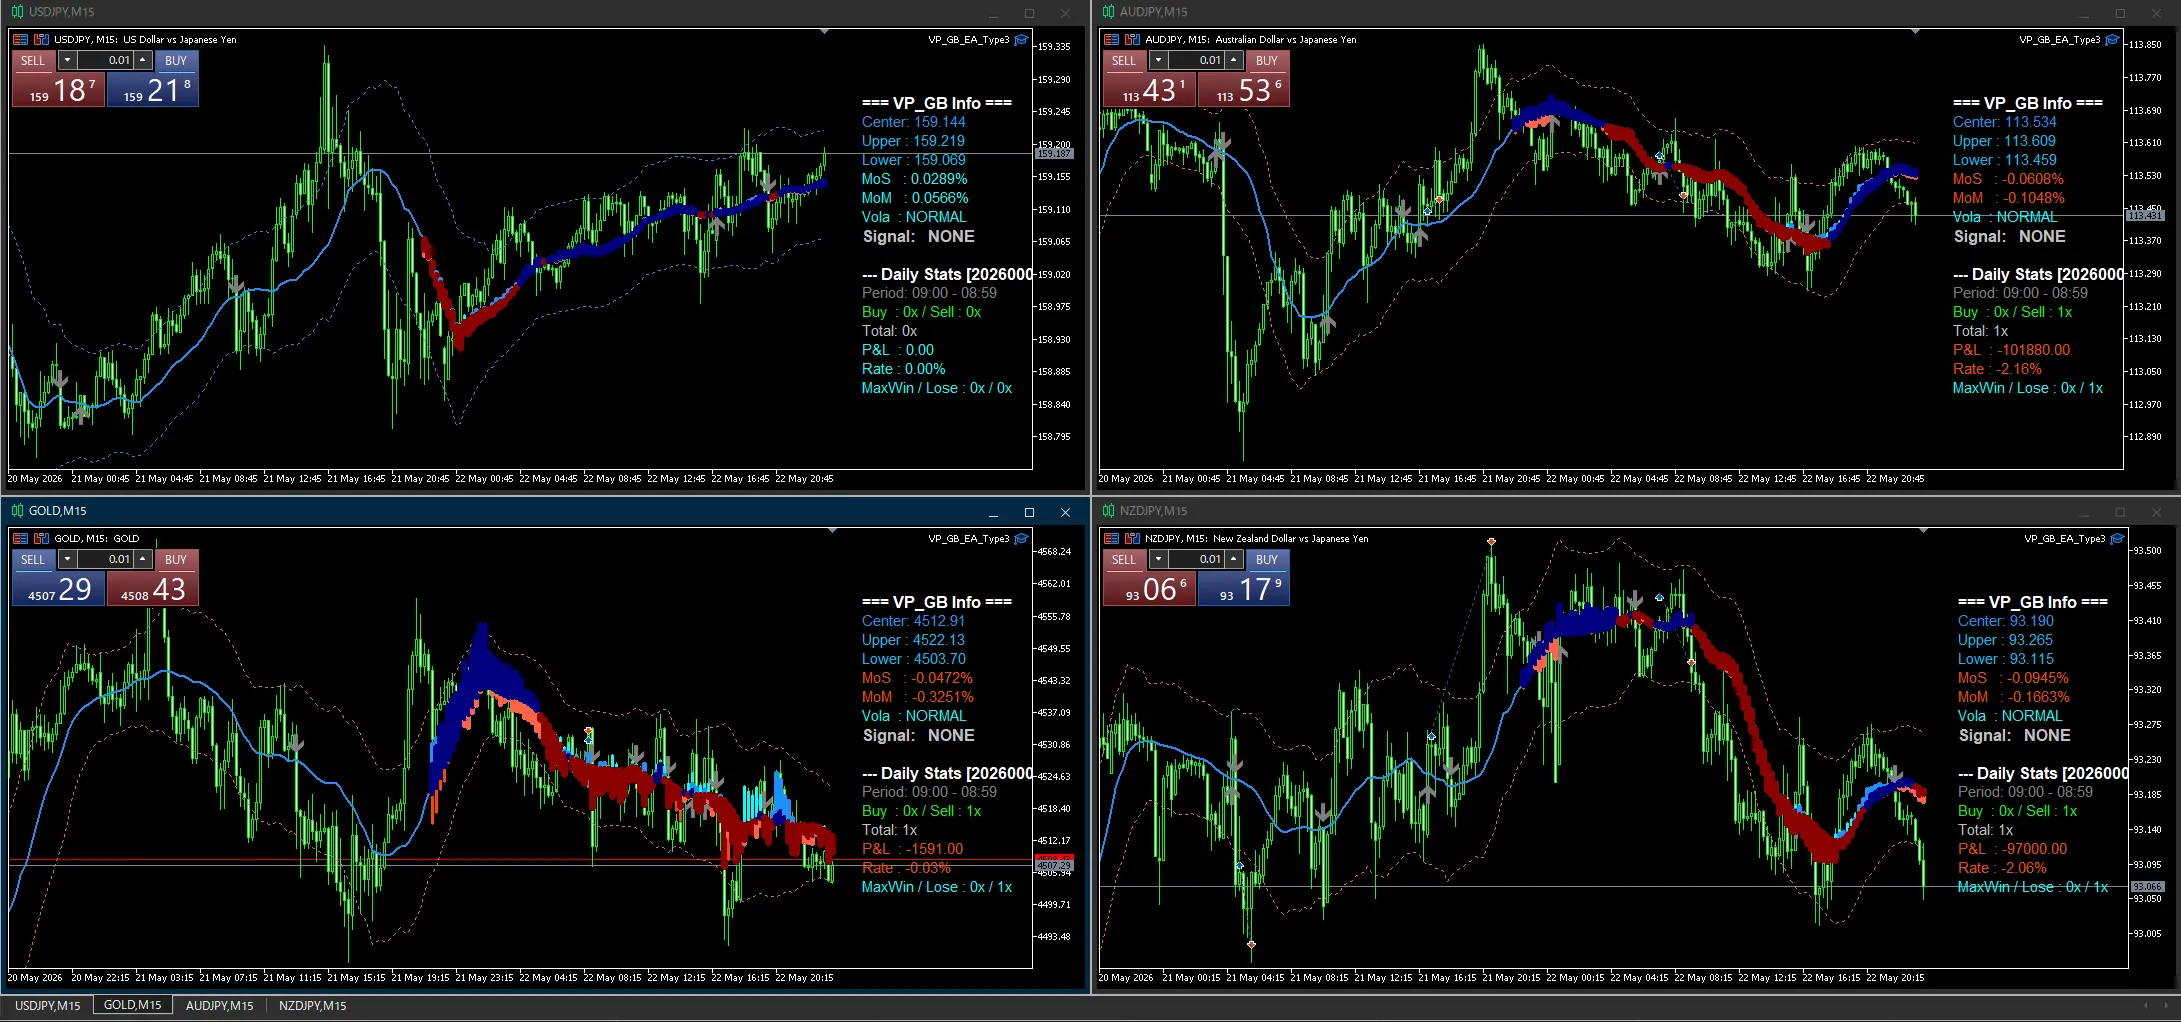
■ This Week’s Market Overview
Overall, the trend of “yen strength continuing” stood out, but movements varied by instrument. USDJPY showed volatile price action from a rise to a sharp drop and rebound, while AUDJPY, NZDJPY, and GOLD continued a downward trend while maintaining the red Gravity Band. In all instruments, signals are NONE as we await the next signal.
■ VP_GB’s Points for This Week
The chart to watch this week is the **“trend reversal signal.”**
The Gravity Band on VP_GB (band color) displays in real time blue = up, red = down, gray = low volatility. This week USDJPY transitioned from a blue band to a red band, and is moving back toward a blue band, indicating a potential trend reversal. The moment the band color changes serves as a sign of a trend change and is an important factor when looking for the next entry point.
Meanwhile, AUDJPY, NZDJPY, and GOLD continue to show red bands, indicating the downward trend has not broken. At present, all instruments show Signal: NONE, so it’s important to wait calmly for the signal to appear.
■ Instrument Trends
USDJPY (Top Left)Center: 159.144 / MoS: +0.0289% / MoM: +0.0566% Short-term and mid-term momentum are both positive, returning to an upward trend. No entry today (Buy 0, Sell 0). This is a rebound after a plunge, and we are waiting for a Buy signal when the Gravity Band turns blue.
AUDJPY (Top Right)Center: 113.534 / MoS: -0.0608% / MoM: -0.1048% The red band continues, confirming a clear downward trend. Sell 1 entry resulted in -101,880 yen and -2.16% loss. Looking at the chart, there was a sharp drop followed by a sharp rebound, which may have triggered the stop loss. Momentum remains negative, so the direction remains downward.
GOLD (Bottom Left)Center: 4512.91 / MoS: -0.0472% / MoM: -0.3251% Mid-term momentum remains under strong downward pressure at -0.3251%. Sell 1 entry resulted in -1,591 yen and -0.03% loss. The chart shows continued movement near a bottom after the decline, so it is prudent to wait until the next directional signal emerges.
NZDJPY (Bottom Right)Center: 93.190 / MoS: -0.0945% / MoM: -0.1663% Momentum is the strongest negative among the four instruments. The red band indicates a clear downward trend. Sell 1 entry resulted in -97,000 yen and -2.06% loss. Similar to AUDJPY, the stop loss was triggered after the rebound following the fall. The downward trend remains, so we will continue to watch for Sell signals at the next pullback.
■ Key Points for the Near Future
・USDJPY momentum turning positive. GB band fully blue; monitor for a strong signal. ・Be cautious of a rebound after sharp declines for AUDJPY and NZDJPY. Target Sell signals after the rebound stabilizes. ・GOLD continues to move in the bottom range; assess timing for volatility expansion.
■ Summary
This week, abrupt rebounds caused stop-loss hits on AUDJPY and NZDJPY. In such rapid-movements scenarios, VP_GB’s overheat bar filter functions effectively, allowing entries on the bars that surged or plunged to be automatically skipped to avoid unnecessary losses.
Continuing to wait calmly until signals appear is important. Combine the Gravity Band colors with the Momentum Pyramid direction to identify the next entry opportunity!
★VolatilityPulse × GravityBand Now Available!!
Free Version URL:https://www.gogojungle.co.jp/tools/indicators/78008
Pro Version URL:https://www.gogojungle.co.jp/tools/indicators/79785?via=users