

[1-minute chart] Let's view Bitcoin price on a 1-minute chart (average line)! The market is showing a recovery trend, but...
Hello everyone, 1-minute chart! Eye dryness is tough@xi10jun1it's.
In this season the eyes truly dry out, doesn’t it? I must be careful not to stare at the trading screen too long…
Last time I wrote about the 5-minute chart, but this time it's about the 1-minute chart!
This Week's Performance (January 27, 2017 to February 2, 2017)
First as usual, the performance. I will announce the changes first.
- Last week (until January 27, 2017) assets: 60,861 yen
- This week (until February 2, 2017) assets: 61,414 yen
- Change: +553 yen
Finally the assets are in the 61,000-yen range! It looks like they are increasing smoothly, but this week there were many stop-outs that briefly dropped below 60,000 yen… However right after that there were roughly the same gains, hence this result.
The asset volatility is quite intense….
In any case, the key is “investing without losing.” That is the one and only approach! I will continue to keep this in mind!
Let’s look at the 1-minute chart!
So, this week I will study the 1-minute chart.
I took various screenshots this week, and there was a chart that was very easy to understand, so I will look at that one.
It remains a chart with Heikin-Ashi candles.
January 31, 2017 1-minute chart: 1
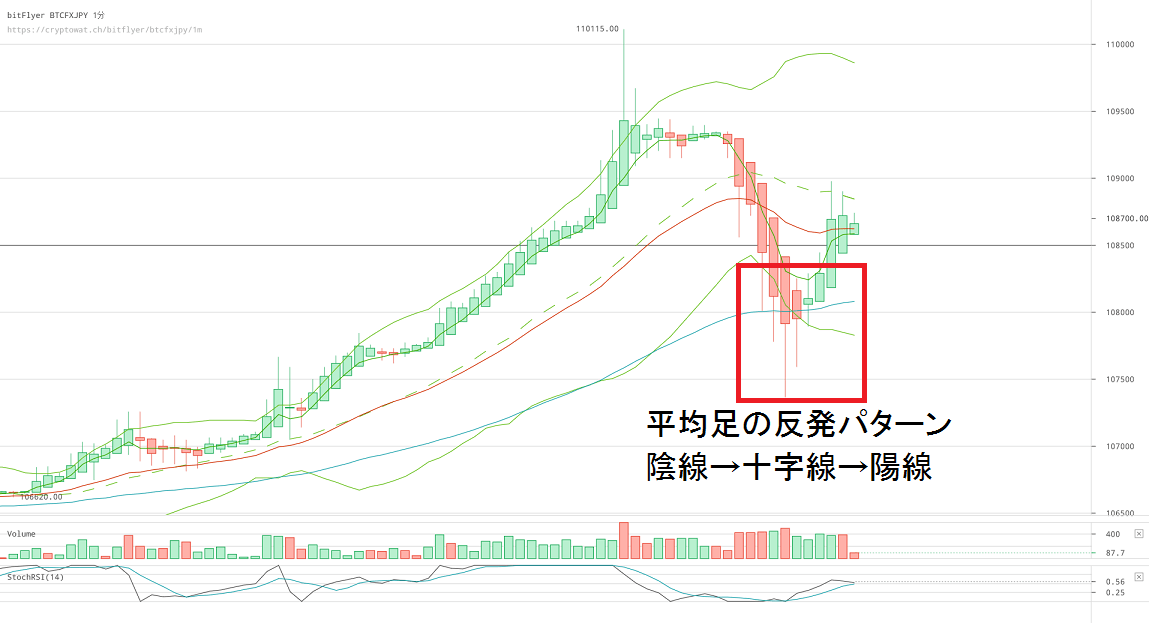
What I will use this time is the 1-minute chart from January 31, 2017. The characteristic price movement of Heikin-Ashi will continue afterward, so let’s view it in the flow.
First, this image. It is the typical bounce pattern of Heikin-Ashi that I described in the previous column.
Let’s also look at the image introduced previously.
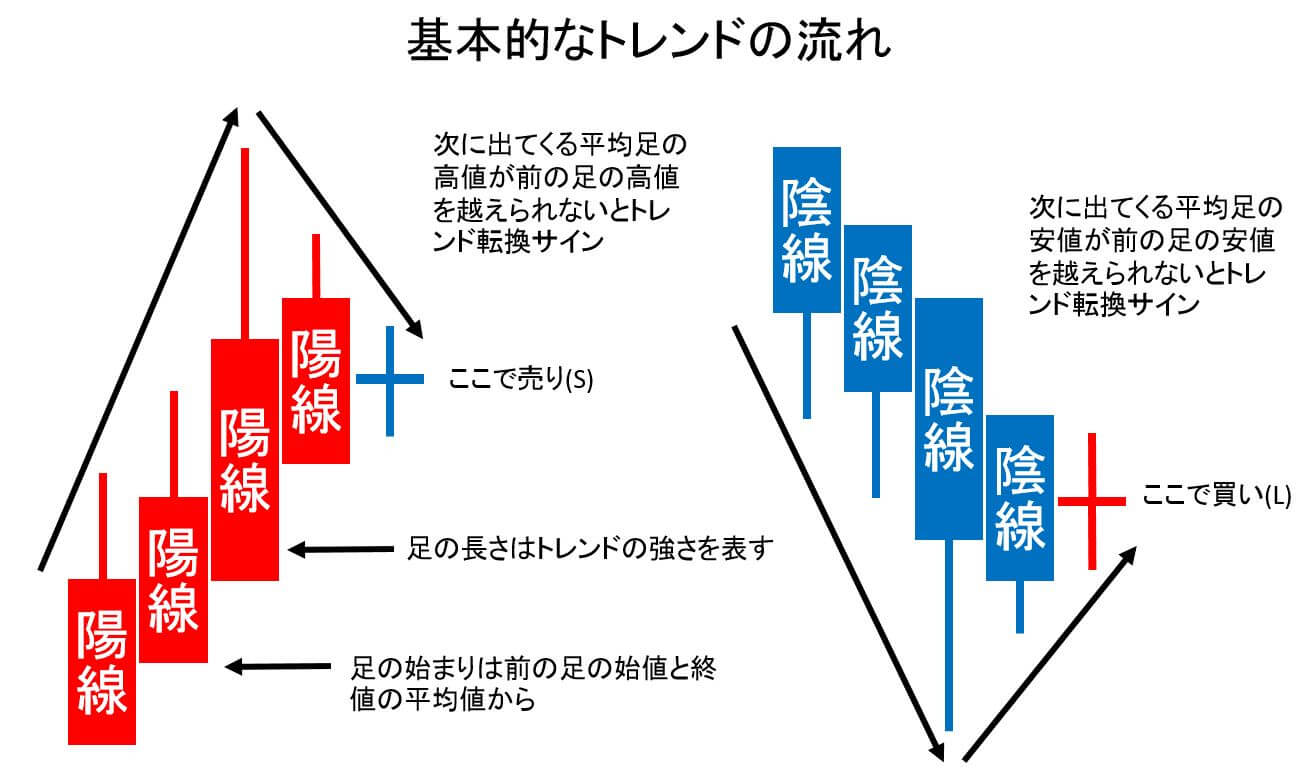
When a trend reverses on Heikin-Ashi, the candle lengths gradually shorten and form a doji, followed by a new candle in the opposite direction. This time a sharp uptrend occurred a little earlier, so the reversal is happening after that pullback.
From here it is a bit unlikely to rise straight up again, but we will keep watching…
January 31, 2017 1-minute chart: 2
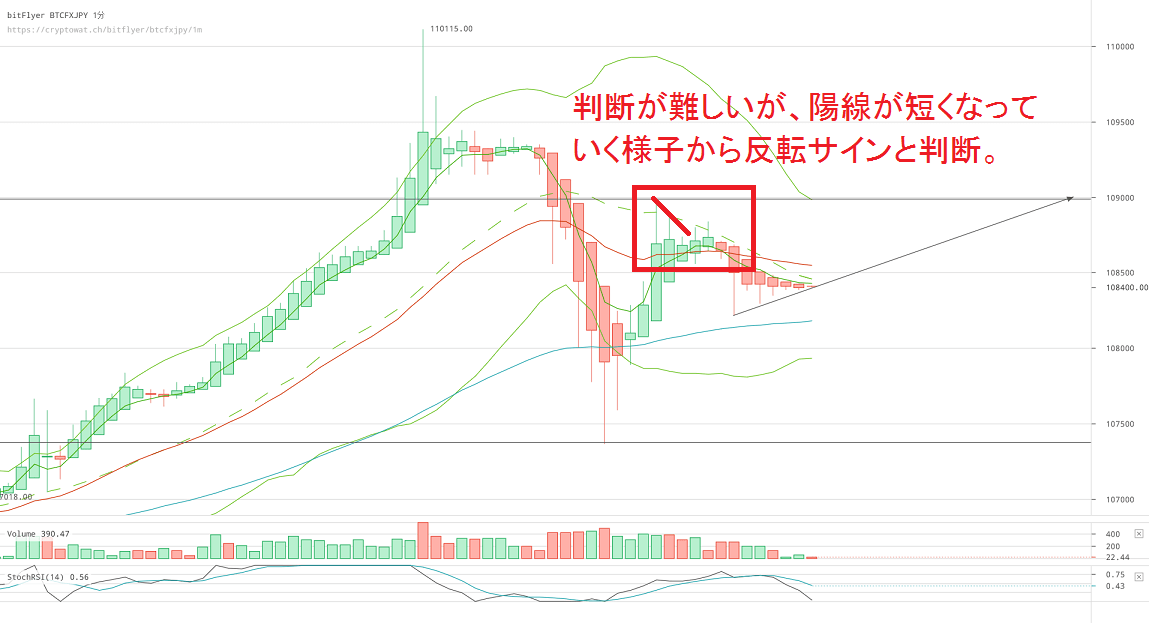
Afterwards the bullish candles shortened, and a bearish candle appeared.
As shown by the red frame’s red line, the candle lengths clearly shortened, but two unusual bullish candles appeared afterward. Judgment here is quite difficult. It can jump up suddenly from here.
However, seeing a bearish candle afterward, it is a situation where trying a small short on a test-run could be interesting.
January 31, 2017 1-minute chart: 3
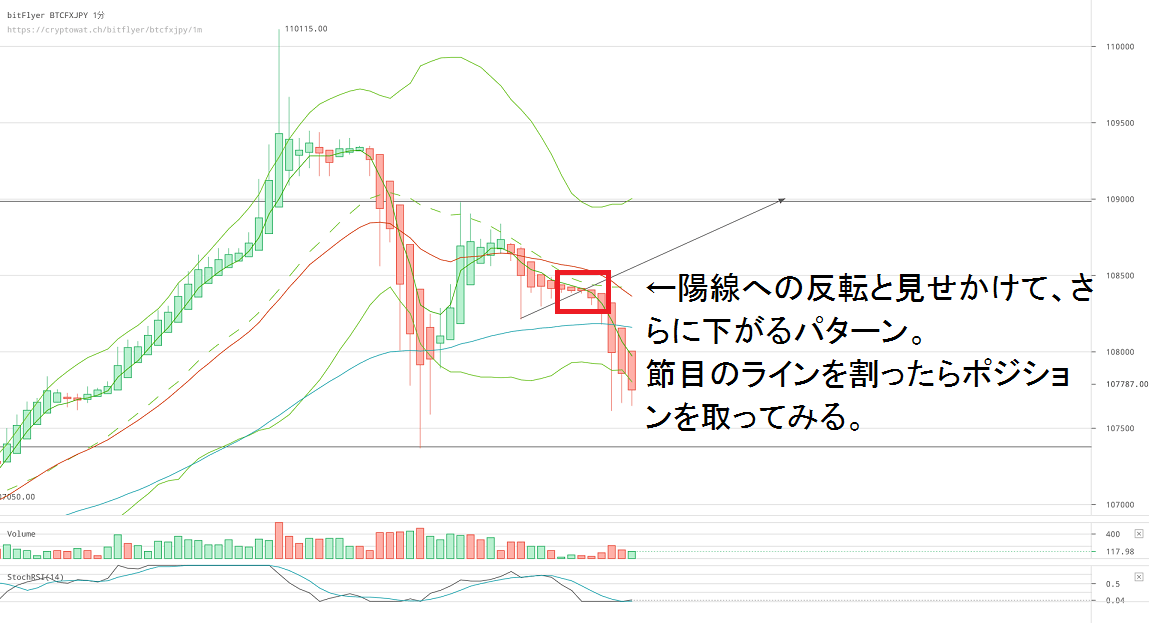
Now it has appeared. This is another common Heikin-Ashi pattern: “looks like a reversal but continues to move in the same direction” or “continues to fall.”
In this image, it’s the pattern of “looks like a reversal but continues to fall.” In such cases, it’s hard to tell whether it will further drop or rebound strongly, so there’s no need to force a position.
Be mindful of key support and resistance levels.
January 31, 2017 1-minute chart: 4
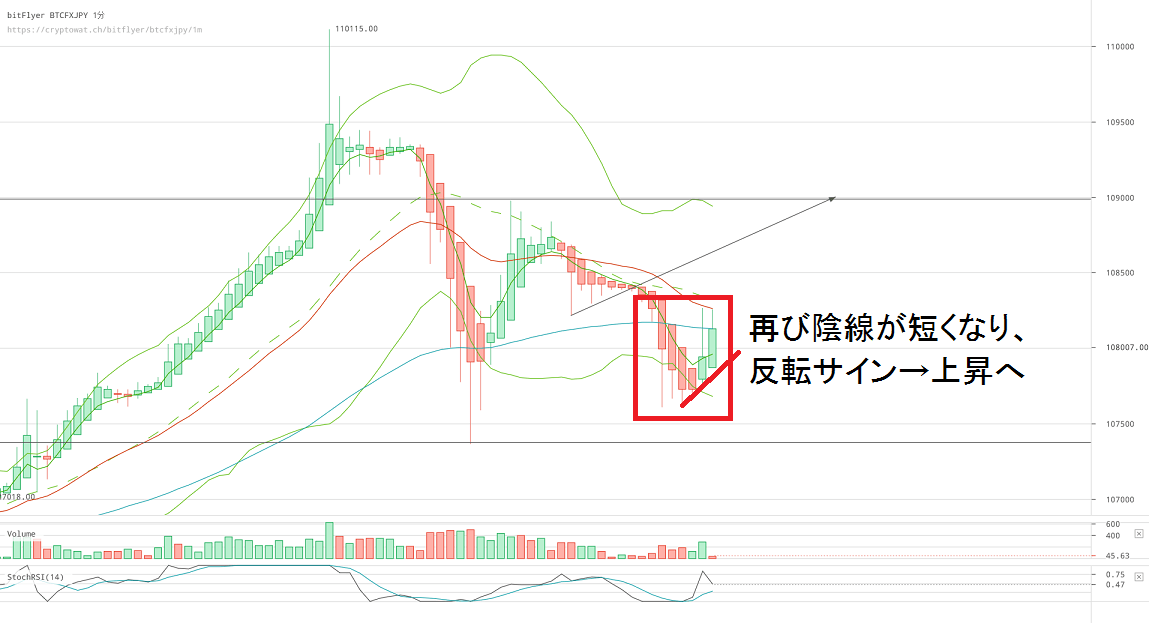
Will the candles shorten again and reverse upward?
In the 1-minute chart, this kind of repetition happens, so pay attention to which key level it crosses.
January 31, 2017 1-minute chart: 5
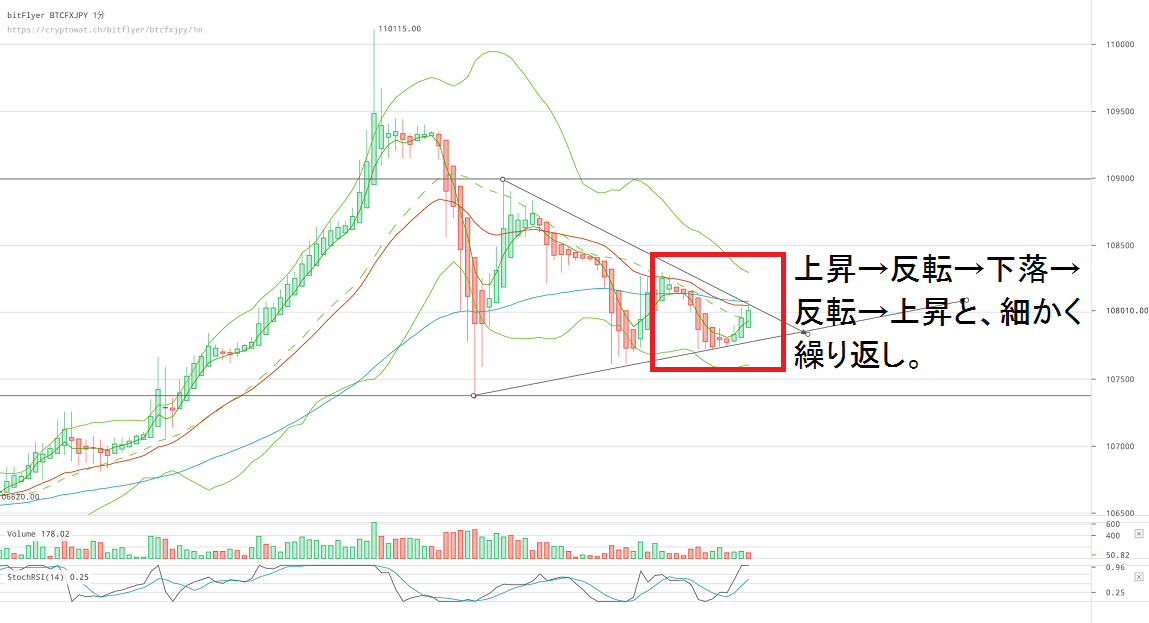
Afterwards it continues to rise → reverse → fall → reverse → rise, with the price gradually declining.
From here, draw lines at key points to form a triangle, and observe how the price moves from there.
If the price breaks above the triangle, it indicates an uptrend; if it breaks below, a downtrend.
January 31, 2017 1-minute chart: 6
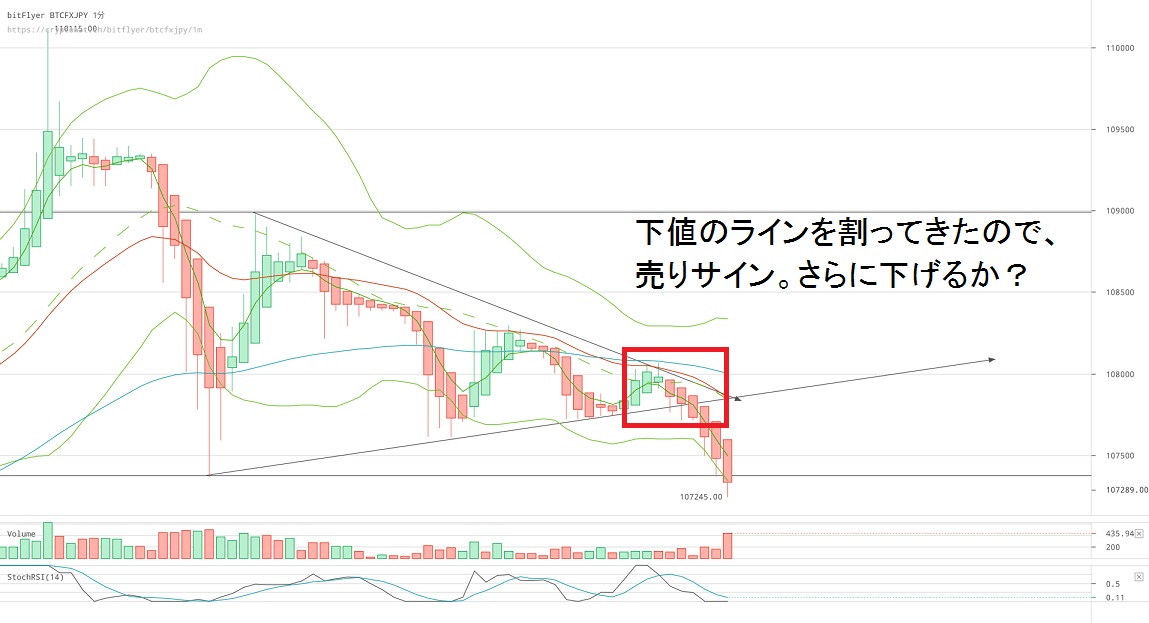
And what happened? It broke below the triangle, signaling a downtrend.
From the recent lows, it seems to be a fairly strong sell-off.
Will this continue or…?
January 31, 2017 1-minute chart: 7
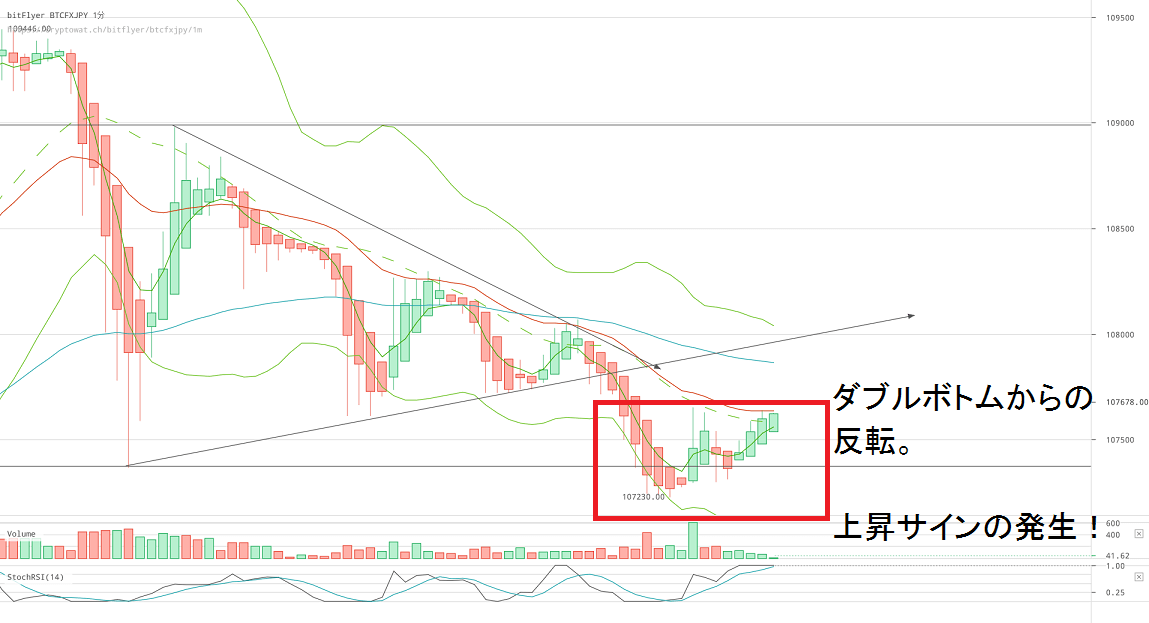
The selling did not continue; instead, a double-bottom formed a bullish signal.
In such shapes, rebounds are easily expected.
If you find it, you might want to place a position as a test.
January 31, 2017 1-minute chart: 8
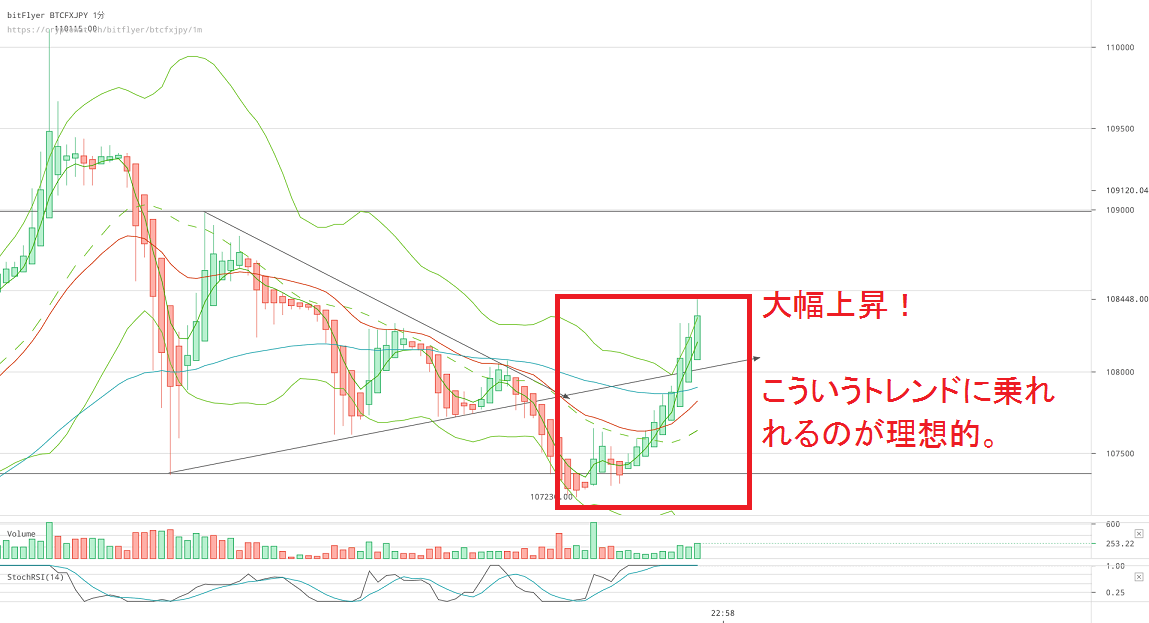
And again an uptrend begins! This time it’s strong!
As shown in the image, riding such a trend is ideal.
Even if you can’t catch the bottom, there are opportunities along the way.
Free takeaway: For 1-minute charts, settle quickly.
We looked at the 1-minute chart this time, but trends can change in just a few minutes.
So when trading on a 1-minute chart, you should settle in about 1–5 minutes. The faster you judge, the less profit, but also the quicker you can cut losses, which is a feature of 1-minute trading.
Of course, for a full picture you should also look at larger timeframes like 5-minute, 15-minute, 30-minute, and 1-hour to grasp the overall trend. In the future I’d like to study trades that combine both large and small timeframes.
By the way, I will be staying in Tokyo for about 3 nights and 4 days next week, so there is a possibility I cannot update the column. I will be traveling by高速バス, so there may be accidents. Please understand in advance.
Endnote: Shopping with Bitcoin!
Actually, the overseas e-commerce site "FANCY" allows you to purchase goods using Bitcoin. It may cost a bit for shipping, but there are stylish items you won’t see in Japan!
I have summarized how to use FANCY on this blog, so please refer to it.
- →FANCY (Fancy) account creation, registration, settings, and the flow of product purchases explained! | Investor Jun of the Yutorisei generationFANCY (Fancy) account creation, registration, settings, and the flow of product purchases explained! | Investor Jun of the Yutorisei generation
- →How to purchase (pay with) Bitcoin for FANCY items | Investor Jun of the Yutorisei generationHow to purchase (pay with) Bitcoin for FANCY items | Investor Jun of the Yutorisei generation
Note: The free content ends here. The following is detailed analysis and future outlook, so it will be paid content. If you are interested, please subscribe!