

【5/22】"In calmer markets, the basis is questioned."
When you have no sense of direction, you tend to squeeze in anyway—I used to do the same in such markets and ended up losing due to baseless entries.
Today I will make it a day not to follow that pattern.
This article will cover two points: why today we are staying out, and which lines we should still be mindful of.
Today's Market Situation
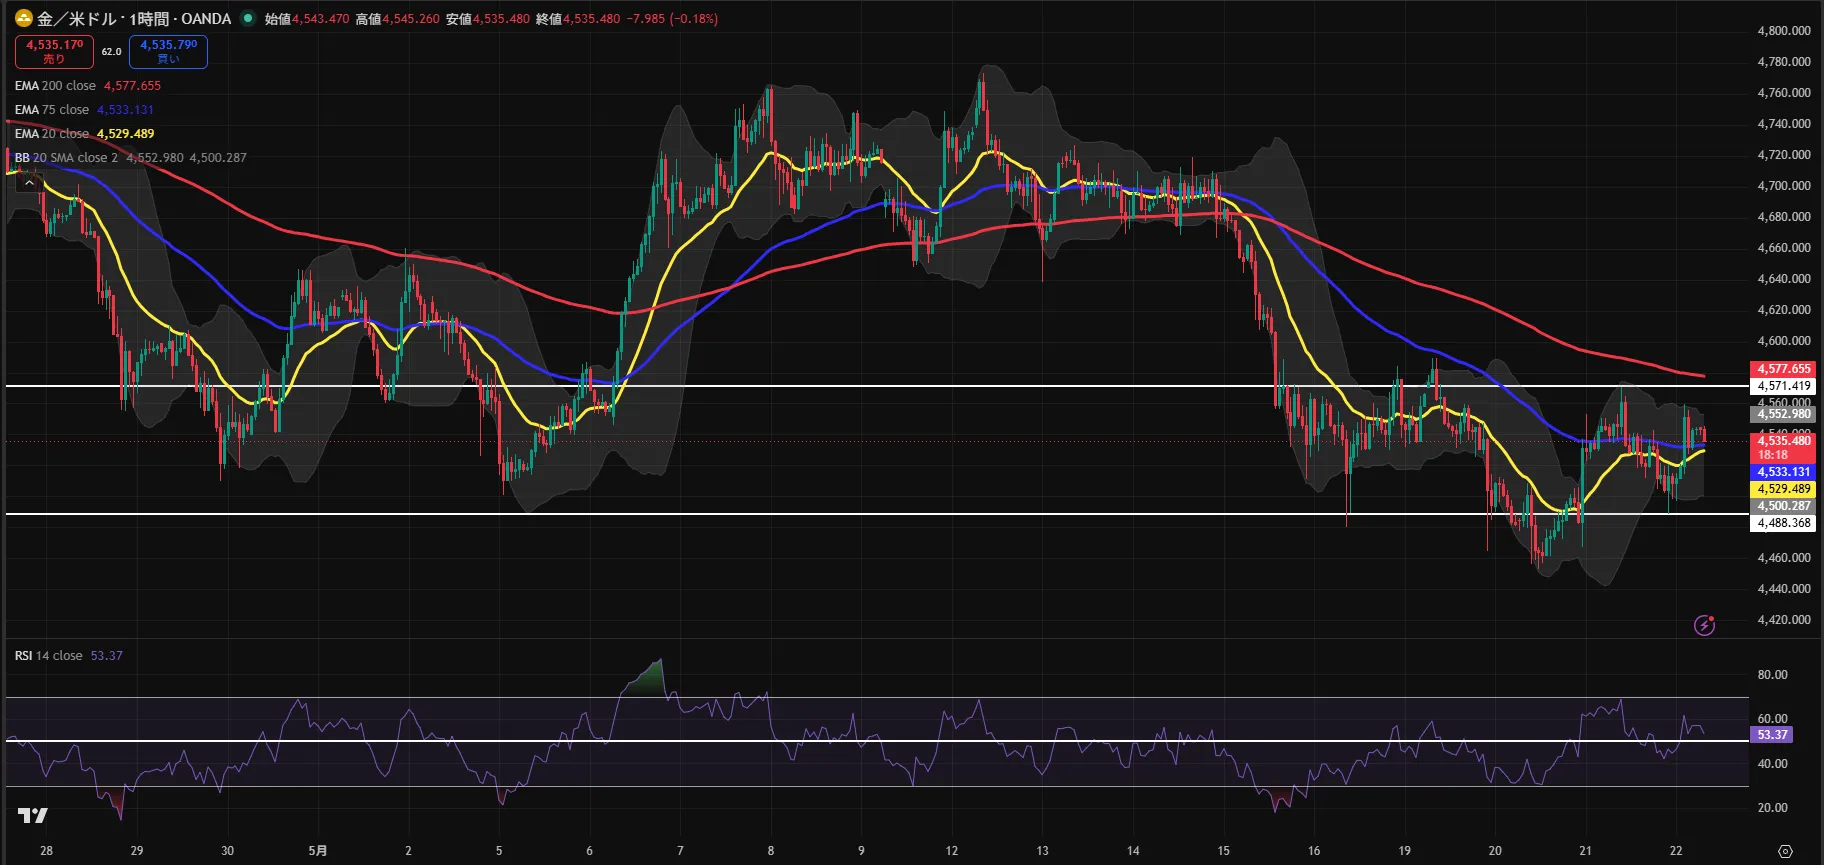
The current GOLD price is hovering around $4,536.
Looking at the 1-hour EMA (exponential moving average), the short-term EMA20 (4529) is below the mid-term EMA75 (4533), forming a downtrend. However, the RSI (indicating overbought/oversold) is 53.37, which is above 50, and does not align with the downward direction indicated by the EMA.
On the 4-hour chart, the EMA is also in a downtrend, and RSI is in the 47 area, neutral to slightly weak. The direction is not clear.
On the 15-minute chart, the EMA appears to be in an uptrend with short-term 20(4538)>mid-term 75(4529)>long-term 200(4526), but the higher timeframes do not align with this direction.
In short, signals from higher and lower timeframes contradict each other, so today there is no clear direction in this market.
GoGo Taro’s Perspective
This article is personal analysis and is not a recommendation or solicitation for investment. Please make trading decisions at your own responsibility.
Today, my view is to stay out.
If the price retraces toward the previous day high (around $4,571) and there is a clear sign of stall/turn at that level, I think a retracement sell could be considered. On the other hand, if it clearly breaks above around $4,553 (Bolinger Band upper bound), there is a possibility of briefly testing $4,571.
However, at this moment the EMA arrangement and RSI do not agree on a direction, so rather than rushing into a trade, waiting for the next opportunity is more rational for me.
Today's Reference Lines
Today there is no clear point that satisfies RR1.5, so no entry. The following are only for reference.
▼ Short (retracement sell) reference
Reference zone: $4,566〜$4,576 (basis: previous day high $4,571.419 ± $5)
Reference take-profit line: $4,490
Reference stop-loss line: $4,600 (basis: $20 above the 1H EMA200; rounding up the key level)
Expected RR: 2.7
※These are educational reference values. Please make actual trading decisions yourself.
We will omit break-out selling since the target take-profit cannot be calculated from the input numbers.
Important Lines
Resistance 1: $4,570 (basis: previous day high)
Support 1: $4,530 (basis: 1H EMA75)
Support 2: $4,530 (basis: 1H EMA20)
Support 3: $4,490 (basis: previous day low)
1H EMA200: $4,578 (watch line)
※ One resistance line + three supports + EMA200 alone, total four lines (excluding EMA200)
A Word for Today
“Those who stay out on days of hesitation can move when the time comes to win.”
This article is personal analysis and is not a recommendation or solicitation for investment. Please make trading decisions at your own responsibility.
If you found it helpful, a follow would be encouranging.
Feel free to leave questions or impressions in the comments.