

[May 21] "Only the day without hesitation is the real move."
EMA is showing a decline. However, RSI is above 60.
If it were me in the past, I would have entered with the emotion, thinking "it looks strong, so let's buy."
Today’s market is exactly that pattern.
In this article, I will整理 each reason why today is a wait-and-see moment.
This article is personal analysis and does not constitute investment recommendations or solicitations. Please make buy/sell decisions at your own risk.
Today’s Market Situation
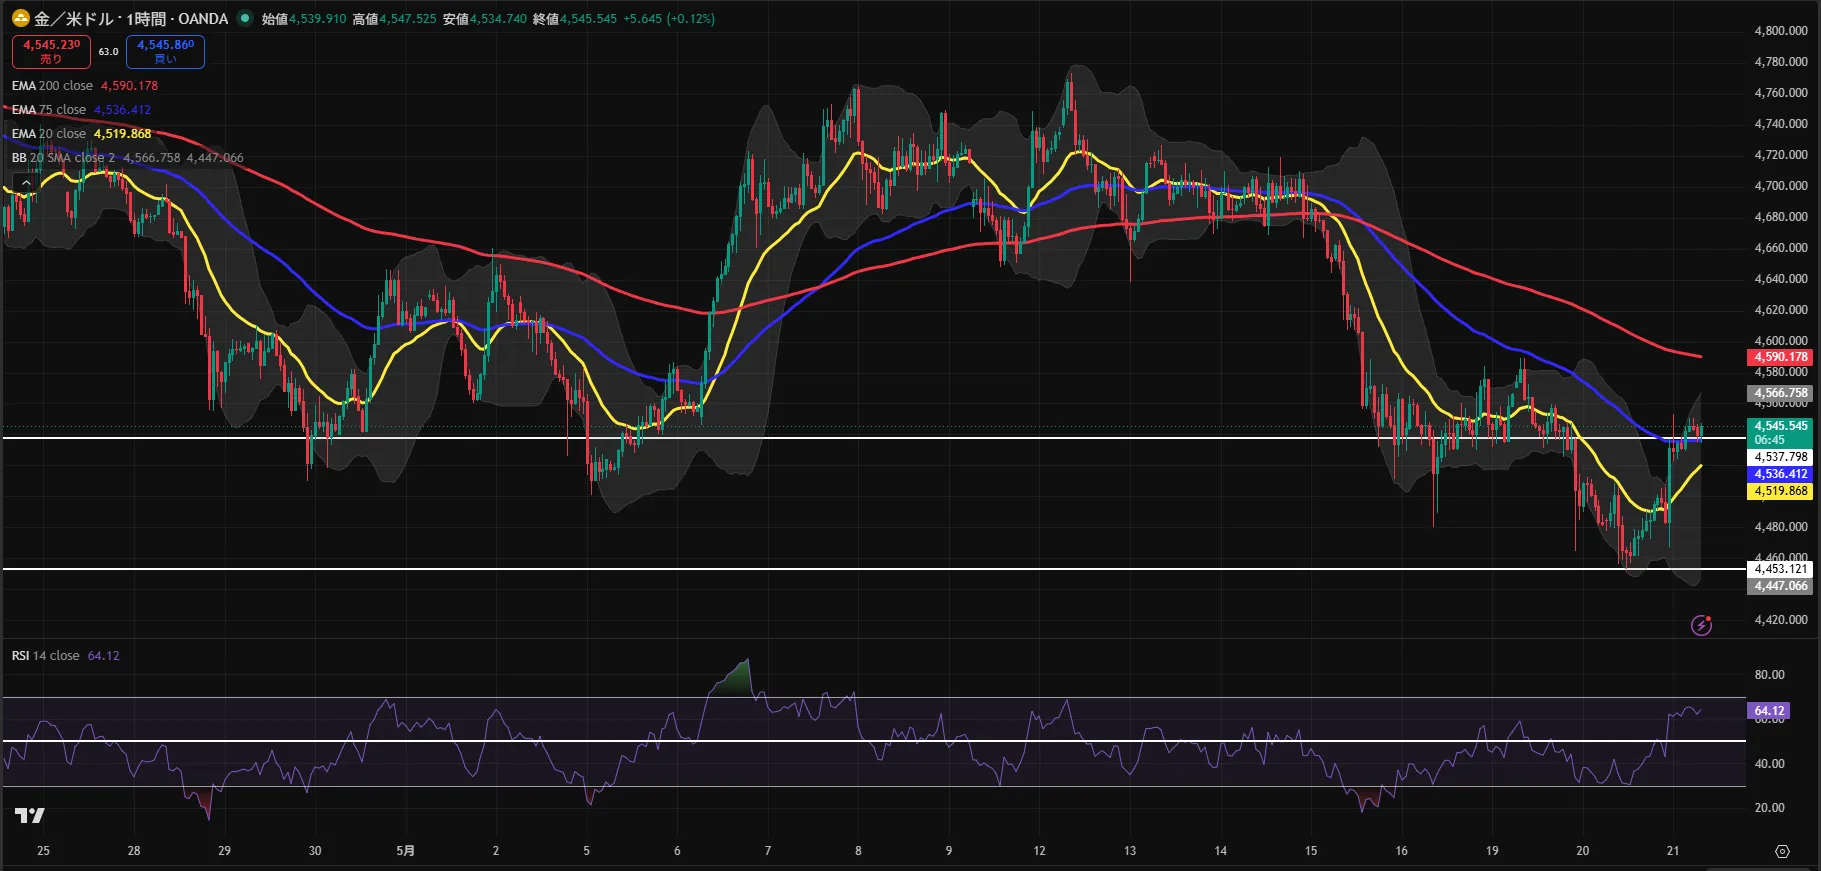
The current price is hovering around $4,544.
In the 1-hour timeframe, EMA20 (short-term moving average) is $4,519, EMA75 is $4,536, and EMA200 (long-term moving average) is $4,590. The downtrend remains with EMA20 below both EMA75 and EMA200, indicating ongoing medium-term selling pressure.
On the other hand, RSI (an indicator showing overbought/oversold) is currently 64.12, well above 50, suggesting renewed buying momentum from the recent rebound.
In short, it’s a contradictory situation where “EMA indicates a downtrend while RSI shows upward momentum.” It is not clear which force will prevail at this moment.
Gogo Taro’s View
This article is personal analysis and does not constitute investment recommendations or solicitations. Please make buy/sell decisions at your own risk.
If there is a clear breakout above $4,590 (1H EMA200), there could be a short-term bullish shift. However, since the 4-hour EMA sequence (20 < 75 < 200) remains in a downtrend, even a breakout above may not immediately indicate a bullish reversal.
If the current price falls again to around $4,520 (1H EMA20), selling pressure would strengthen again, maintaining a bearish outlook.
What I feel today is the sense that on days when you can’t say one way or another, you shouldn’t force an action. When EMA and RSI say opposite things, entries are weakly justified.
Today’s Reference Lines
There is no point meeting RR1.5 today, so I’ll refrain from entering. The following is for reference only.
The current price is at a timing where it would need to break above the major EMA lines (about $4,519–$4,537) in one thrust, which overlaps with the pullback selling zone and the current price. Also, even if considering a breakout trade, the distance to take-profit is too short to ensure RR1.5, so there is no reference entry today.
Key Levels
Resistance: No major lines above the current price can be confirmed at this time.
Support ①: $4,537 (Reason: previous day’s high; breached)
Support ②: $4,535 (Reason: 1H EMA75)
Support ③: $4,520 (Reason: 1H EMA20)
Support ④: $4,455 (Reason: previous day’s low)
1H EMA200: $4,590 (whether this line can be surpassed is the key to accelerating the rise)
Today’s Word
“There is more to learn from days you held off than from days you entered while uncertain.”
This article is personal analysis and does not constitute investment recommendations or solicitations. Please make buy/sell decisions at your own risk.
If you found this helpful, a follow would be appreciated.
Feel free to leave questions or impressions in the comments.