

Gold counter-trend method, I was astonished to see a win rate of 64.7% when made by AI
As someone selling the "Pro Level FX Signals Tool Mass Production AI System," there has been a project I’ve always wanted to do.
This is about letting AI take over the method and turning it into a working indicator.
I will deliver one per week, in a two-article structure: development and presentation.The finished indicators will be distributed for free.
This week’s topic is gold mean-reversion scalp trading.
Gold often shows a one-way move during London to New York hours and then briefly retraces. False breakouts where highs or lows are briefly surpassed and then returned to are common.
In other words, for gold scalping, rather than jumping on a breakout, it might be more interesting to “go for the retracement after it has stretched”—that’s the hypothesis this time.
Idea behind the method
The logic is simple.
“Buy when the price has fallen far below the moving average and then starts to rebound with a bullish candlestick.”
“Sell when the price has risen far above the moving average and then starts to be pushed back by a bearish candlestick.”
A classic combination of moving-average deviation and candlestick reversal.
However, gold’s volatility varies greatly day to day, so fixed values like “deviated by XX points from the moving average” won’t work. So we will judge it by “how many times the recent volatility fits into a given deviation.” With this, the degree of overextension can be measured with a consistent standard regardless of market conditions.
Profit-taking and stop-loss are also automatically set according to the current volatility. A green check for take profit, a red cross for stop loss drawn on the chart.
That’s all.
Having AI draft the specification
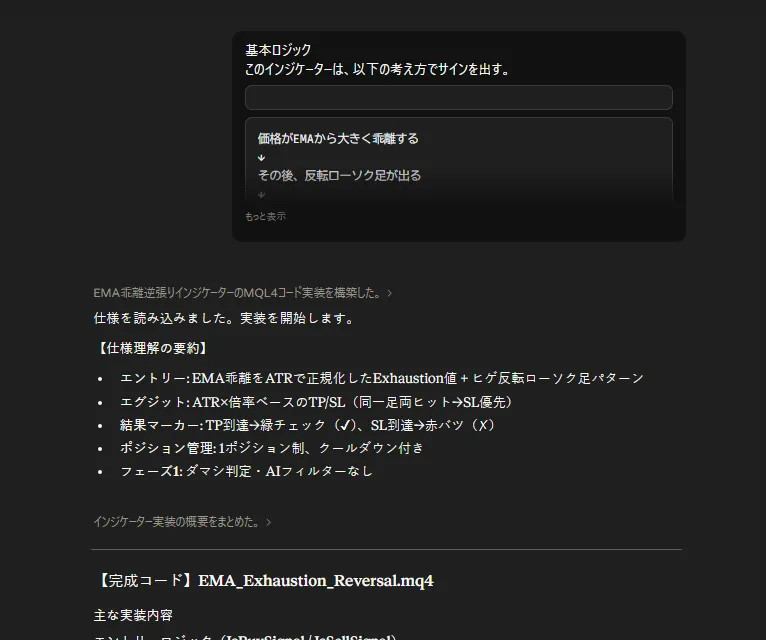
With a rough plan in place, I fed it to AI like this.
“I want to build a gold mean-reversion scalp indicator. Create the minimum viable specification using the moving-average deviation plus candlestick reversal logic.”
The specification that came back was incredibly long.
“Lower-interval oscillator display,” “higher-timeframe trend filter,” “volume filter,” “learning-driven loss-avoidance,” “averaging management feature,” “win-rate panel”…
...Too many.
If I built all of that at once, it would surely have bugs. So I asked again.
“Phase 1 is fine. No panel, and the logic a bit simpler.”
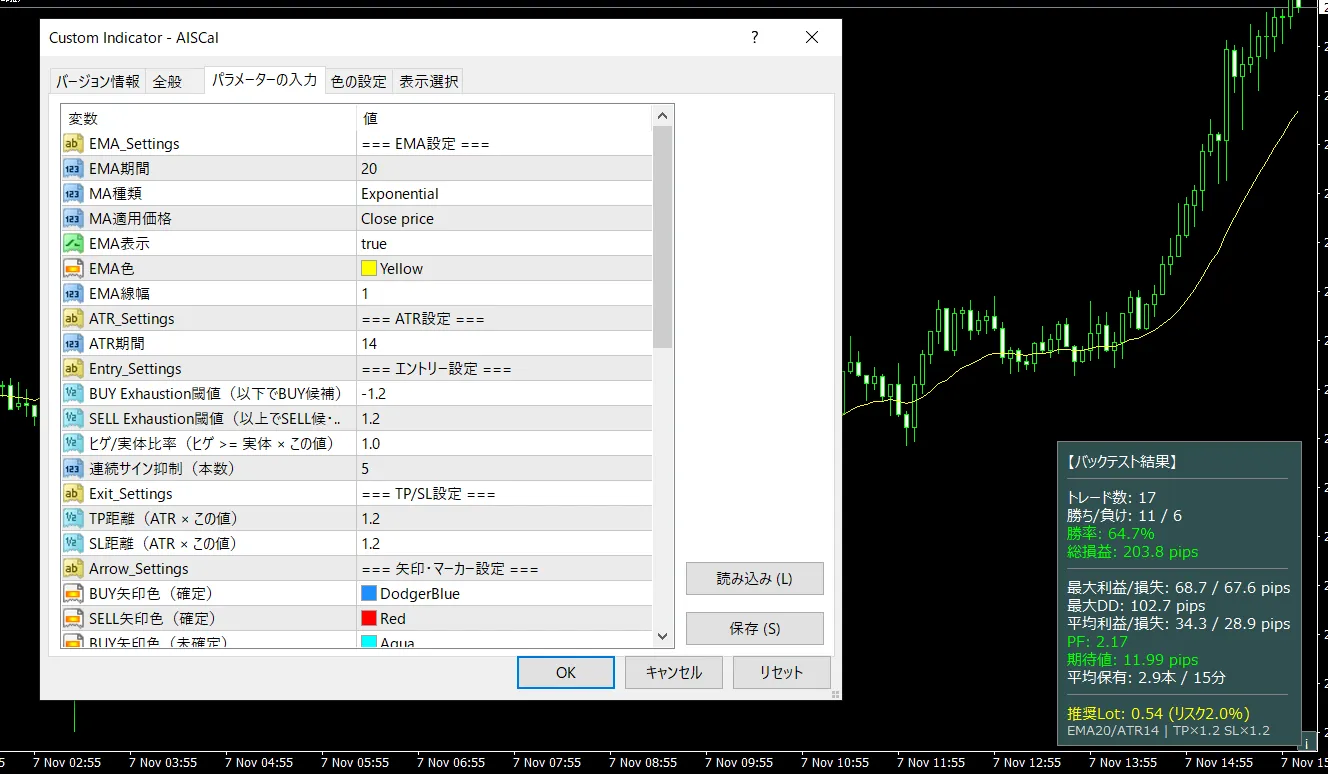
This shaved off a lot. The final remainder was just: moving-average deviation check, candlestick reversal check, volatility-based TP/SL, and result markers drawn.
Having AI produce the code by delegating entirely
Now that the spec is ready, I feed it to AI as-is. The instruction is simple.
“Please create code that runs on MT4 exactly according to this specification.”
…and after waiting a few tens of seconds.
It came out normally. Even better, it included a backtest statistics panel (win rate, PF, expected value, max drawdown) that I didn’t even ask for. Very thoughtful.
When I first saw it, I honestly felt a bit moved saying, “Wow, something that runs in one go.”
I dropped it into the MT4 indicators folder and compiled it.
…No errors. It compiled on the first try.
What? The result was better than expected
Now we get to the main point.
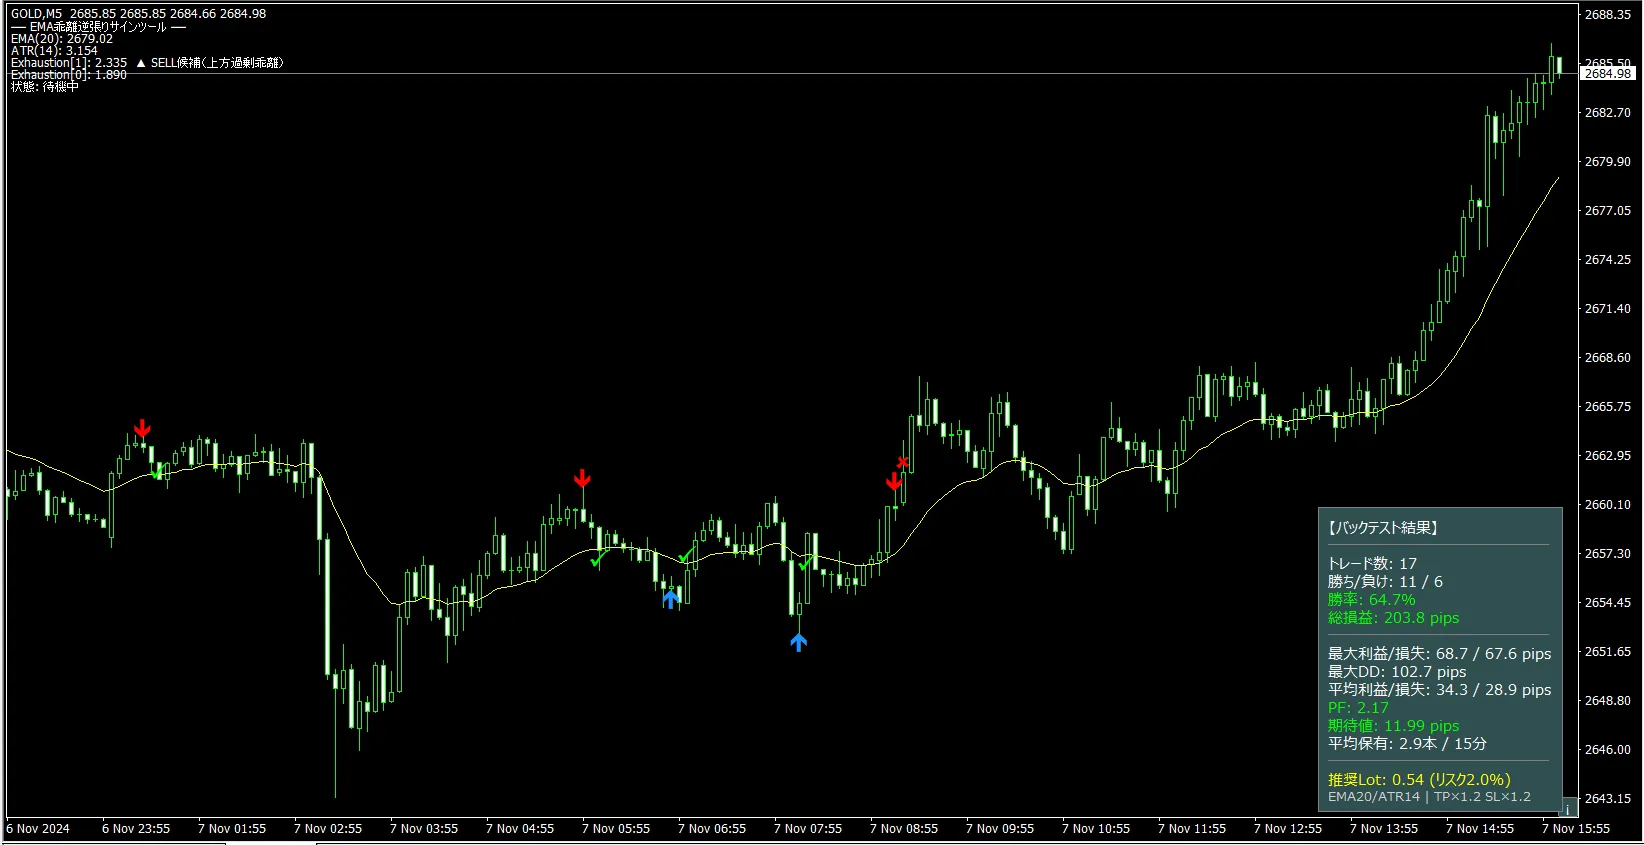
On the gold M5 chart, over the most recent 500 bars (roughly two days), I checked the AI-generated statistics panel to see how it performed.
Trades: 17
Wins/Losses: 11 / 6
Win rate: 64.7%
Net P/L: +203.8 pips
Max profit / max loss: 68.7 / 67.6 pips
Max DD: 102.7 pips
Average win / loss: 34.3 / 28.9 pips
PF: 2.17
Expected value: 11.99 pips
Average holding: 2.9 bars / 15 minutes
...Huh, that’s pretty good?
Win rate 64.7%, PF 2.17, +203.8 pips. Even though it’s only two days and 17 trades, these numbers aren’t bad.
In particular, PF 2.17 is quietly impressive, a level that would sustain a scalping indicator in a normal setting.
Honestly, I didn’t expect it to perform this well with such a minimal setup.
Why the results were so good
Let’s look at the chart and think about it.
The tested period happened to be a range-bound phase for gold. Mean-reversion indicators tend to perform very well in range markets, so it’s quite possible this period played to its strengths.
In fact, in the latter part there was a strong upward trend, and in that phase there were three consecutive red crosses (stop-loss).
That’s the typical weakness of mean-reversion: you get hit as soon as a trend starts. In the next phase, adding an “upper-timeframe trend filter” seems necessary to suspend mean-reversion during strong trends.
Still, at this minimal stage, being able to clearly outline the issues is a big success. It clarified what to add next.
What I learned
1: If you let AI handle it, a signal tool can be built in just a few hours. From specification to code generation to validation, all practical work takes only a few hours. A speed unimaginable a decade ago.
2: If you just crudely say “make it,” it won’t work well. The initial full-specification came back with about 20 items. Repeatedly cutting it down to a “minimal viable product” makes it possible to deliver in one go.
3: It’s faster to start with something that works and then identify issues, rather than aiming for perfection from the start. Building something minimal and feeling “this piece caused a snag” helps you know exactly what to add next.
Next issue teaser
In the next issue #1-2, we’ll distribute this finished indicator as a free gift.
I’ll provide a comprehensive MT4-ready file, setup explanations, and usage tips.
See you then.
By the way, the entire process of “making AI draft a signal tool” in this series is now fully templated for sale.
Pro Level FX Signal Tool Mass Production AI System
→ A complete package including the prompt to create specifications, the prompt to generate code, and a guide on fixing common bugs. This series will continually add the prompts I create.