

[May 19] "The day I let go of hesitation, the market came into view."
Looking at GOLD today, is there anyone who didn’t feel, “Isn’t this a chart that suggests selling?”
I feel the same way.
That’s why today I’ve neatly organized why it isn’t moving.
I’ll share the reasoning behind it.
Today's Market Situation
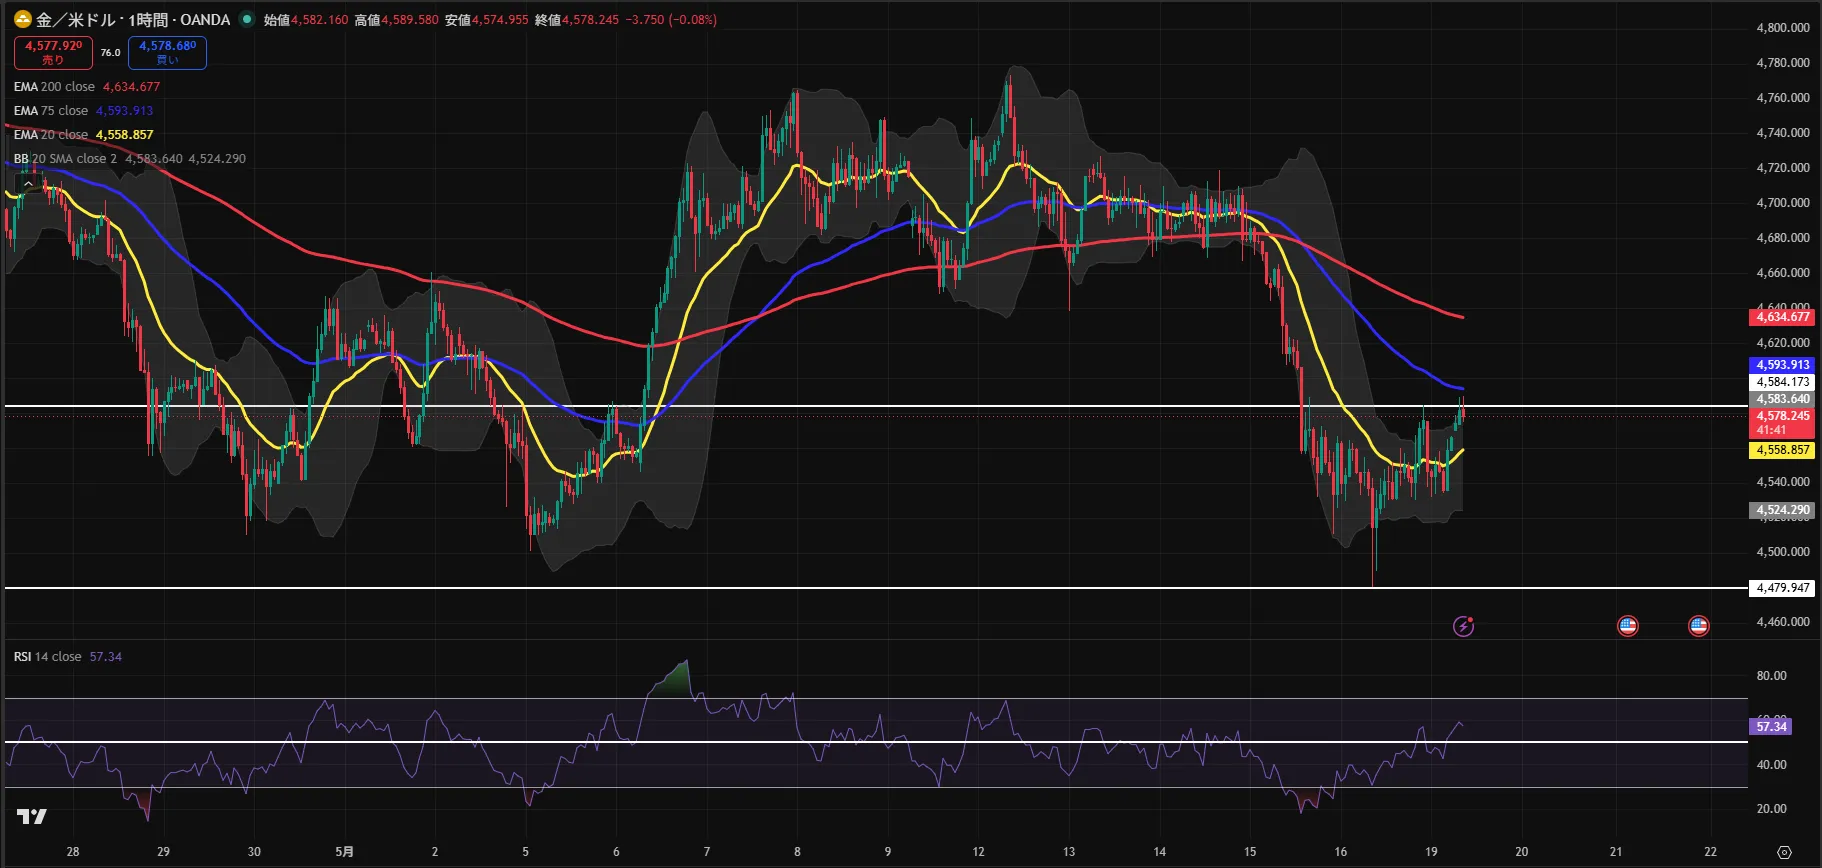
The current price is hovering around $4,579.
Looking at the 1-hour EMA (moving average), the short-term EMA20 (4,558), mid-term EMA75 (4,593), and long-term EMA200 (4,634) are arranged from top to bottom in descending order, a so-called down-trend configuration.
On the other hand, the RSI (an indicator of overbought/oversold) is currently at 57.34, a level above 50.
In short, EMA is signaling a “sell direction” while RSI indicates that the upward momentum still remains, creating conflicting signals at the same time.
When these two aren’t aligned, my rule is that I can’t commit to one direction.
Gogo Taro’s View
This article is personal analysis and does not constitute investment recommendations or solicitations. Please make trading decisions at your own risk.
Today’s scenarios are considered in two possibilities.
If the previous day’s high around $4,584 is clearly broken upward, I see a possibility that, while facing resistance between EMA75 ($4,593), the bias toward upside strengthens. RSI already above 50 and continuing to rise supports that scenario.
Conversely, if the current price approaches the previous day’s high without breaking it and stalls, I think the direction of the EMA arrangement will be reconsidered and the downside will gain the upper hand. Whether it breaks the EMA20 around 4,558 will be the confirmation point.
In the past, I used to rush to enter in such markets thinking I must pick a side. Each time I did, I repeated baseless stops. Now on days when the sense of direction isn’t aligned, I decide from the start: “not moving.”
Today’s Reference Lines
Today there is no point that meets RR1.5, so I’m staying out of entries. The following are for reference.
Because the lines that could justify stops are too close to the current price and entry zone, I could not confirm a level where risk-reward is satisfied.
Reference for pullback selling (RR not met, personal judgment)
Reference Zone: $4,589–$4,599 (basis: 1H EMA75)
Reference Take Profit Line: $4,480 (basis: previous day low)
Reference Stop-Loss Line: $4,605 (basis: previous day high + $20)
Expected RR: Reference value (not met, personal judgment)
※ Since the stop-loss width would be less than $20, I do not recommend entering.
Breakout Sell Reference (RR not met, personal judgment)
If a clear break below the previous day’s high $4,584 occurs
Reference Take Profit Line: $4,480 (basis: previous day low)
Reference Stop-Loss Line: $4,600 (just above the breakout line by $15)
※ This also has a small stop-loss width; please treat it as a参考値 (reference value).
Important Lines
Resistance 1: $4,595 (basis: 1H EMA75)
Resistance 2: $4,585 (basis: previous day high)
Support 1: $4,560 (basis: 1H EMA20)
Support 2: $4,480 (basis: previous day low)
1H EMA200: $4,635 (breaking this line accelerates the rise)
Today’s Word
“Not moving on days without clear conviction becomes tomorrow’s extra capacity.”
This article is personal analysis and does not constitute investment recommendations or solicitations. Please make trading decisions at your own risk.
If this was helpful, a follow would be appreciated.
Feel free to leave questions or comments.