
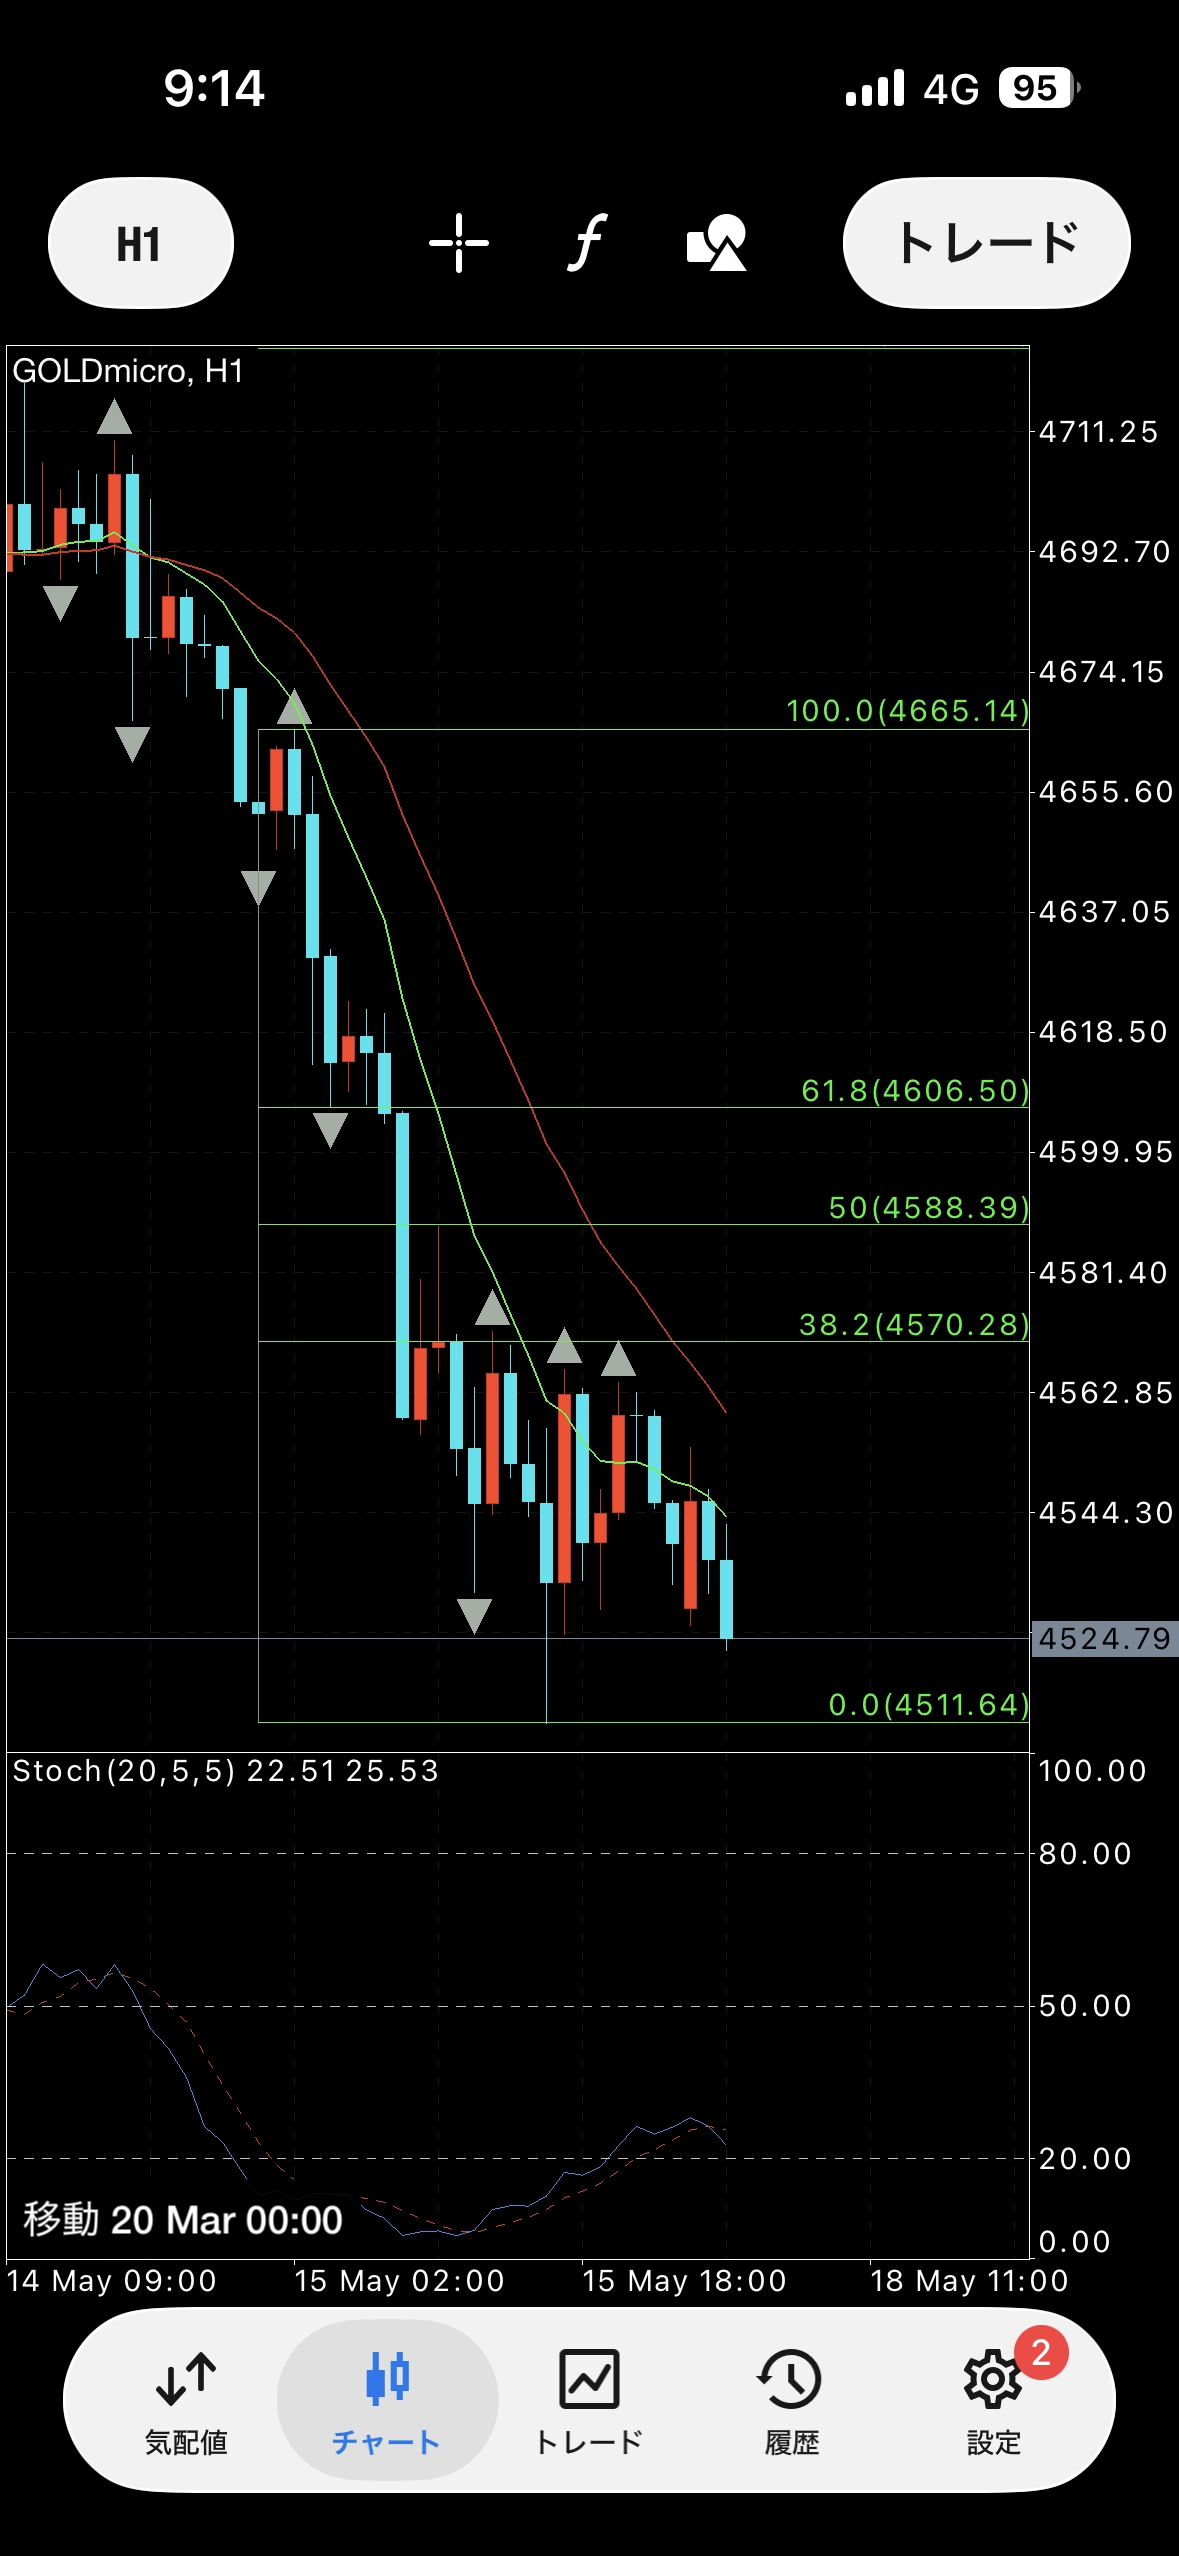
Gold Analysis as of 2026/05/18
The February blues are winding down, so I’ll start analyzing again.
【Daily Chart】
It was a bearish candlestick along with the weekly chart. It’s near the lower end of the range, and the trend is downward.
【4-Hour Chart】
Because there is a bullish outside bar, I will maintain a bullish outlook until it falls below the lower limit around 4526.
Since it’s Monday, I think it’s okay to wait and see until near the pullback area.
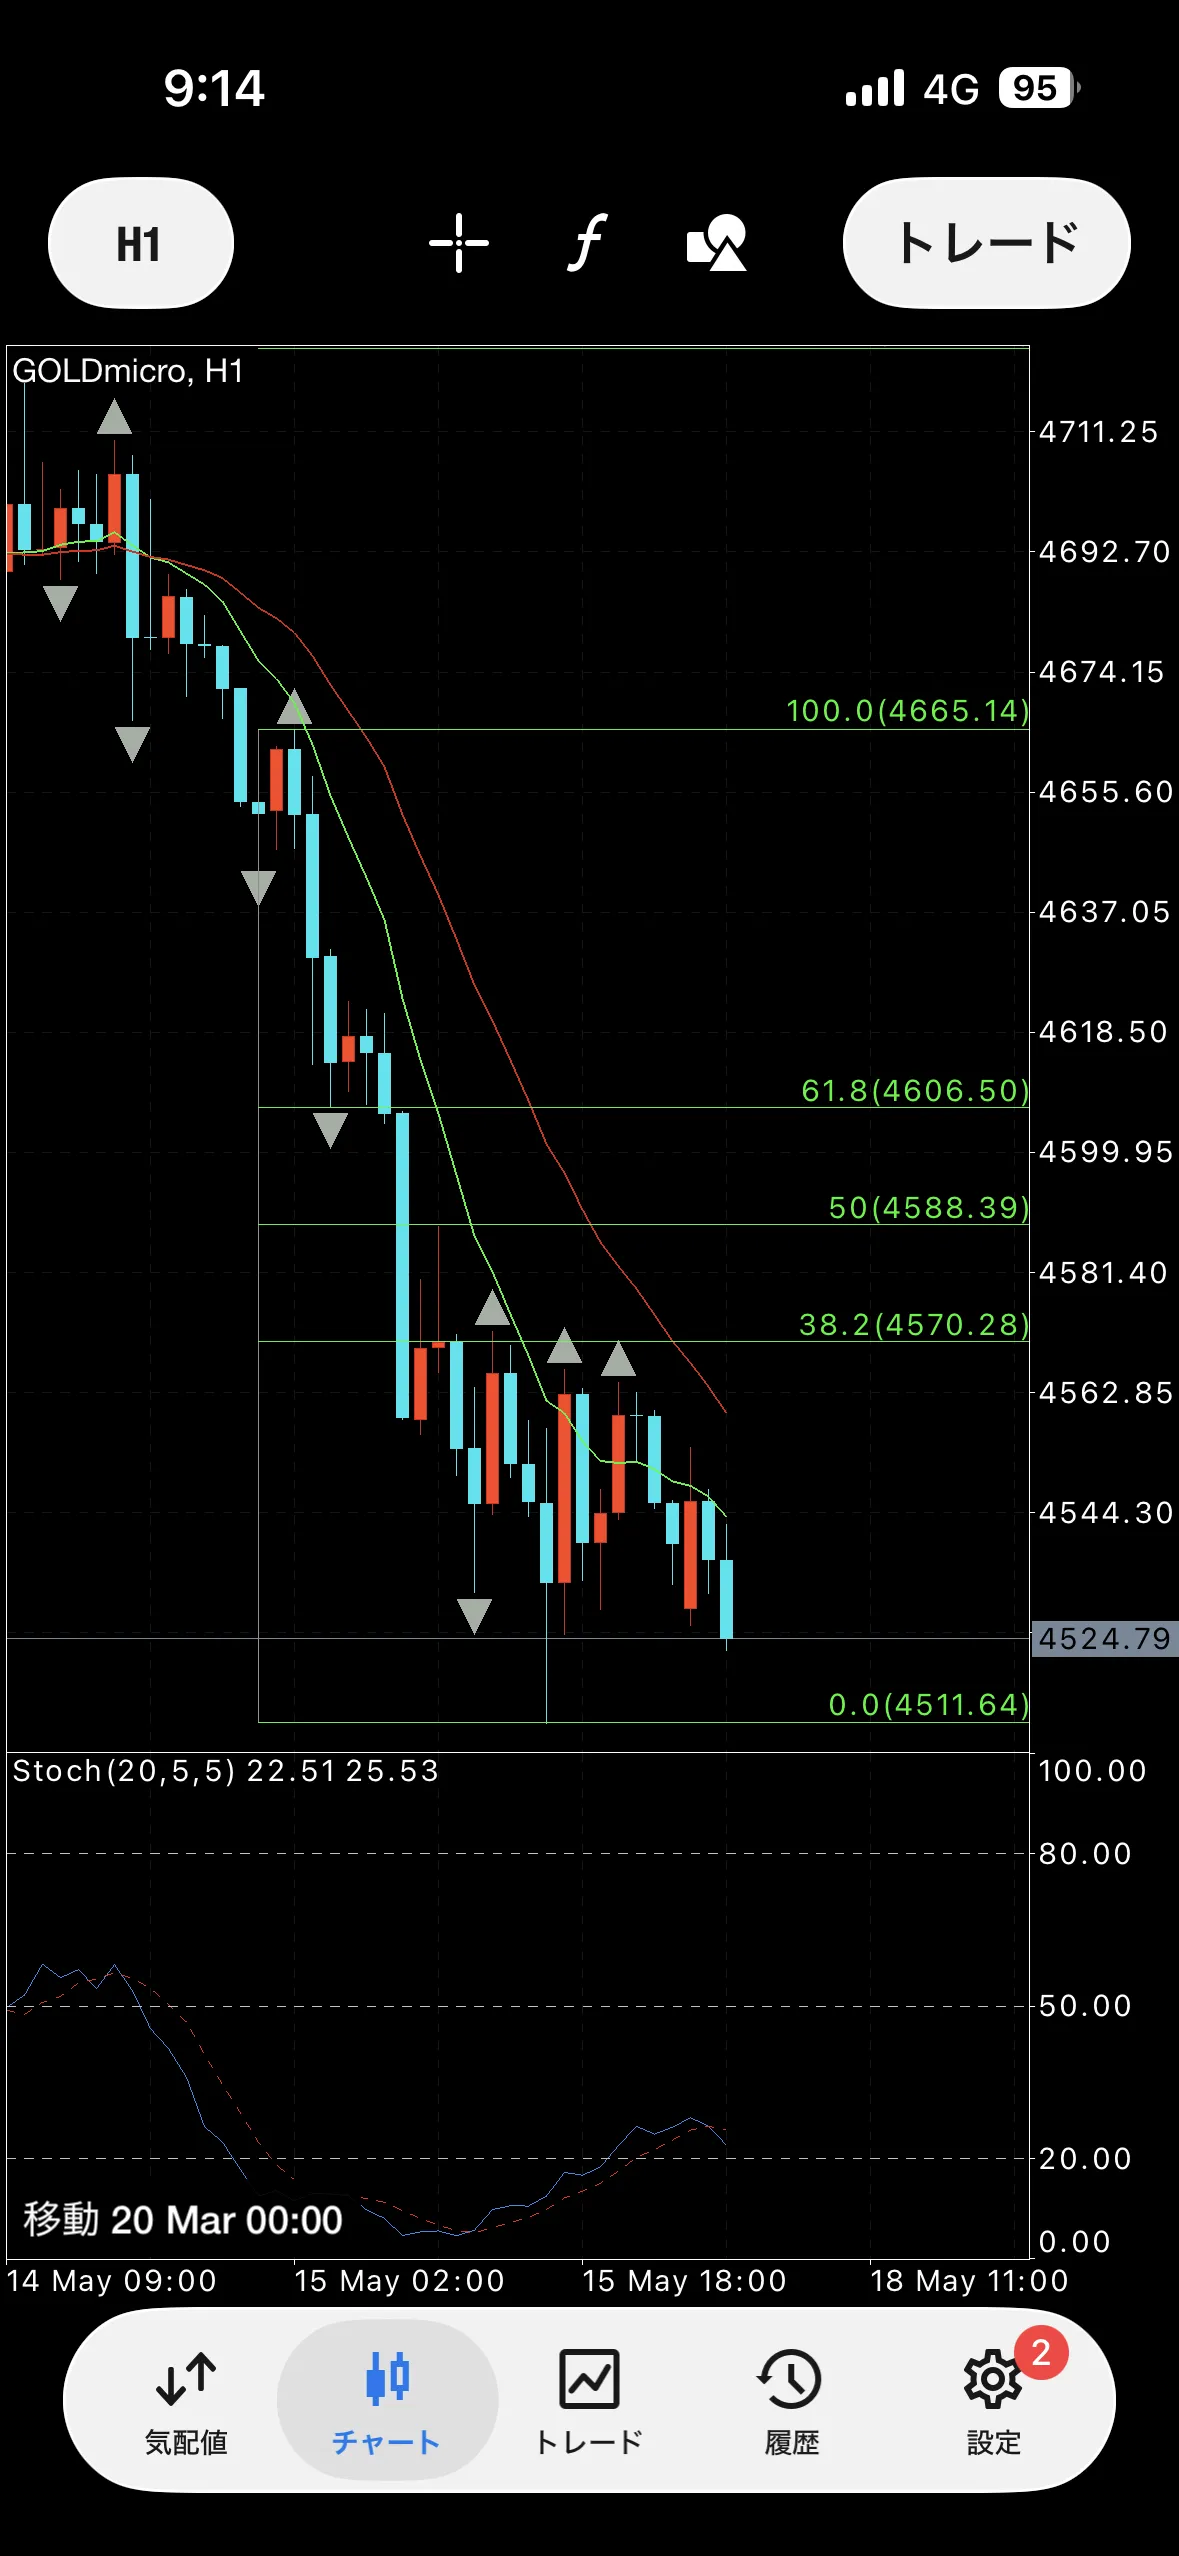
【1-Hour Chart】
It’s in a ranging pattern. Be careful that any breakout is still at a four-hour level.
【Sell Defense Lines】
4606
4588
4570
【Buy Defense Lines】
4511
4453
4416