
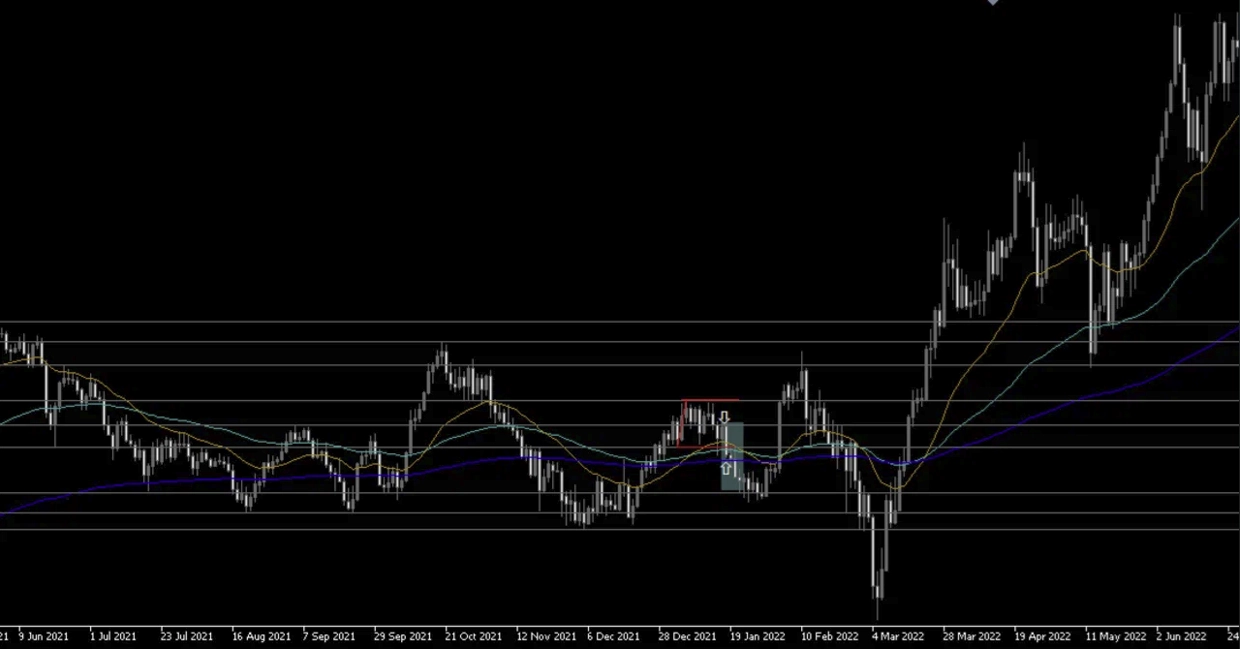
[Methods previously used] ⑦ MTF Reversal Method
Hello, this is 2pay!
This time as well, it’s part of the Method Series.
We have tried various discretionary methods, but since moving into FX, this method has become established.
Back then, I increased money quickly by raising the risk-reward ratio to 1.
It felt like 50k → 100k → 200k → 1,000,000, something like that.
Now, moving on to the explanation.
What is the MTF Reversal Method
We don’t usually name the method, but for convenience I’ve given it a name.
What you do is check the phases from higher timeframes to lower timeframes, cross-check the technicals, and enter on a consensus.
There are many checks, so I’ll organize them by steps ↓
① Draw horizontal lines (reversal candidates) at high/low points and necklines on the higher timeframe.
② Refer to reversal indicators like Stochastic on D1
③ Confirm Dow Theory reversal on H4
④ On H1, look for MA cross and chart patterns to confirm trend reversal.
⑤ Close positions at the most recent high/low
MTF analysis is really tough, isn’t it? Haha.
I’ll explain using actual points I took at the time.
It’s more suited to profit but I’m not doing it anymore now. (Too much work)
① Draw horizontal lines at higher-time highs/lows, necklines, etc. (reversal candidates)
First, pick price levels that could serve as reversal bases.
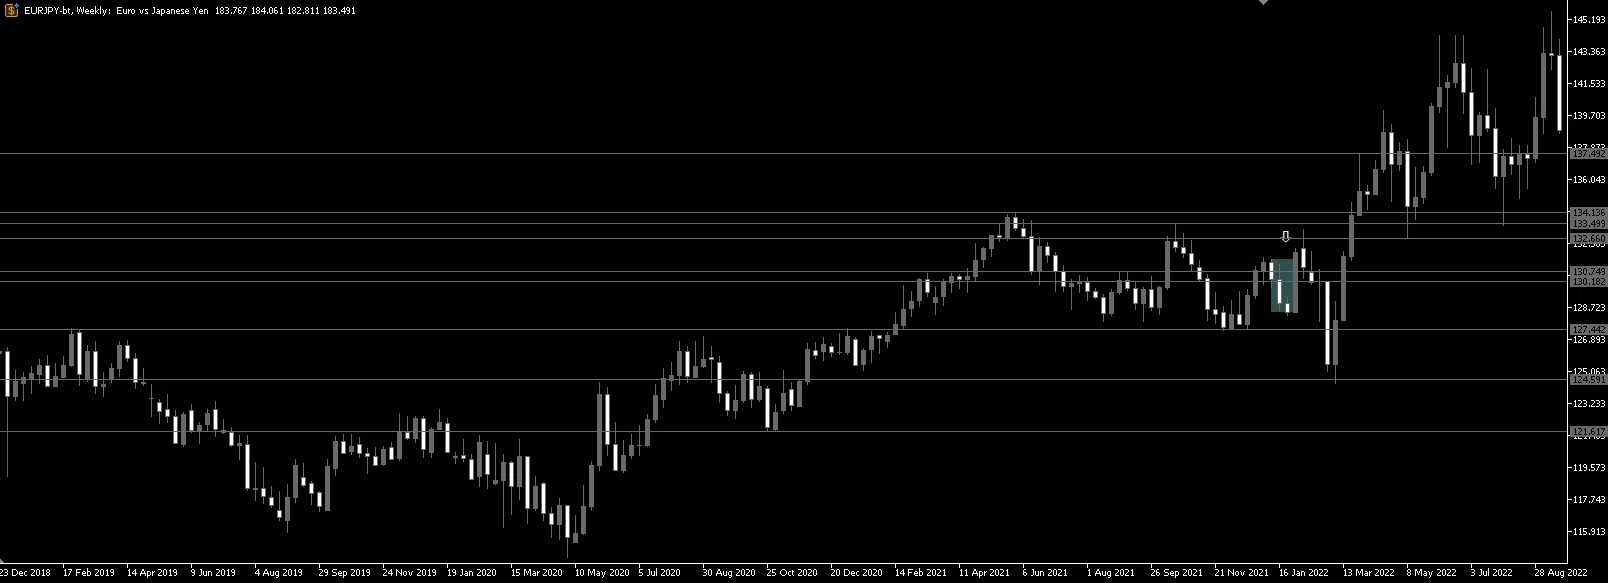
The horizontal lines are visible at high/low points and necklines on W1/D1 scales.
In practice, price rarely reverses exactly at the same level, so assuming reversal within 70%–130% of the most recent high as the base (100%).
The image is the EURJPY weekly chart for the week of 2022.01.16.
The marked area is the current point (short direction).
② Refer to reversal indicators like Stochastic on D1
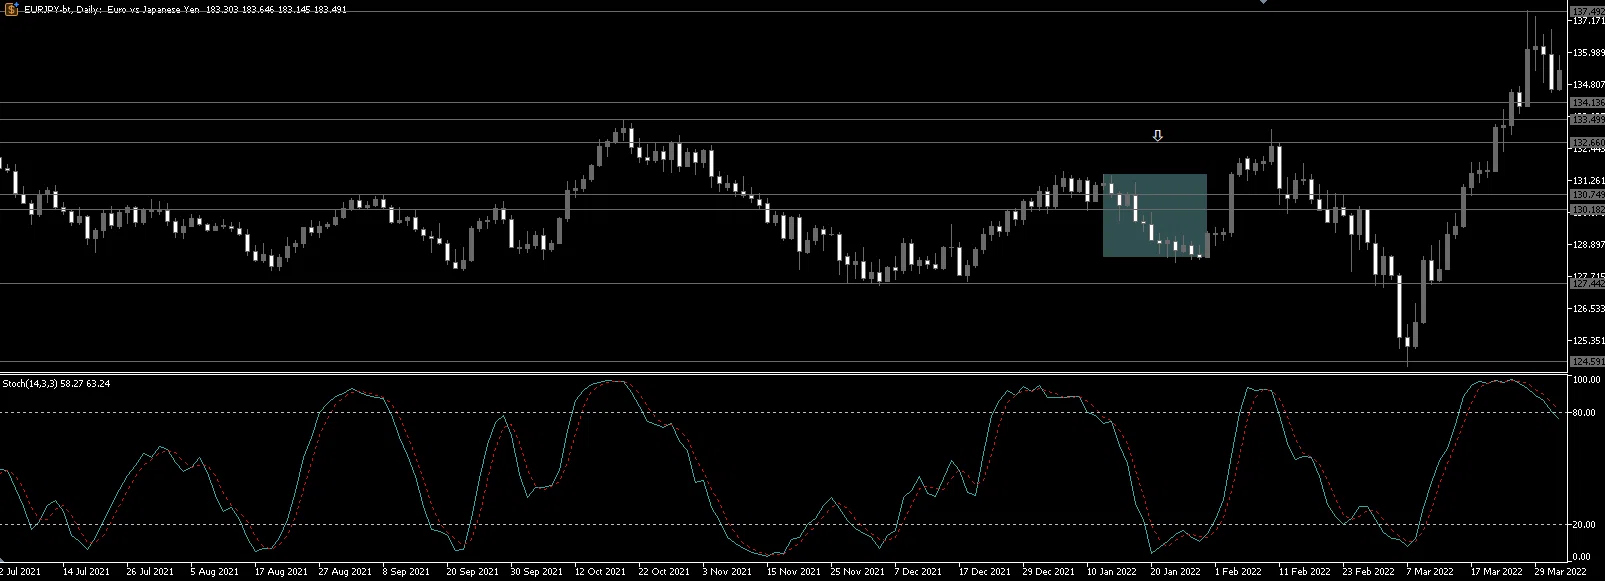
As a note, confirm reversal on the scale one level below what you confirmed in step ①. This time the Stochastic period is 14,3,3, but use it in a way that matches the swing size up to that point.
The market condition at this time shows a reversal signal near the upper end of a range.
Stochastic can give false signals, so don’t trust reversals too easily.
Step ② is to verify that the price had been moving in one direction until the reversal, up until that point.
In other places as well, you can see consecutive bullish candles forming in advance.
When this rhythm breaks (trendline break), the reversal fits nicely. We will confirm Dow reversal a bit more on a lower scale for detail.
③ Confirm Dow reversal on H4
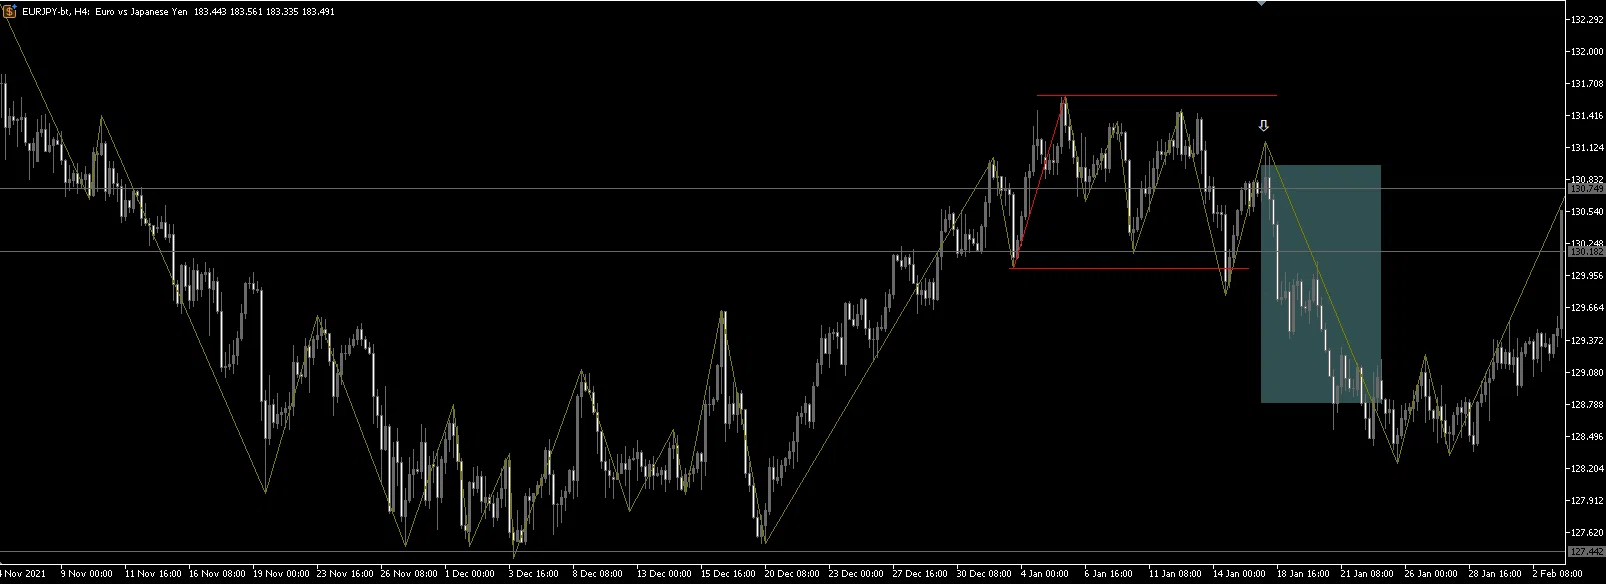
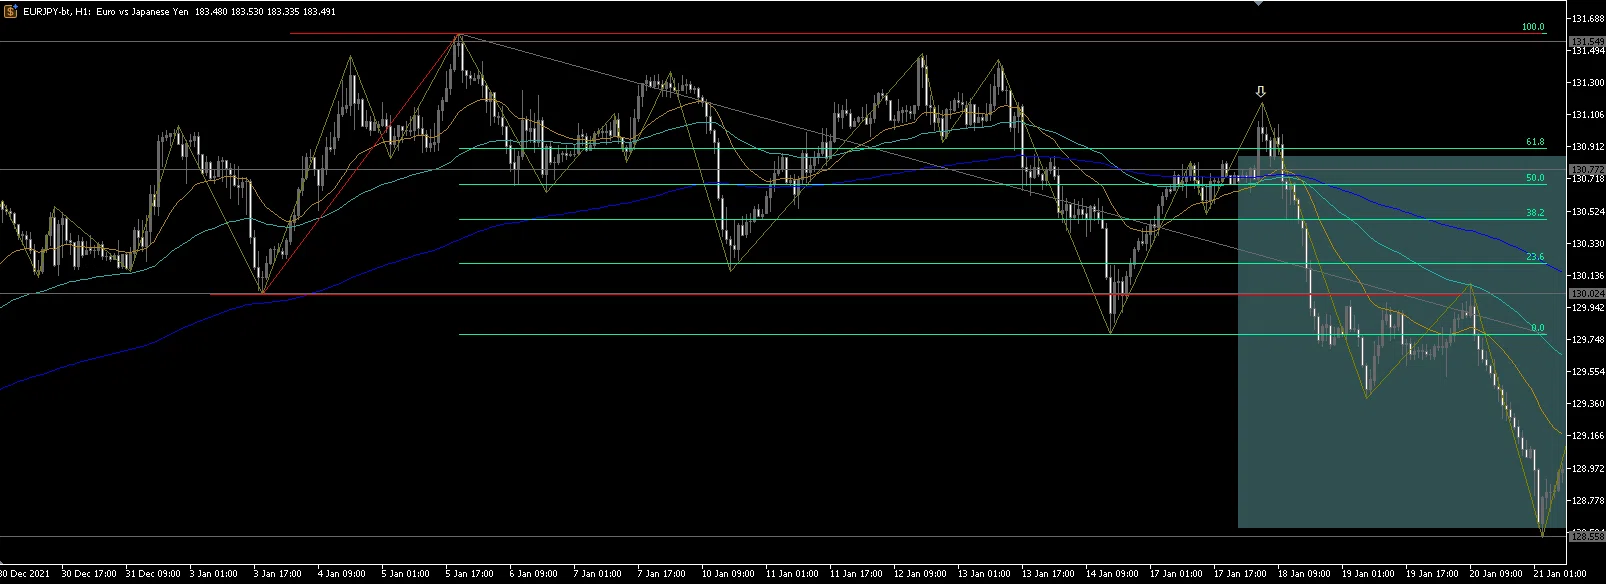
I drew a ZigZag on H4. The swing that last updated its high will fail to reach a new high and will instead update the low. (Dow reversal)
Draw a Fib line between this low and the high and target a pullback sell.
④ On H1, check MA cross and chart patterns to confirm trend reversal
I look at MA25, MA75, MA200 to confirm a dead cross. It’s not mandatory, but it tends to break down around the same time as Dow reversal.
Here, I verify that the trend reversal on the higher timeframe and the trend reversal on the lower timeframe can be identified similarly.
Next, execute a pullback sell at Fib levels of about 50%–61.8%.
At this time, a small swing’s neck line serves as a reference for the reversal target.
When price breaks above 61.8% Fib, a large bullish candle occurs. (stop hunt)
If you enter after confirming this, you can do a wick-entry.
(Back then I had real jobs, so I placed limit orders at this level)
If price does not fall within 2–3 candles after the bullish candle, exit.
The moment a big bullish candle appears, on a micro scale a golden cross occurs and it breaks the recent high. Traders who don’t confirm the higher-timeframe flow can get fooled here.
⑤ Close positions at the most recent high/low
Close when the most recent low is broken. At the time I waited for Fib extension levels, but as a rule of thumb shorts are less likely to extend (subsequent data confirmed this).
When it extends, it does. But players change, so you need to categorize it as a separate logic.
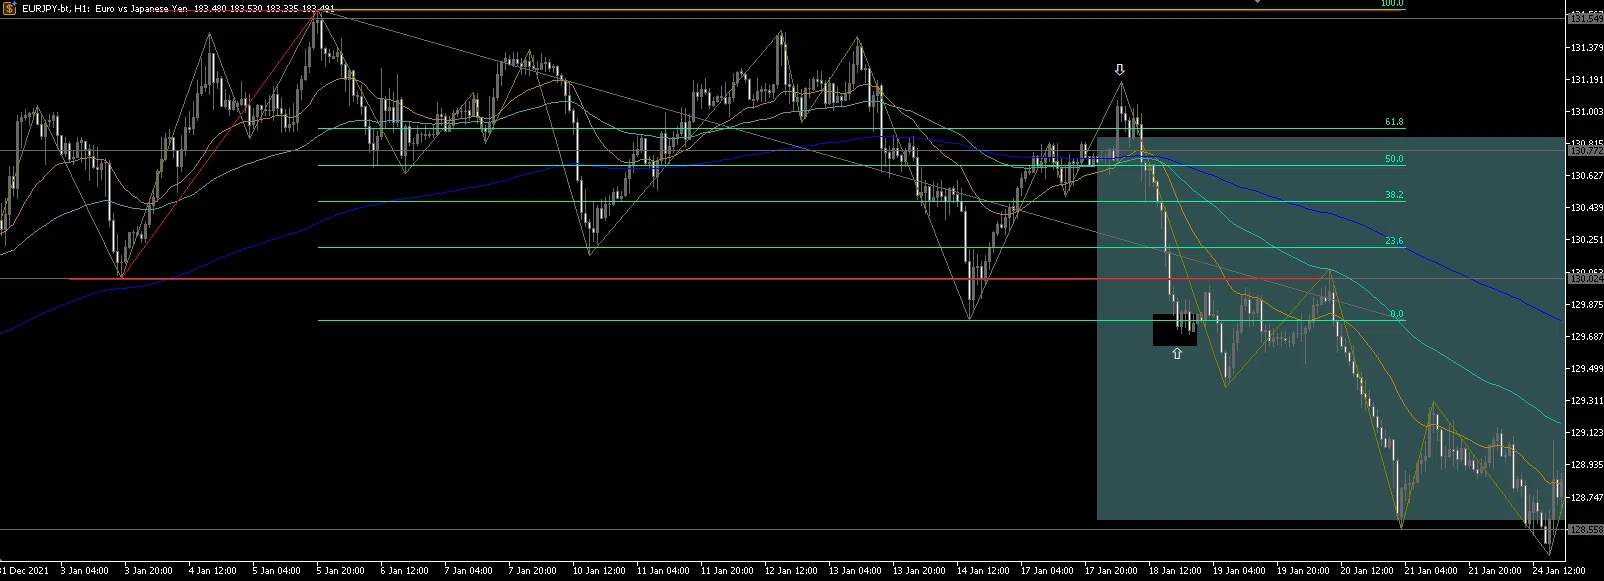
Recently volatility is high, I expect a bit more break, but even then I captured about 170 pips. Meanwhile the stop loss was only 20 pips, so I could risk larger lots relative to allowable loss.
The combination of duration & profit target is the essence of MTF—you can dramatically increase gains if you push it.
If you drop to M1 or Tick, you can tighten the stop loss even more, but personally I couldn’t; there were periods of stress that kept me from discretionary trading, so I’ve stopped it for now.
Summary
That covers the content for this time.
This trades much more profitably than mediocre system trading.
However, the downside is you must be glued to the hourly chart as reversal draws near.
Back then I set hourly alarms on my smartphone and checked the charts continuously. I was even considering using an Apple Watch to check charts. Account funds can move quickly, so it’s exciting but stressful.
This marks the end of the discretionary-methods series.
With this MTF method, I will retire from discretionary trading.
In the future I plan to share mainly the world of system trading I’ve sought, even if it means giving up big wins.
Thank you for reading until the end.