
[Techniques previously used] ⑥ Momentum + Breakout method
Hello, this is 2pay!
Today is an introduction to a breakout method using volume.
When I started discretionary trading for the second year, the approach based on volume was the first to give me a sense of real progress.
Volume is sometimes described as a leading indicator among technical indicators.
Volume has a wide range of uses, and readings vary depending on how it is used.
Here, I will limit the introduction to the basics of volume and how to use it directly for methods.
What is volume in the first place?
Volume is counted when a pair of requests (orders) at a bid and ask are matched, i.e., a trade is executed.
A request is sending the intention to buy at a certain price and quantity to the broker (exchange); when the request is accepted (matched), the broker assigns a position to the trader.
This is a trade execution = a filled order.
Requests can be market or limit (limit orders, stop orders), and there are entry and close orders as well as cancellations and modifications (changes to the order).
(Example 1) Buy request 1 + Sell request 1 → matched (executed), volume 1
(Example 2) Buy request 150 + Sell request 200 → volume 150
(At this time, the remaining Sell order 50 will match with buy orders at a price below the current price, and the Sell order 50 will be cleared as the price moves down.)
The quantity of requests is displayed on the order book (board) as orders (limit orders, stop orders). Market orders do not appear on the board, but their matching priority decreases.
(To process the board first and then match market orders, by the time of execution the price may have moved = slippage)
Also, in matching, whether it is In (entry) or Out (close) is not distinguished.
In summary, volume is an indicator that shows the number of matched executions that have occurred.
Directly related to the method, how to use it
Volume is the absolute value of executed trades. The more volume, the more trades occurred.
Regardless of the process, the result is that a large amount of capital moved through the trades.
If this was executed by large orders from some investors, the trend is expected to continue for a while.
The key is to determine whether large orders came in, and it is good to view this together with price movement characteristics.
Volume + Breakout approach
Nikkei 225 M5~M15
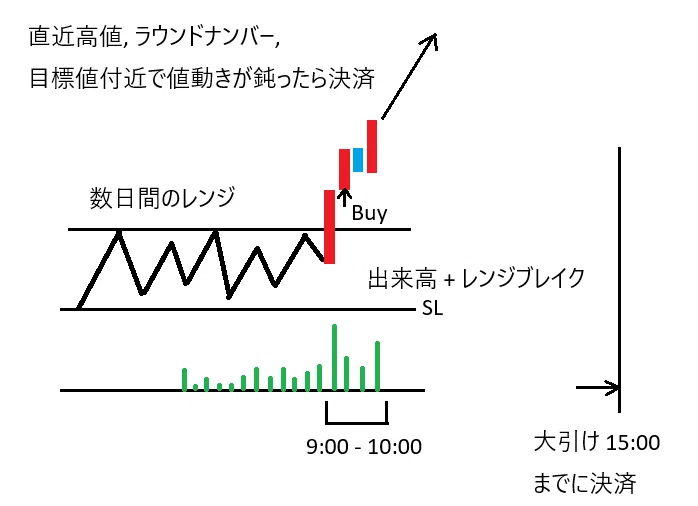
Check the previous day’s sideways range (ranges spanning several days are also fine)
Between JST 9:00 and 10:00, if there is several times the normal volume and the price breaks out of the box range and closes outside the range, enter on the breakout in the direction of the trend
An absolute volume threshold varies by exchange and time period, so it cannot be stated universally.
Go back about the last three months on the chart and use how much it moves at the breakout as a guide.
Stop loss is on the opposite side of the box range (high/low)
Take profit width is 1–3 times the box range
How far it extends is also referenced to the most recent target rate (support/resistance, round numbers)
Whether it extends or not, the basic practice is to settle during the day (regular trading session).
Less frequent trading, but you can aim to gain hundreds to thousands of yen at a time.
“Less frequent” is an absolute condition for profitability stability.
By the way, the Nikkei 225 futures day session opens at 8:45 (pre-open).
However, the Tokyo Stock Exchange (stock market) open is 9:00, so the 15 minutes until 9:00 are a period for adjusting positions from the night session, and the main flow starts from 9:00.
Even if you anticipate in the pre-open, it’s safer to confirm the flow after 9:00 before acting.
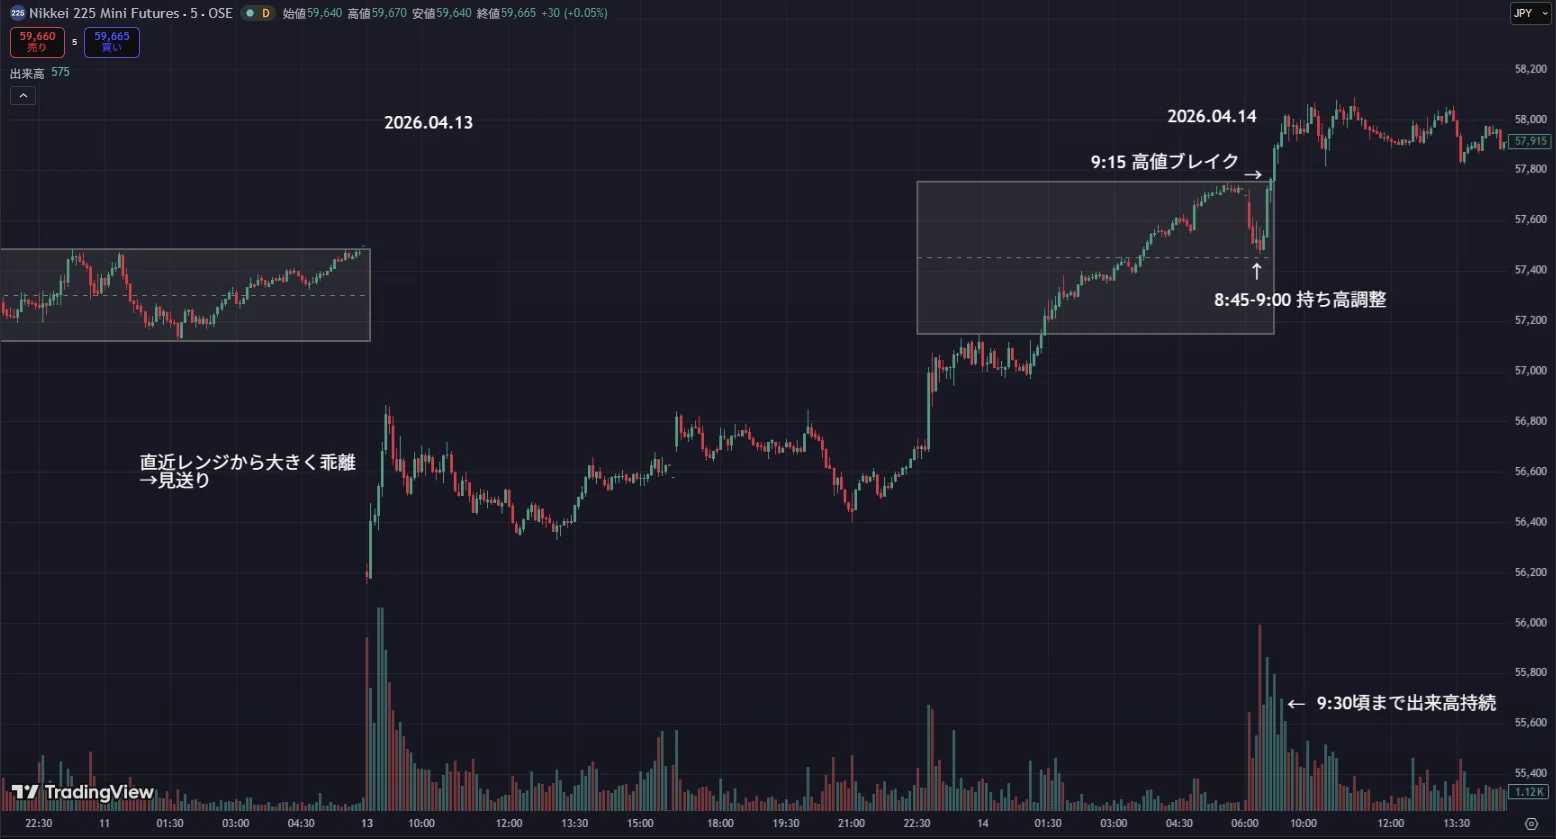
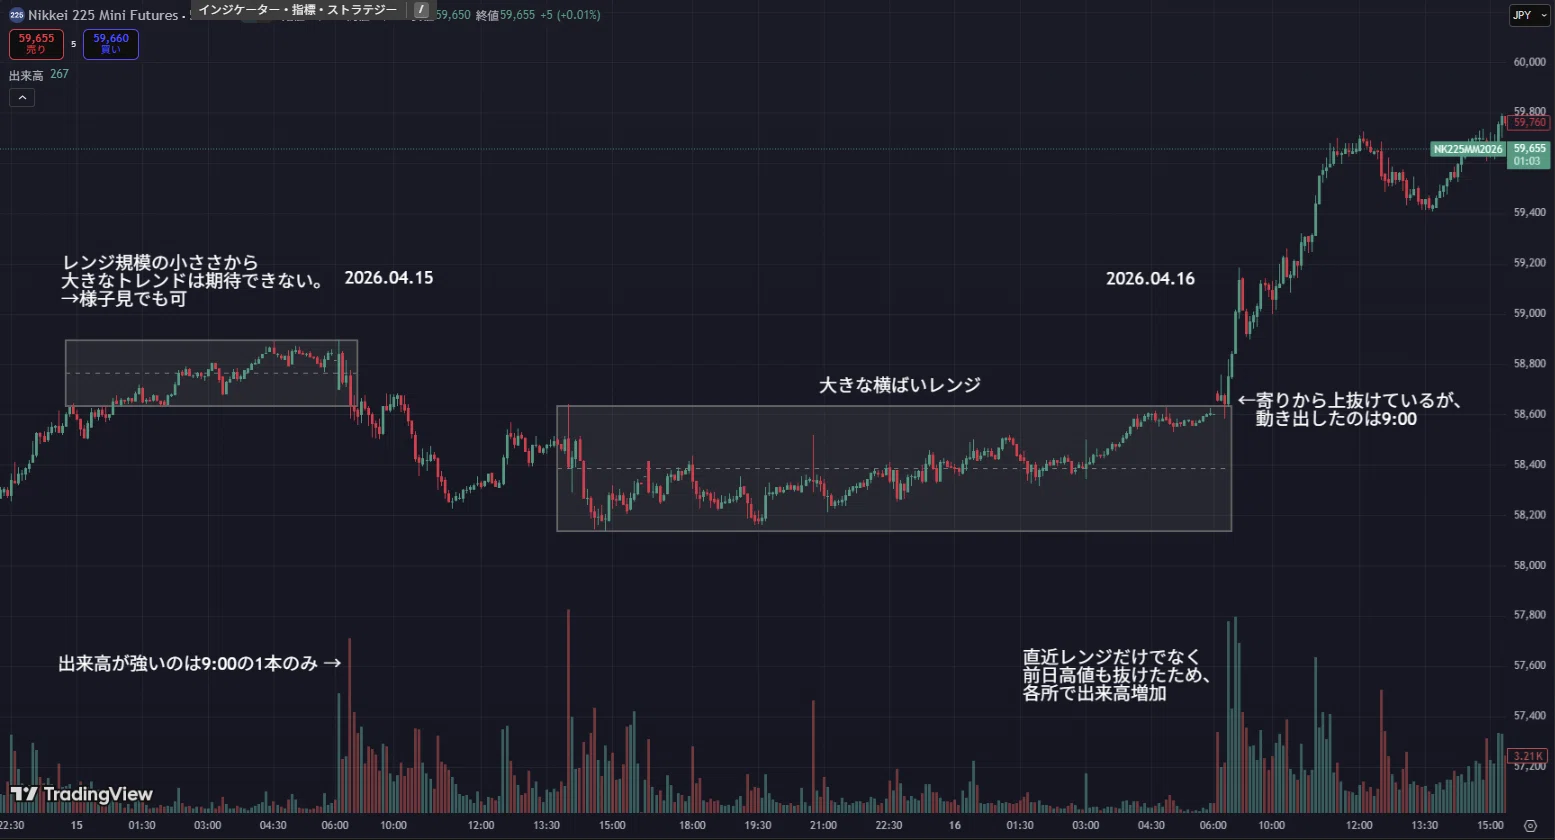
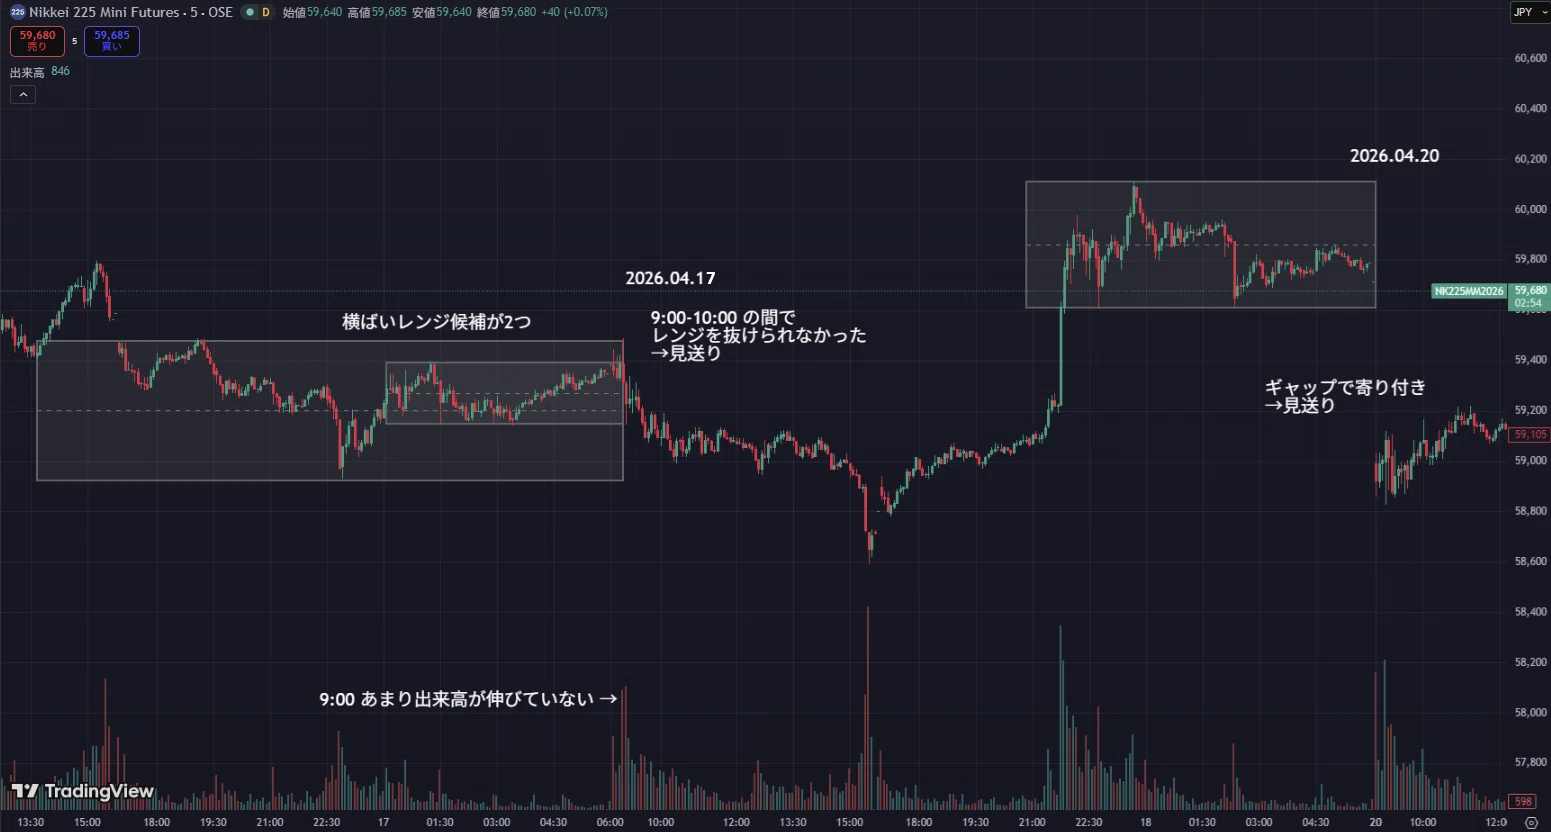
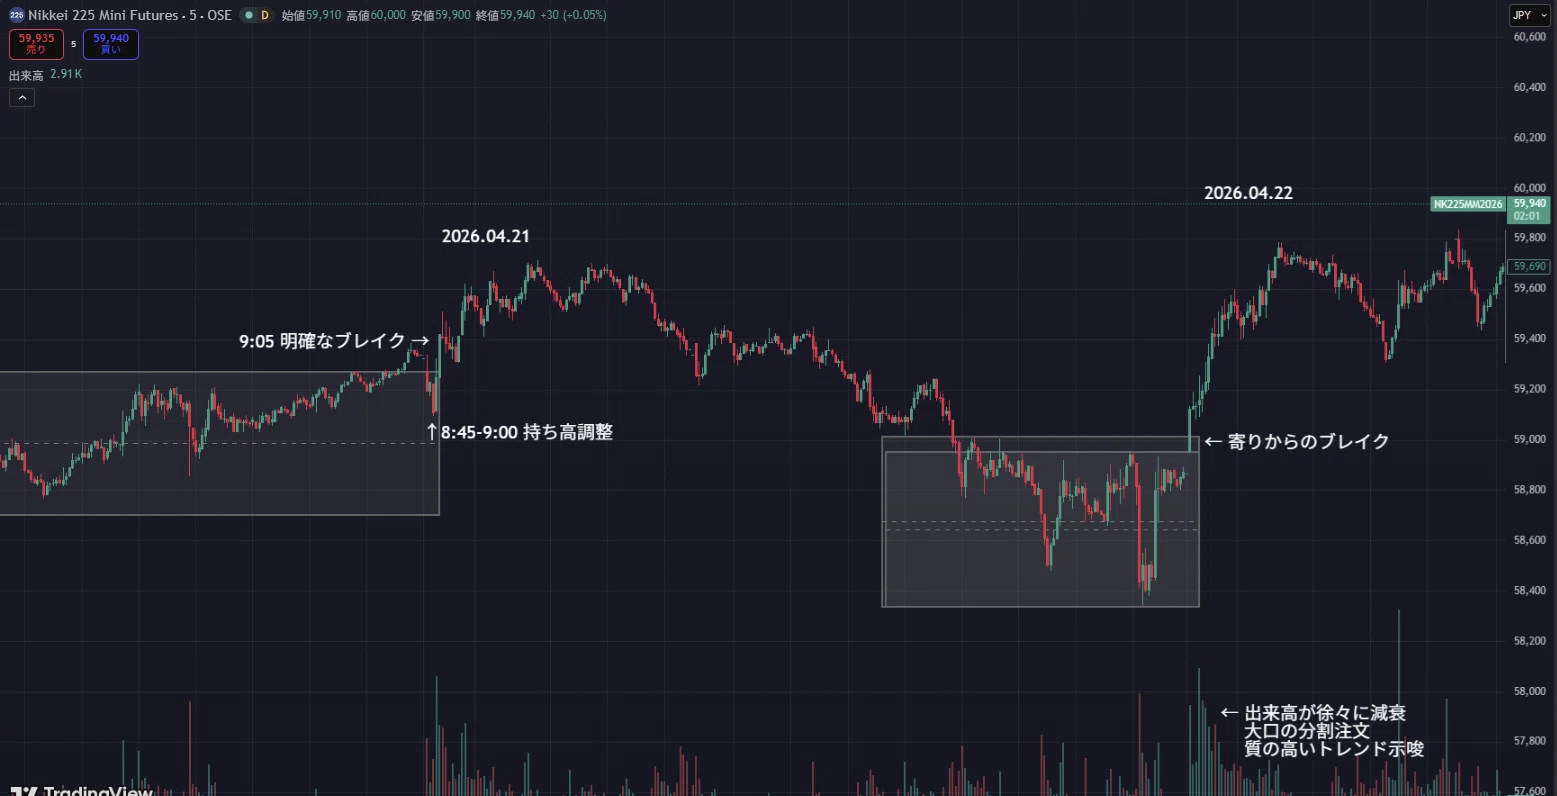
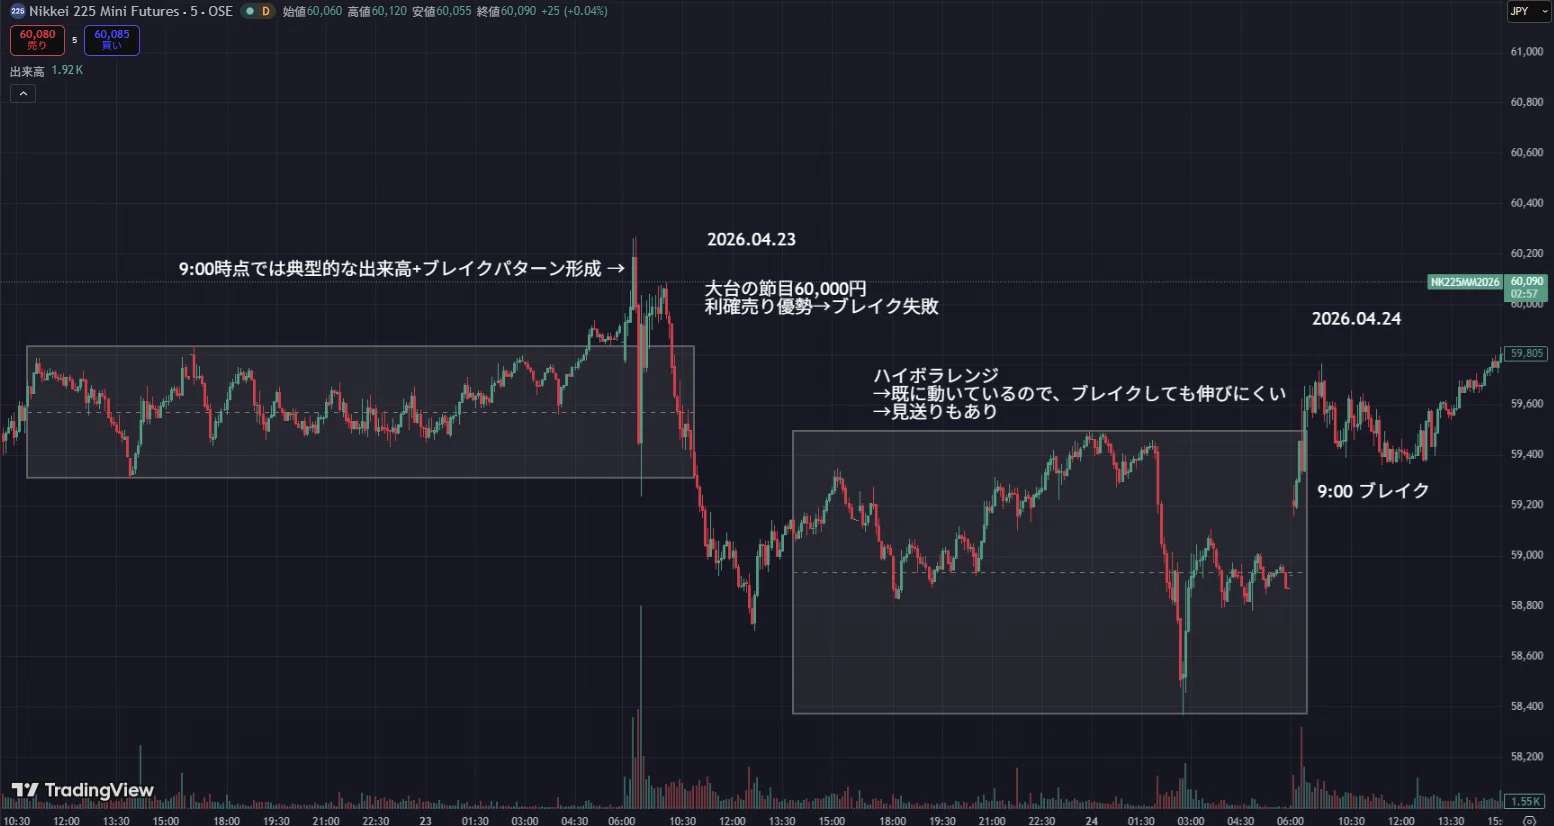
A note from the last two weeks around the open.
It also includes days to take and days to pass or failure patterns.
I don’t know any MT5 brokers that provide Nikkei 225 volume data, so I use TradingView. For this method, TickVolume behaves differently, so it’s better to look at volume instead.
Summary
This time, I introduced volume + breakout method.
This method is faithful to the market’s essence and helps to solidify the basics.
Targeting breakouts in FX is harder than for the Nikkei.
Breakouts depend heavily on who is backing them, so even while you hold a position, observe how volume decreases step by step. It helps decide whether to extend profits.
That is all for this content.
Thank you for reading until the end.