[Previously used methods] ⑤ Harami Line Method
Hello, this is 2pay!
Today is a part of the series on past techniques.
The theme this time is "Harami cross" (engulfing line).
Do you all use candlestick patterns?
If you don’t have a technique that can beat others yet, I’d recommend starting with this.
About the Harami cross
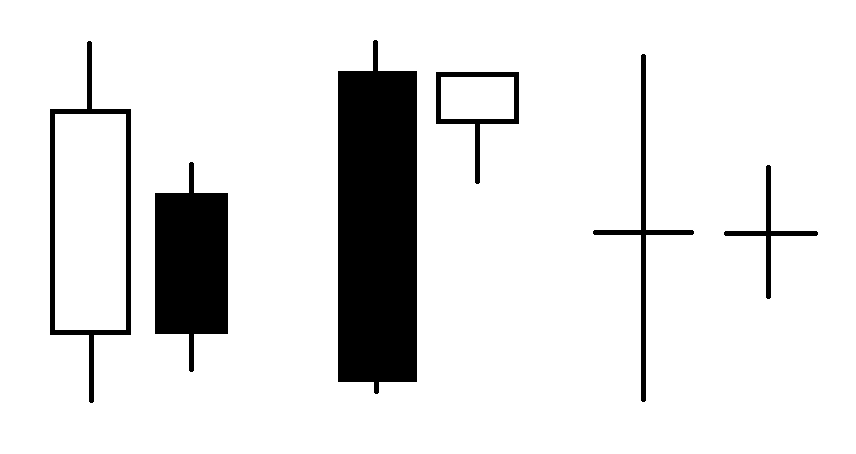
The Harami cross consists of two candlesticks, with the basic form being a large first candlestick and a smaller second candlestick.
(There doesn’t seem to be a fixed combination of bullish, bearish, and doji candles.)
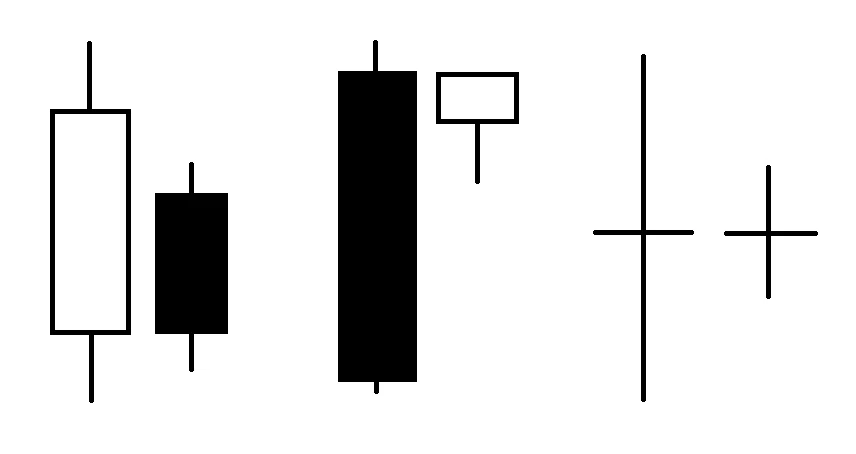
Quantitatively, the Harami cross is defined as meeting the following conditions.
・ High of the first candle > High of the second candle
・ Low of the first candle < Low of the second candle
As shown above, there are many variations of the Harami cross, but a common feature is the formation of consolidation.
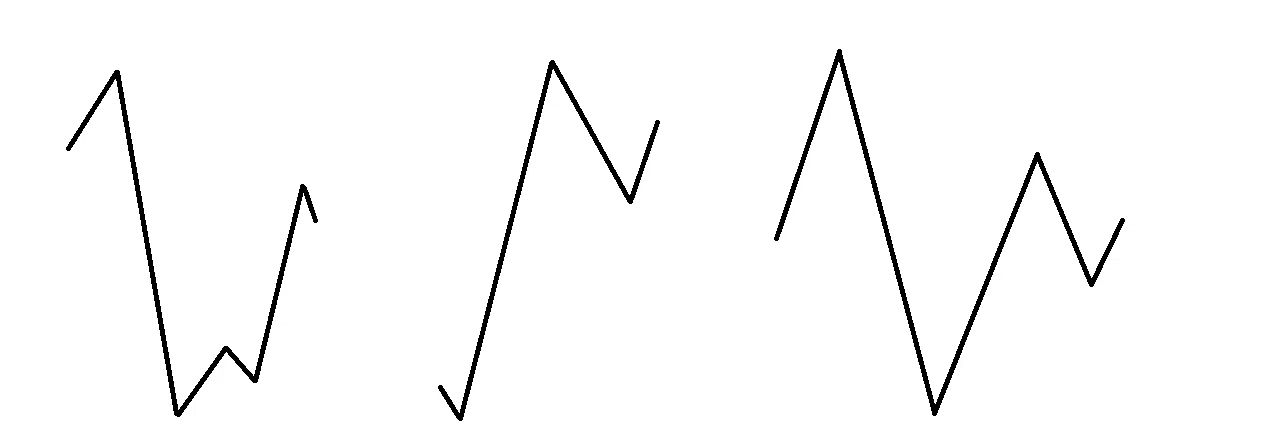
The figure below shows the price action converted into a line chart.
In all cases, the high and low are determined in the first half, and the latter half settles into small price movements.
What is a consolidation market?
“In general, a consolidation market refers to a state where, within a narrow range between the upper resistance line and the lower support line, prices move sideways with limited volatility.
It is a phase where the forces of selling and buying are balanced, and the direction is not yet determined. The longer this period lasts, the more energy is believed to be accumulating for the next large trend (breakout).”
That is the idea.
Did you understand what I’m trying to convey?
Consolidation is a sideways trend with no clear direction
→ The destination is not yet decided
“Energy accumulation toward the breakout”
→ A breakout refers to a break of the consolidation range
In other words,
If the price breaks above the Harami cross high or below the low, I’ll ride the move (trend-following).
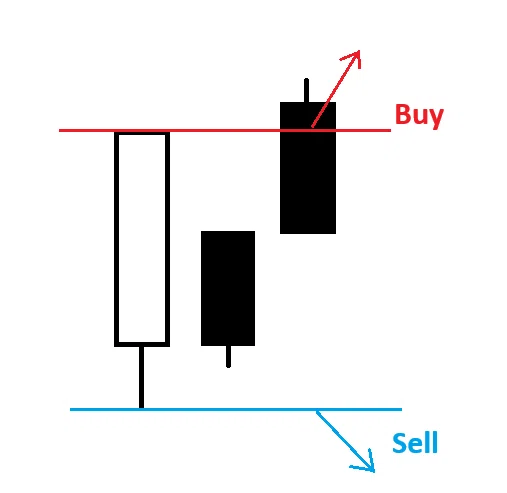
To recap the rules.
① Find the Harami cross
② Go long or short in the direction of the breakout
That’s all.
Please use whatever you like for exit/close.
It can be used like a trend-following approach, so fixed SL/TP, trailing stop, N-value, Fib, anything is fine.
USDJPY H1 (Fixed 10 pips)
The yellow boxed area is the Harami cross.
It is not necessary to breakout on the next candle.
The longer it takes to break, the more orders accumulate, so in general, a corresponding divergence can be expected.
In my view, the first candle of the Harami cross is important; if its volatility is larger than average, it will still function as a key rebound point such as the neckline after the breakout.
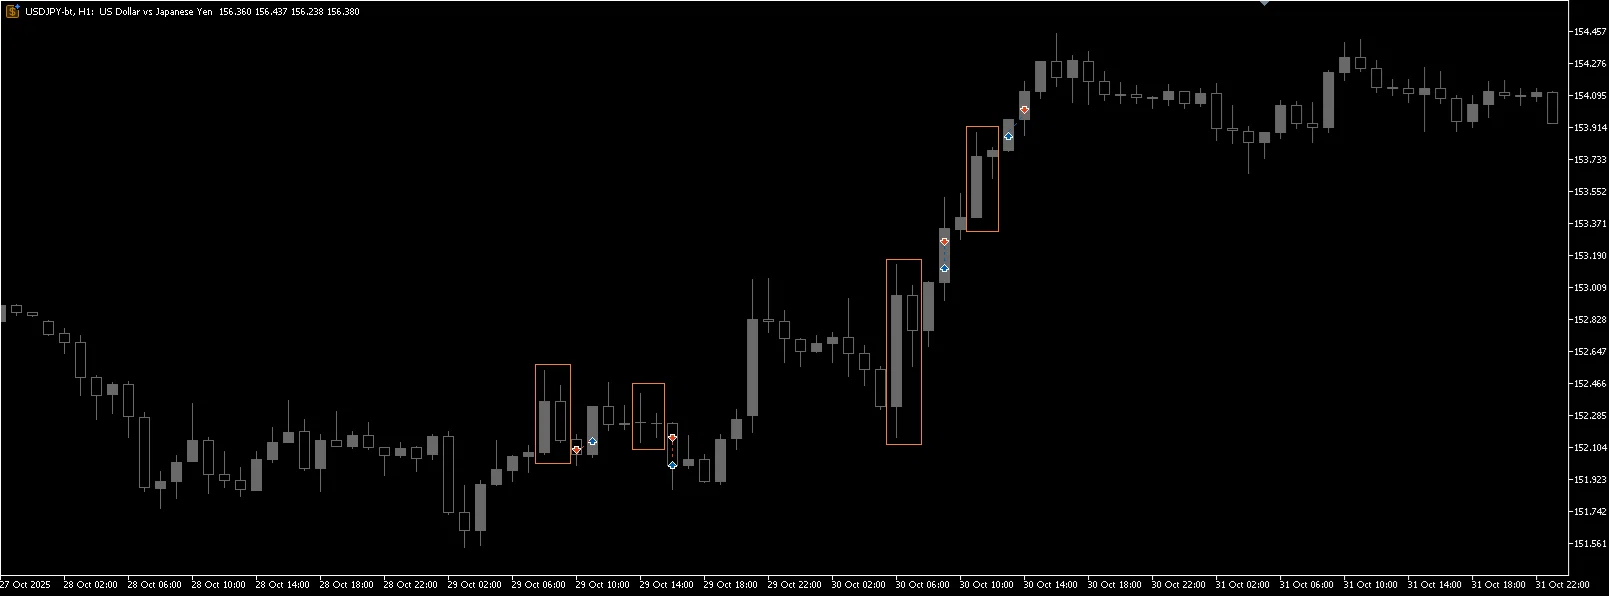
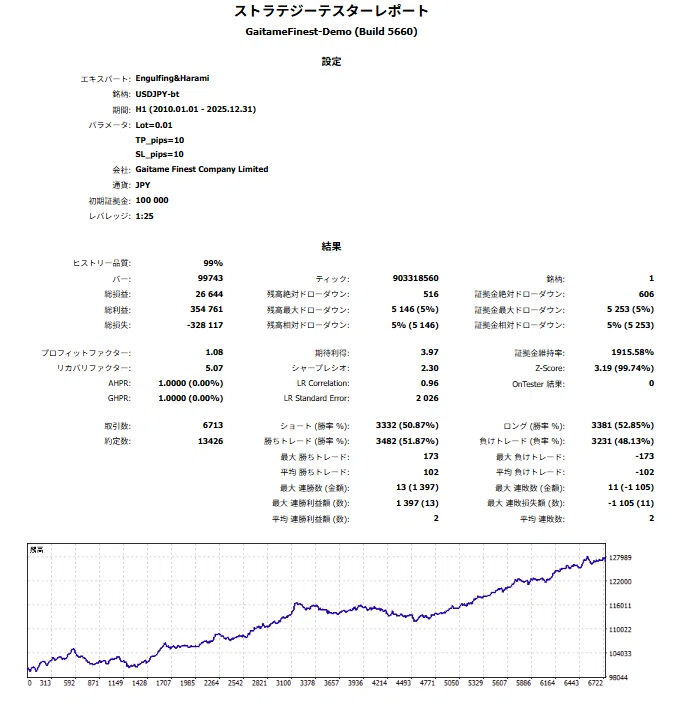
This time I have codified it into an EA and performed a backtest.
From 2010 to 2025, it has continued to function over the long term.
(With a slight filter)
This is derived from price structure, so even when its effectiveness wanes, it never completely disappears as an edge.
Summary
That brings us to the end of this discussion.
Originally, this method came about when senior traders taught me the engulfing foot (the reverse of Harami), and I found it by testing the price pattern myself.
If I’m being blunt, candlestick patterns are somewhat arbitrary.
If the price breaks out after a period of not updating for a while, you’ll get the results described above.
When converting to an EA, it’s easier to identify by looking at the candlestick pattern rather than the chart pattern, so that’s what I used.
If anything, a breakout of the engulfing line also yields results (though weaker than a Harami cross).
Two cautions:
・At short timeframes like M5, you’ll get noise losses, so use a slightly larger timeframe.
・There are timings when Harami cross breakouts are more likely to succeed (or fail). A hint is described in past articles and serves as a filter.
Thank you for reading until the end.