[Previously Used Methods] ④ Ichimoku Kinko Hyo Method
Hello, this is 2pay!
Today is a part of the past methods series.
This time's theme is "Ichimoku Kinko Hyo."
Ichimoku is a method that I personally found cluttered and didn't use much, but I think it can be useful in markets with volatility.
Markets with volatility
First, I will explain markets with volatility.
In many analysts' and commentators' talks, you often hear the words "high volatility (low volatility)." I think it is better to explain the definition of volatility first, so I will start with a preface.
The material used to determine whether volatility is high (low) is the "Rate of Change" (ROC).
ROC is an abbreviation for "Rate of Change."
In FX you don't hear this word much, but in the stock market it is commonly heard.
Because in the stock market, many stocks have high ROC.
Reasons ROC is not major in the FX market
In the FX market, ROC is small (= low volatility).
This is a market-structure issue: unlike stocks, FX is expressed as a pair of currencies' strength ratios.
Roughly speaking, stocks aim for corporate growth, so there is an overall upward bias in the market (tendency to be bought).
On the other hand, FX shows the relative strength between two countries. Normally both countries push for growth, so the balance between the two remains parallel.
If one side advances, the result is an acceleration curve similar to a compounding curve, causing volatility to expand rapidly.
Conversely, in markets where both sides exert pressure to keep prices in check, you can stay in a constant range for a long time.
This difference is what separates volatility trends.
・Stocks: structures that tend to move in one direction (upward)
・FX: due to the two-country strength relationship, tends to stay in a certain range
FX is often perceived as dangerous due to high leverage, but in reality the variability of volatility creates a structure that allows high leverage to be utilized.
The reality is that traders use high leverage because FX often doesn’t move much, whereas stocks, which already have inherent volatility, don’t require increased leverage.
The discussion of volatility is because trend indicators like Ichimoku are designed to be used in markets with volatility.
When Ichimoku can be used
Ichimoku is classified as a trend indicator, along with other trend indicators like moving averages and Bollinger Bands.
Generally, trend indicators are medium- to long-term oriented.
Because in the short term, noise increases.
The expression "noise increases" is something you can understand intuitively without equations.
For example, USDJPY over four years from 2022 to 2025 increased by
-(115.033-156.820) = +41.787 yen.
If we compare this with an M1 chart and a D1 chart.
The monitoring period is fixed, so the amount of rise is +41.787 yen on both M1 and D1.
We calculate this four-year rise in terms of movement per candlestick.
First, D1: using 250 trading days per year, the simple calculation gives a per-bar (per day) change of 0.167148 yen.
Next, for M1, the per-bar (per minute) change is 0.000116075 yen. It is simply 1/1440.
Now, which has the higher ROC per bar?
The D1, obviously, even before calculating.
What I want to convey is that the shorter the time scale, the more the per-bar movement effect is diluted (weaker).
This is an extremely important concept when using trend indicators.
Because indicators are calculated per bar (per candle).
Not so much because of false signals, but simply because the quality of per-bar movement is higher on higher scales, it is better to use higher scales.
If both M1 and D1 show the same amount of movement in the same period, then on the short-term scale you will pick up more noise that moves up and down unnecessarily.
In simple terms, since a day has 1440 minutes, the noise contained in M1 is 1440 times that of D1. (Some of those minutes are true price moves.)
Returning to the topic of trend indicators, trend means price moves in one direction and does not target a range.
So, between M1 and D1, which is more suitable for trend indicators?
Obviously, D1. Because there is less noise in the trend direction.
Using higher-timeframe context in MTF is also influenced by this consideration.
Did my intention come across?
Including Ichimoku, I prefer that trend indicators are not used on very short scales.
The dumbest thing is to base analysis on trend indicators on a short timeframe. (No positive return remains.)
Ichimoku, in particular, signals late, so in FX I recommend using at least H1 or higher.
In addition, stock selection becomes important.
In FX, cross-currency pairs are generally viewed as more volatile markets.
Basically, you can trade in cross currencies, or perhaps trade GOLD or BTC. When I used Ichimoku, I used it on the Nikkei.
Explanation of the method
What you need
・Ichimoku Kinko Hyo (default values)
・Scale: H1 or higher
A bit of a special usage.
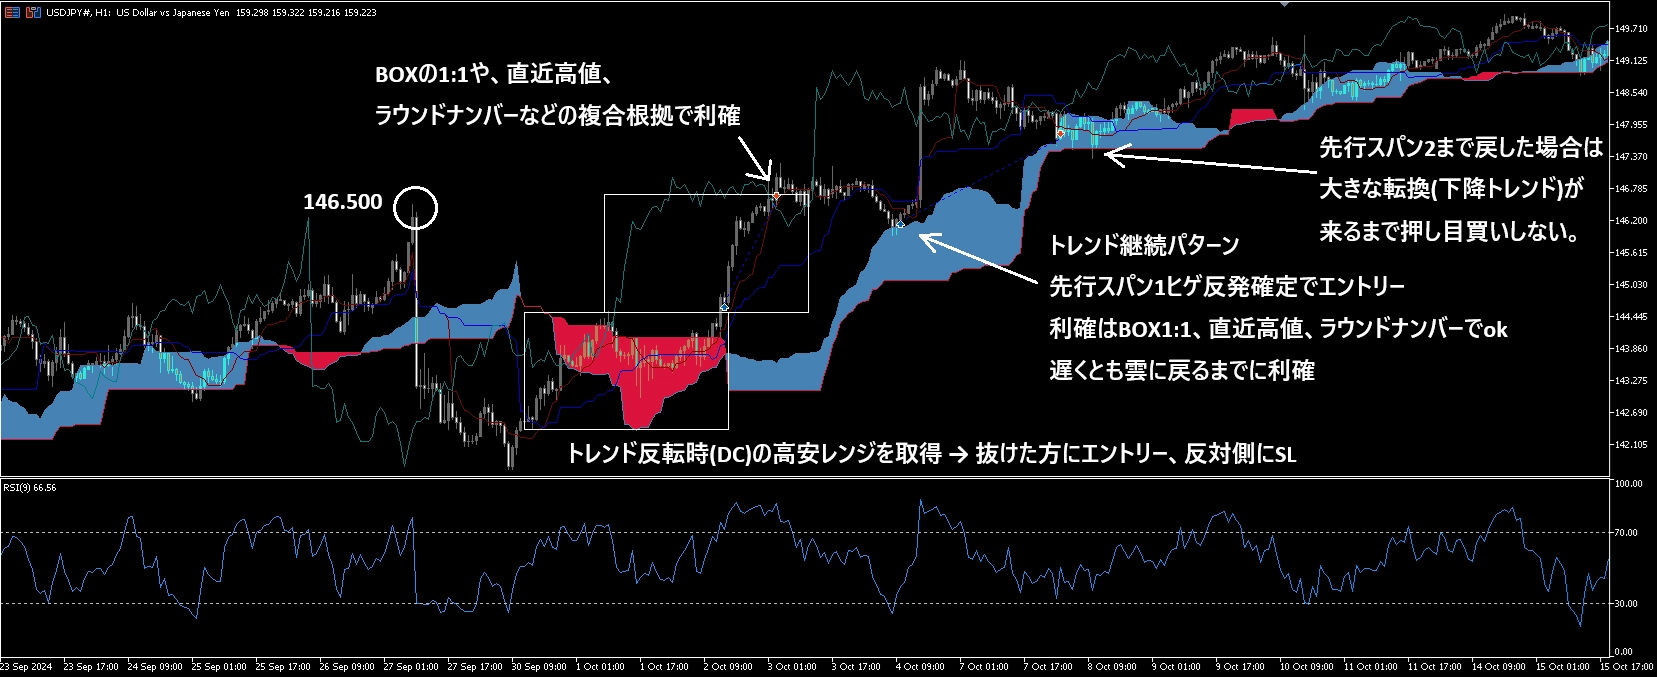
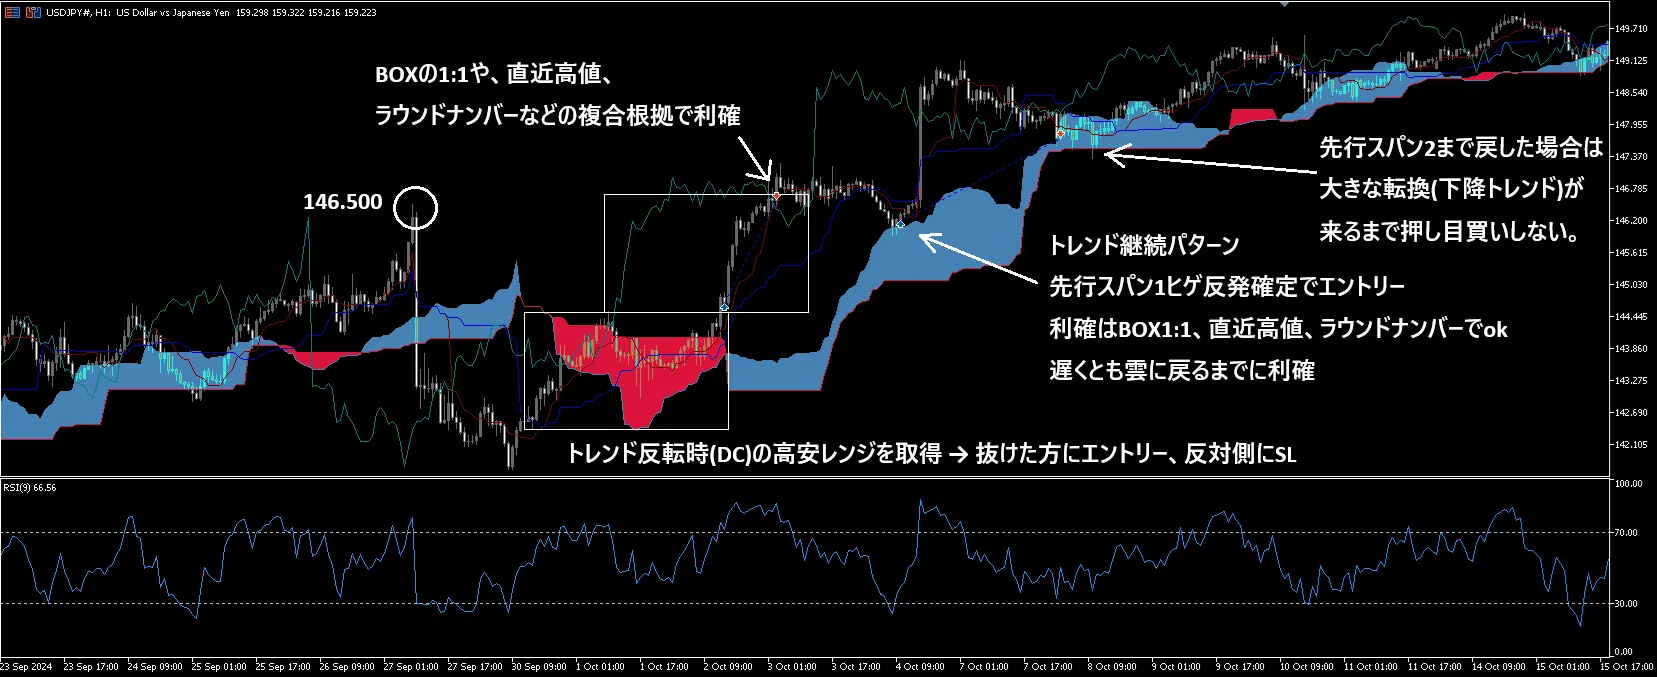
Entry occurs as a rebound between Senkou Span 1 and 2.
If a bar touches the Senkou Span and is pulled back by the wick, that is the entry signal.
For the use of Senkou Span 1 vs 2: at the initial trend movement (Dow turning, etc.), use Senkou Span 2, and during the ongoing trend, use Senkou Span 1 to confirm the rebound.
From a statistical perspective, deep corrections are not a good sign.
Because in a strong trend, it would continue in one direction without pulling back.
Therefore, a deep pullback in the middle of a trend is not a good sign.
Rather, it tends to be a sign of trend termination.
Why use Senkou Spans
In this method, Lagging Span, Turning Line, and Base Line are not used.
Because there is no meaningful statistical or mathematical reason to use them.
On the other hand, there is meaning in using the Senkou Spans.
Senkou Span 1 and 2 are shown as the midpoint of a specified period: (high - low)/2 + low.
In other words, they represent the 50% level of the period's range.
Why is the half-value better?
When measuring pullbacks, Fibonacci levels or half-values are well-known zones, but actually statistical distributions show that returns are not sharply concentrated at 50%, 38.2%, or 61.8%; they follow a smooth bell-curve (standard deviation).
This is the same as the distribution of a Pachinko ball's fall (you can look it up); the middle is most frequent.
So, statistically, based on the central limit theorem, 50% is the most frequent rebound point, and 38.2% or 61.8% tend to rebound closer to the center.
Because this is within the inner region of σ1 (68.3% = inflection point), the probability of rebound within 38.2–61.8% is about 70%.
It is not that Fibonacci works better; it is that statistically, the range tends to settle there.
(Testing which Fib level is the most effective is not very meaningful)
Ichimoku's clouds are not based on arbitrary highs and lows but on the specified period's highs and lows, so they may fail to capture major highs and lows.
Instead, they respond well to the most recent price movement, so using them as indicators for the most recent moves is preferable.
Summary
This time, I explained Ichimoku Kinko Hyo techniques.
Since it was not used much at that time, this time I focused more on recent statistical analysis rather than specific methods.
As with trend indicators in general, on very short-term scales you will be overwhelmed by noise, so I do not recommend using them.
Additionally, investors who use trend indicators tend to trade in textbook fashion.
If you enter on GC, setting a stop at the nearest recent low is part of the standard approach.
Taking advantage of this, by estimating that a stop loss is accumulated at the nearest recent low when a GC occurs, you can set up stop hunts or breakouts near the recent low in practice.
I am just an individual investor, so I do not know exactly what is done in the field, but I can estimate general points and I also have information to profit from using it.
Being able to do such things helps you earn steadily, so for beginners it would be good to at least be able to estimate a stop amount that tends to accumulate (refer to double pressure, etc.).
This brings us to the end for now.
Thank you for reading until the end.