[Methods used previously] ③ RSI Divergence Method
Hello, this is 2pay!
This time is the third installment in the method series, "RSI Divergence."
This is an arrangement of a method I learned from a senior in the early days.
In the senior's method, I was told to overlay divergence on the rejection points of horizontal lines or trendlines to improve the quality of the rejection basis. Really?
What is divergence?
First, let's start with the definition of the word.
What is "divergence"?
People might say, "It's obviously an 'opposite movement phenomenon'!"
The literal translation is (Divergence: dispersion).
Synonyms include
Retrograde: backflow
Contradiction: contradiction
Why does "dispersion" become "an opposite movement phenomenon"?
When you interpret Divergence loosely,
it refers to the situation where something that was originally similar gradually deviates and becomes different.
Apparently.
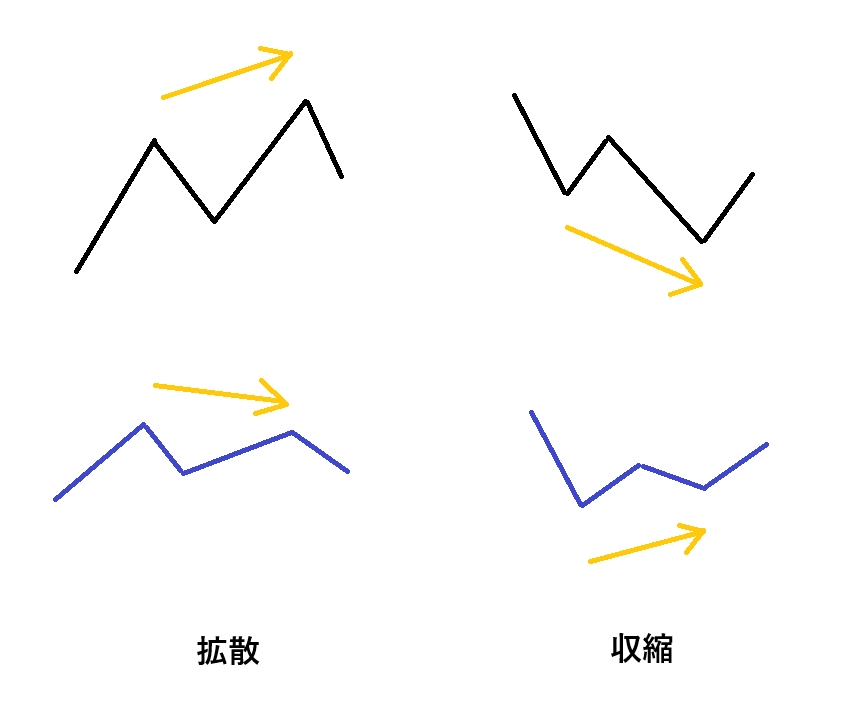
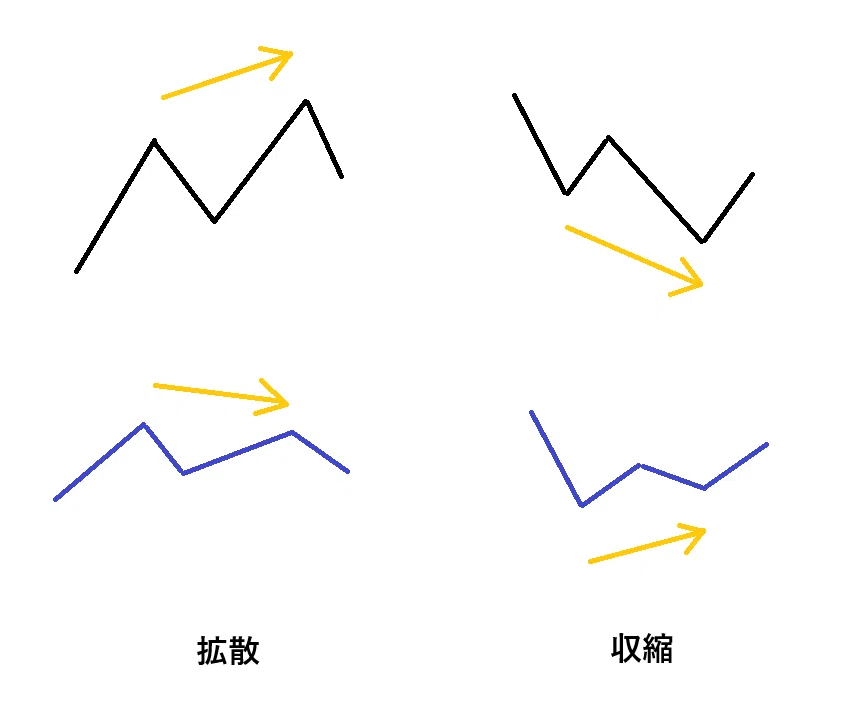
Prices climbing while the oscillator declines give a sense of "divergence," but prices declining while the oscillator rises may look like "contraction."
(By the way, Convergence is contraction.)
Historically, the term Divergence appeared in statistics and economics, and later was adopted in chart analysis.
However, once you can imagine a shape where price and oscillator diverge, you can surmise that this phenomenon emerged after monitors allowed side-by-side display of charts and sub-charts.
Back then, stocks and commodities futures were the mainstream, so the strategy was likely long-biased.
Seeing dispersion from a long strategy suggests that you were looking at the strength of the trend as an exit strategy rather than an entry one, as you can read between the lines.
Probably there was a high demand for peak detection.
This is the original use of Divergence.
Not a reversal signal
It is often misinterpreted, but divergence merely indicates that an opposite movement phenomenon occurred; it does not suggest that price will reverse.
Technically, the trend has weakened (i.e., ended), but there is no predictive power about whether it will continue or reverse. The direction is 50-50.
Visually, the reversal points stand out more, which leads to the illusion that reversals are more likely.
How should you use it?
The divergence range will see price move sideways.
The understanding is that the trend is weakening (or ending).
During this period, price forms a short-term box range, so trade in the direction of the breakout. (This aligns with Dow theory as well.)
In other words, use divergence as the defining box for a box breakout strategy.
RSI Divergence Method
What you need
• RSI 14 (default value, no special tweaks)
Currency: USDJPY M5
Note: It is broadly applicable, but please understand the currency and scale characteristics.
The following is an example of how to operate if using USDJPY M5.
Choosing currency and scale matters, so random combinations are not acceptable.
From 2026-02-10, we will monitor on a daily basis regardless of whether entries are taken.
I thought it would be better to illustrate including days with no entries.
(Trying to express things honestly can be confining, but it is part of the process.)
As usual, I have an indicator that color-codes market hours.
This is self-made, and the plotted dots sometimes look like airplanes. (ArrowCode:81)Even Haneda would be surprised by the density。
Also, to make the trend direction easy to see, I include MA75 as an auxiliary tool. I do not use it as part of the method.
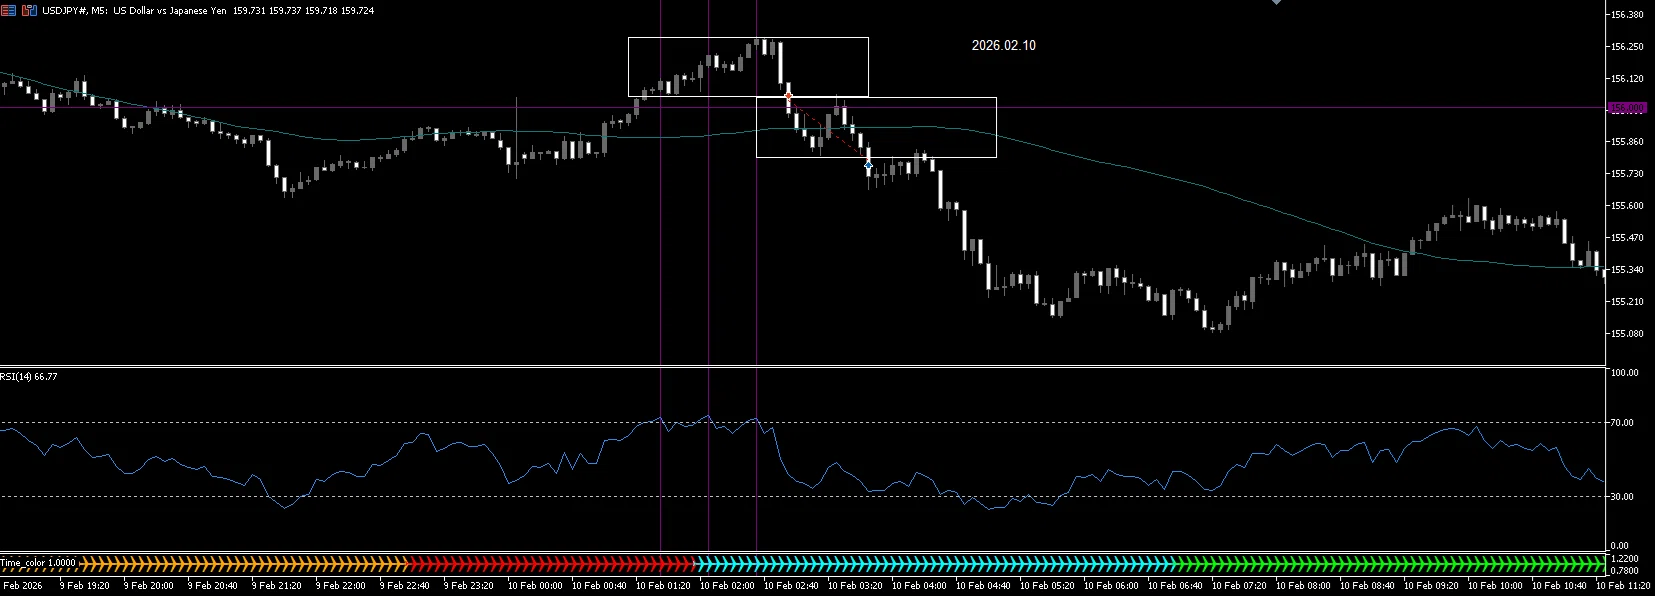
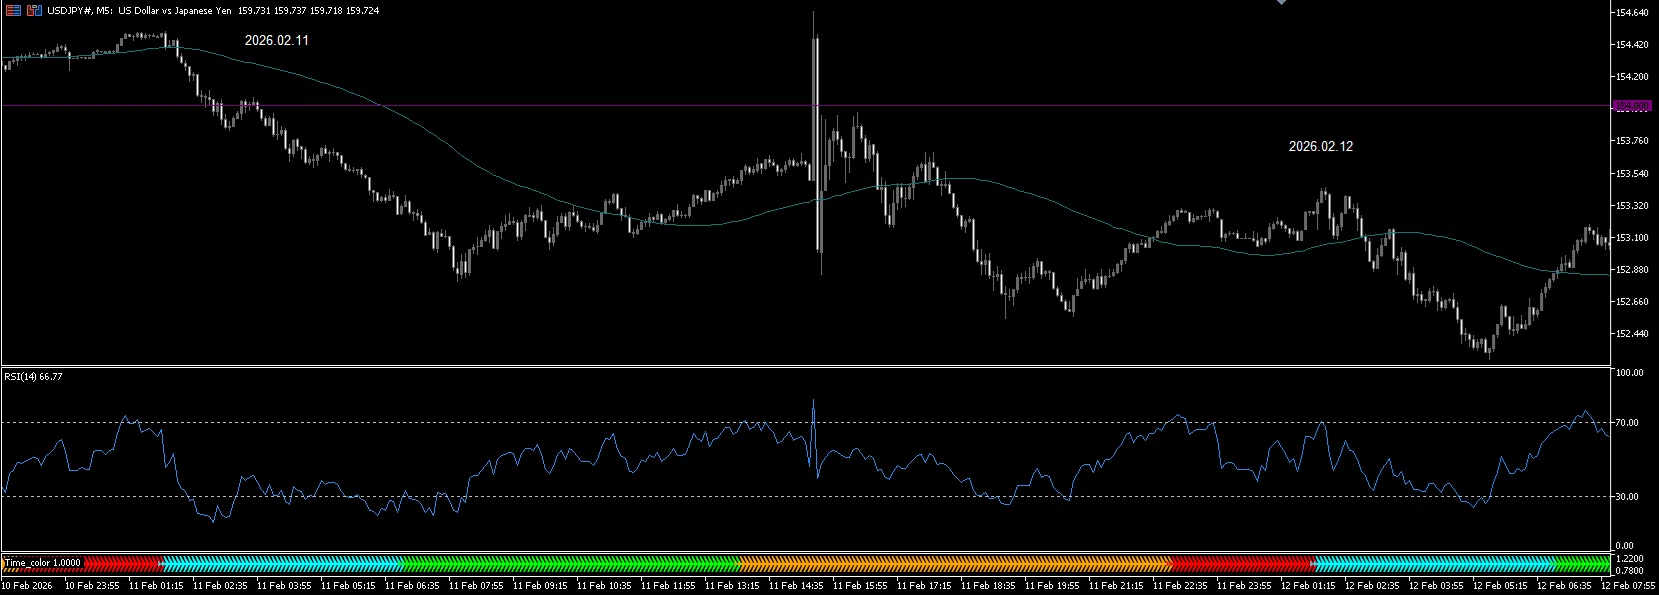
2026-02-10
The market time indicator colors are as follows,
5:00–6:59 (Tokyo time) is red,
7:00–14:00 is light blue.
I use divergences that occur at the moment the color changes from red to light blue.
On this day there were three consecutive higher highs.
(Clear price increase and sideways RSI contrast)
During this divergence period, I enclose the highs and lows with a box.
The period forming the divergence (highs to highs) is about 1–2 hours (12–24 bars).
Anything larger should be scaled differently.
If the box is broken, go with the trend. Breakouts after the Tokyo market opens are less likely to be false breakouts.
The box high (opposite direction of the breakout) serves as the stop loss, and the take profit is 1:1.
An estimated TP hit time is roughly the divergence formation period.
If the market spans across sessions, exit regardless of profit or loss.
2026-02-11, 12
No divergence occurred (watching)
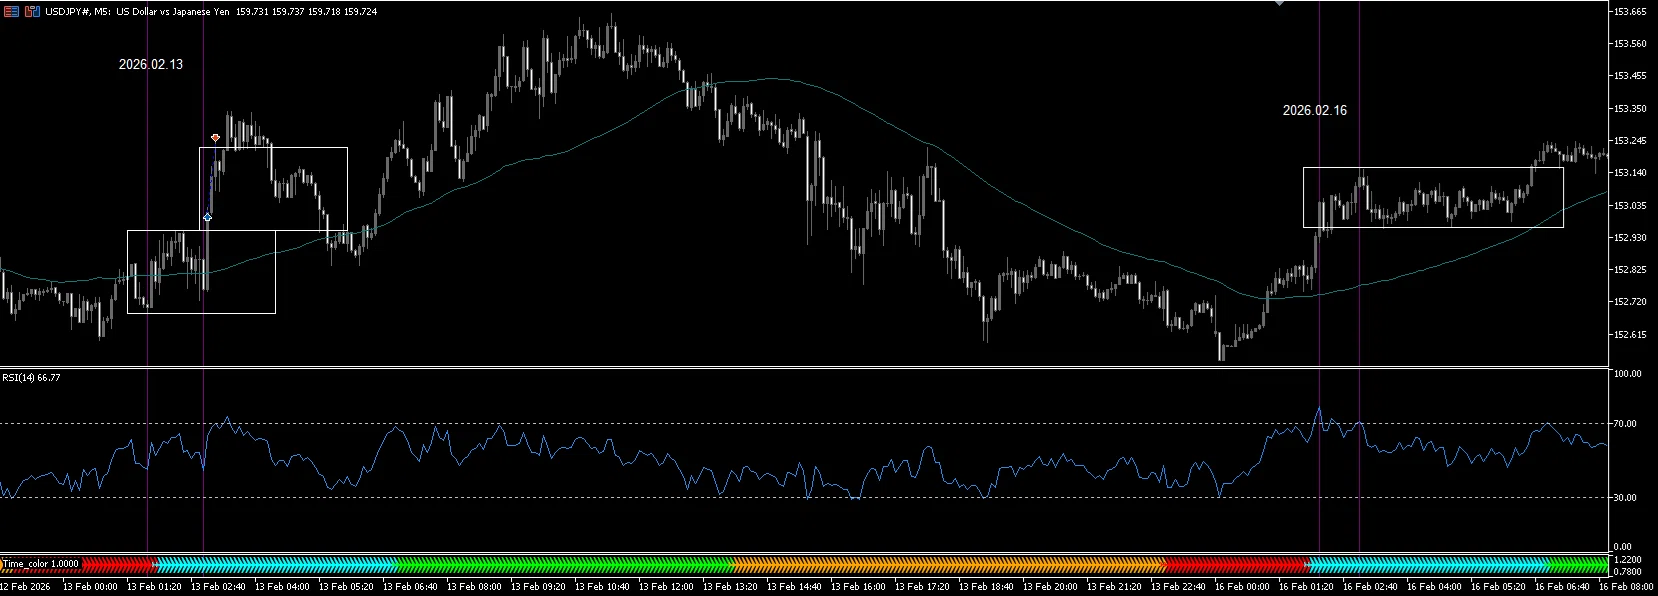
2026-02-13, 16
Divergence occurred.
On the 13th, the box was broken, so profit was taken.
On the 16th, I expected a break below the box, but the market changed without a breakout, so no position.
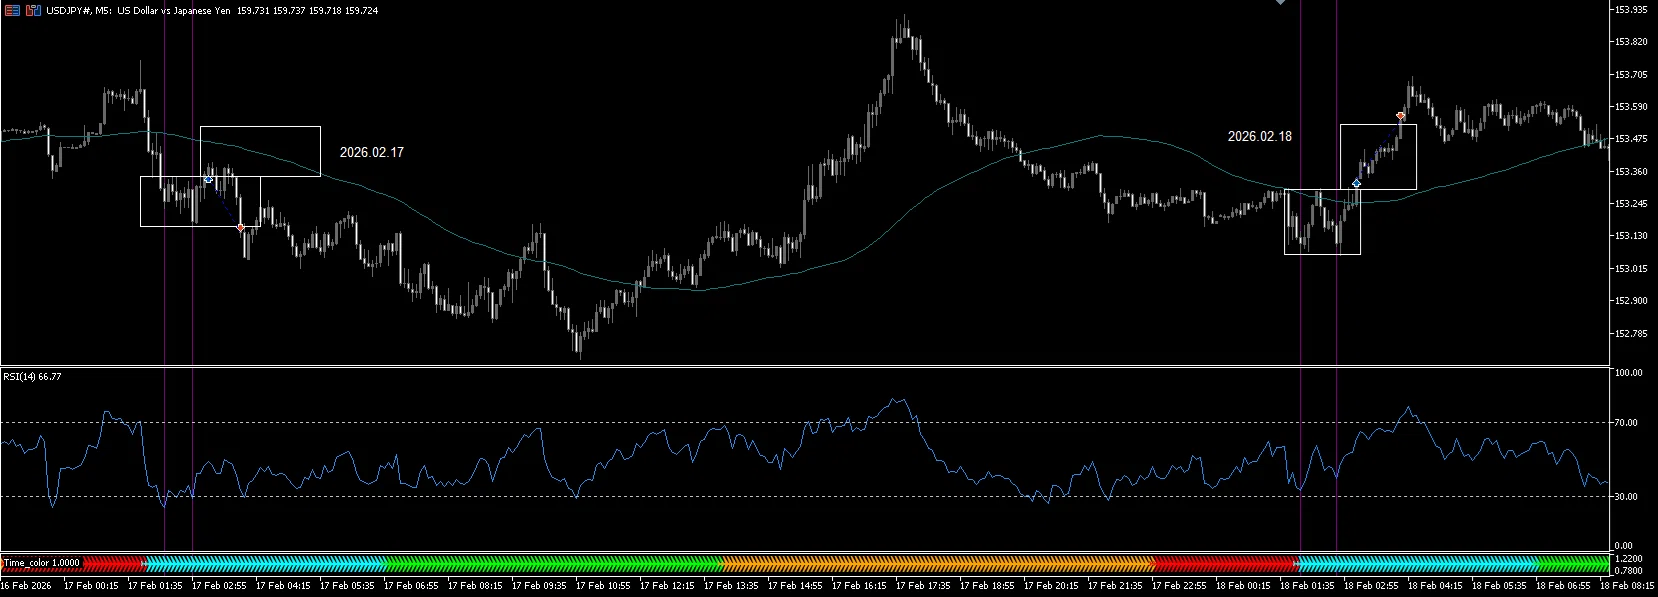
2026.02.17, 18
On the 17th, there was an upside breakout of the box, but it hit stop loss.
On the 18th, a clean W-bottom formed and the price extended straightforwardly.
Something like that, I suppose.
Divergence naturally tends to form patterns like double tops or triple tops, so the neck line becomes the box anchor.
That way, Dow theory also overlaps with it.
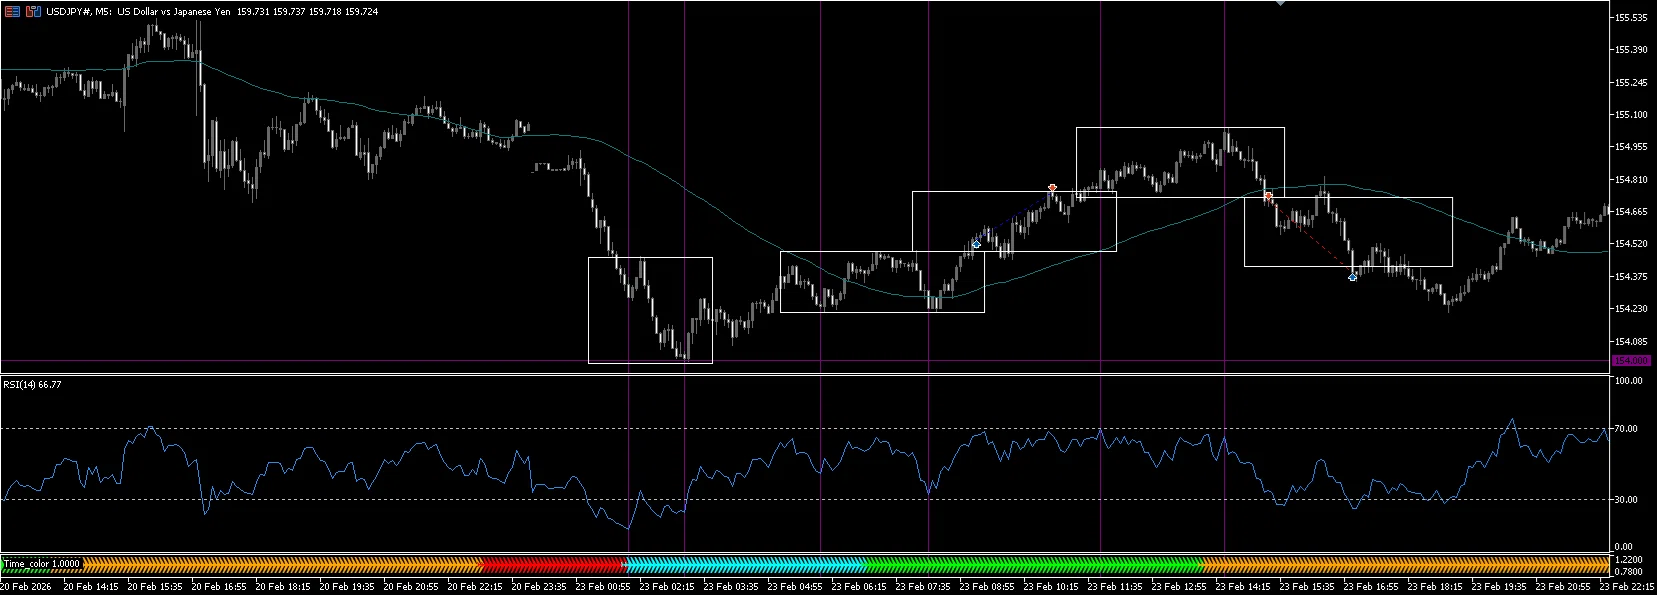
Divergence can be used outside of Tokyo hours as well.
Divergence tends to fit well at market time transitions.
Previous market afternoon: funds flowed in during the morning, causing price stagnation.
Next market morning: positions accumulate during pre-open hours
Next market open: a thick position with flow breaks the box (continuous rise)
Summary
That will be all for this time.
Look at market hours is something I only recently started consciously paying attention to.
In extreme terms, a trend reversal occurs when the players change.
Until the players change, holders hope the price continues in the assumed direction as much as possible.
When you become able to glean others' thinking like that, you should be able to breakthrough as a trader.
Thank you for reading to the end.