[Methods Used in the Past] ② Moving Average GC Method
Hello, this is 2pay!
This time, as the second installment of the past method series, we will cover the moving average GC (Golden Cross) method.
Let's move straight to the method explanation.
(For notes and key points across the method series, please refer to the first, ① Moving Average Deviation Method)
What you need
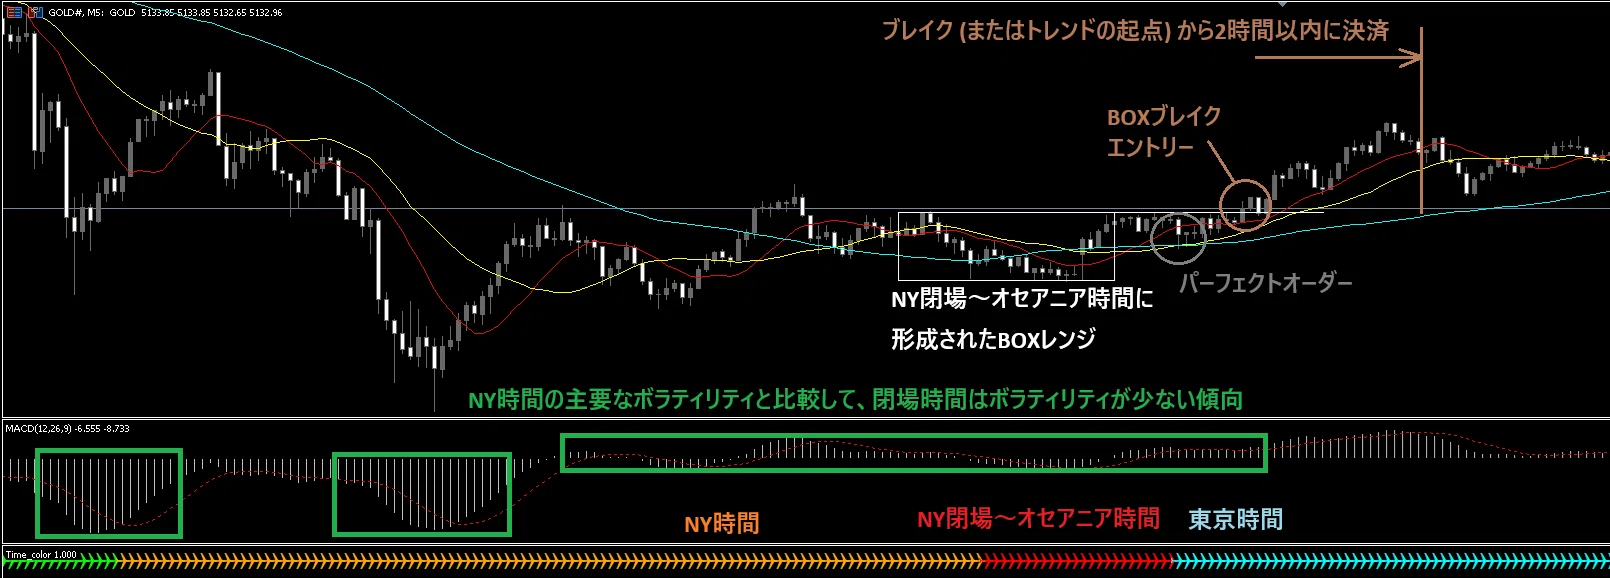
・SMA {periods: 13, 25, 75}
(EMA is also fine, and the periods can be changed without issue)
Any instrument is fine, but higher volatility is preferable.
At that time, it was practiced on the Nikkei 225 mini.
Nowadays, Gold might be the easiest to use.
BTC can no longer be won with brain-dead ease as in the past.
In FX, cross-yen pairs such as USDJPY tend to have relatively higher volatility.
(CHFJPY is an exception to avoid)
The scale is around M15, perhaps.
This is not strictly fixed.
However, considering background conditions (flow), if you aim for 1–2 hour trends, monitor M5–M15; if you aim for 3–10 hour trends, monitor M15–H1.
In FX, many trends disappear within 1–2 hours. (There are longer ones, but the main rise/fall that forms the trend occurs in a short time.)
Rules
In short, it is a trend-following setup with perfect order.
That is, if short-term MA > mid-term MA > long-term MA in order, it is Buy Sicht,
If short-term MA < mid-term MA < long-term MA in order, it is Sell Sicht.
The term "sight" is used because, by itself, it is not sufficient as an entry condition based on experience.
Reasons to use Perfect Order are as follows.
① To confirm price convergence (charge phase before the trend)
② To confirm consensus between short-term and long-term perspectives
Please firmly grasp these two points.
Discretionary judgment does not function if the premise collapses.
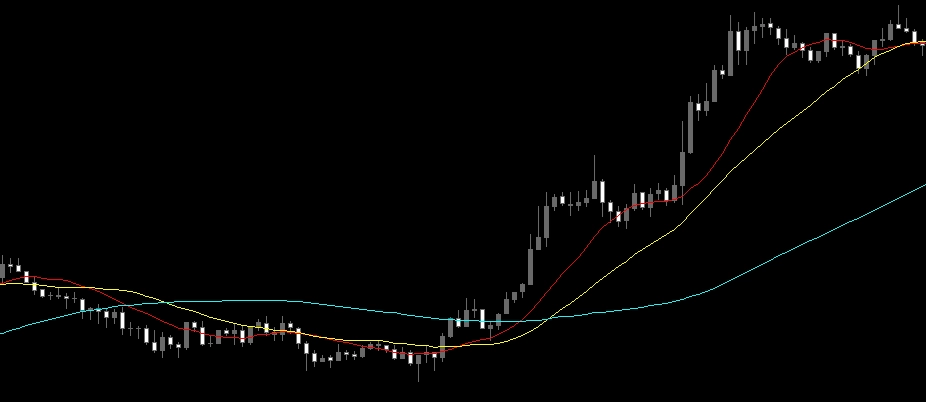
Although we look at Perfect Order, the most important is the long-term MA.
With the long-term MA viewpoint not wavering, we overlay short-term and mid-term MAs as auxiliary indicators.
The details of the long-term MA are summarized in the figure below, but when a trend starts from low volatility, the following flow typically occurs.
With this in mind, display the three MAs.
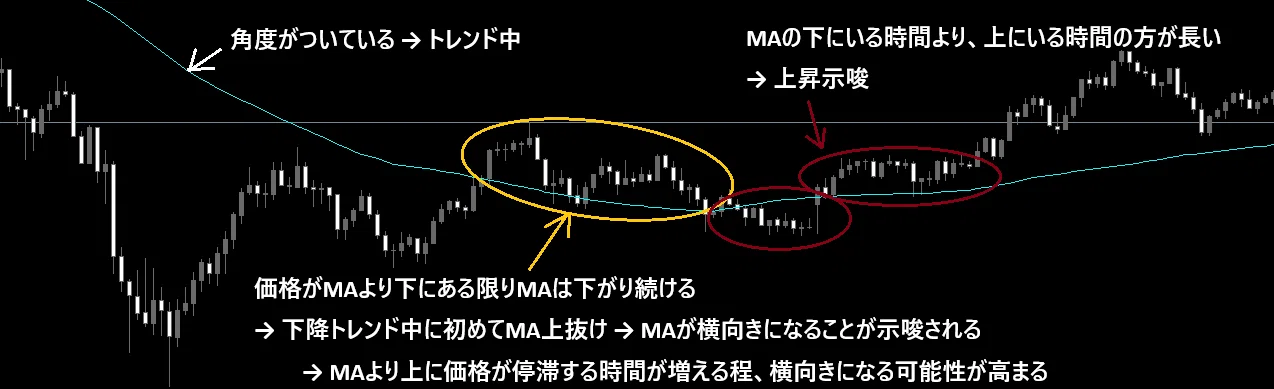
This method was originally taught by a senior, and in the original version, entry occurs as soon as Perfect Order is achieved.
I added a slight modification, enclosing the MA convergence range in a box and adding the condition to enter in the direction of a break of the BOX.
To reiterate, the purpose of using MA is to confirm price convergence and consensus between the short and long term.
If you can determine that from price alone, you don’t need to use MA.
Filter
As with the previous method (MA deviation), you must select where entry is possible. Entering indiscriminately on all signals will not yield consistent wins.
Useful entry filters for this method are as follows:
① Recent volatility
② Entry timing
Proceed with ①.
Although I don’t like using too many indicators, for visual clarity I will use MACD.
MACD is an indicator that expresses the distance between two EMAs as a histogram.
In other words, when the histogram is small, the distance between the MAs is narrowing, and if this state persists, the price will stagnate within a fixed range and volatility will contract.
MACD is based on EMA12 and EMA26, so displaying MA of the same type and period makes the numbers match perfectly. (It might be easier to use if they match)
There is no upper or lower limit for MACD, so compare relative to the most recent histogram size to gauge large vs small.
In this strategy, since we want to capture MA convergence, the ideal condition is when the histogram contracts to half or less of the previous state.
Next, filter ②, which basically means judging by market hours.
Think about when price convergence satisfying ① will occur. There is not a single answer, but a frequently occurring window is from NY close to the next day’s Australasia time (before Tokyo opens).
If you know of other times, you may use them. As a convention, these times allow some volatility forecasting.
Typically, before a trend starts (= price moves significantly), a low-volatility range forms. The lower the volatility, the more energy is compressed, and under some trigger the energy disperses.
In other words, we were observing the convergence of volatility via MA and MACD as a signal for trend onset.
And as an example of the points where “price convergence is likely” and “price divergence is likely” occur sequentially, focus on the FX and commodity rollovers, NY close to Australasia time, then Tokyo market opening (Tokyo time), where price movements diverge (breakout) to profit.
Other tips
For settlement, you can use TP, trailing stop, time-based exit, indicators, anything you like. The key is not to hold too long.
Breakouts in Tokyo morning sessions typically last about 2 hours. If you don’t exit in the morning, the flow changes.
SL is generally the box low/high on the opposite side of the breakout.
Before entry, I checked price and MA sequences to confirm price agreement.
If the price breaks in the opposite direction of the box, that means price agreement has been negated. Price agreement is not just a mental or emotional matter, but evidence of actual capital deployment by investors.
And when direction is indicated by Perfect Order or similar, the broader market moves with that direction.
If that is negated and price reverses, investors who have positions will flee at once. When price rebounds, the market overreacts and reversals amplify.
Therefore you must cut losses early before the losses widen.
A strategy that clearly chases a trend like Perfect Order can be risky when the market turns, so you should exit early to avoid being caught in a reversal.
Conclusion
That’s all for this content.
This method is in the low-frequency category. It’s not something you can do every day.
Trading after NY’s subsequent session and after the close tends to be less volatile and allows smaller stop-loss widths, so it is recommended.
I introduced the previous MA deviation method as well, which is also achievable in Tokyo time.
Some may wonder whether introducing reversal and trend-following methods in the same market hours would interfere, but if you break the time into more granular segments, you’ll see they don’t interfere. Read the text carefully to understand why.
Thank you for reading till the end.