

[Past methods used] ① Moving average deviation
Hello, this is 2pay!
As a series, I would like to introduce the methods that have been used in the past.
There is no deep meaning in the numbering; basically it follows a chronological order (the order in which they were used).
Since these are methods that are no longer in use, I will publish them without reservation.
It has been several years since I started earning consistently, and while running a proven logic, I continually search for new methods.
I stock multiple logics in case the ones I use become unusable.
After going through discretionary trading and system trading, I am now a quants trader in the making.
I have no intention of returning to discretion at this point, so it is fine to release all of my discretionary methods.
Notes on the Method Series
Since this is the first installment, I will explain the common notes for the method publication series.
// ---
・The methods introduced include both usable and unusable ones.
・Whether something is usable or not is based on my subjective judgment; even if I consider something unusable for me, it may be usable for someone else.
・Especially early on, some methods were used before I had the skills, so it’s possible I simply couldn’t handle them.
・Besides usable/unusable, there are axes like can it be reproduced? and does it fit your temperament? If you think it doesn’t suit you, avoid it; if you think it fits, use it.
// ---
Explanation of the Method
Now I will move on to an explanation of the method.
This time, we will cover the “Moving Average Deviation Method.”
In simple terms,
it is a strategy that targets the range to return to the mean after a deviation from the moving average (MA).
.
(From a quantitative perspective, this is not called a true mean-reversion strategy, and therefore I will not use the term risk premium)
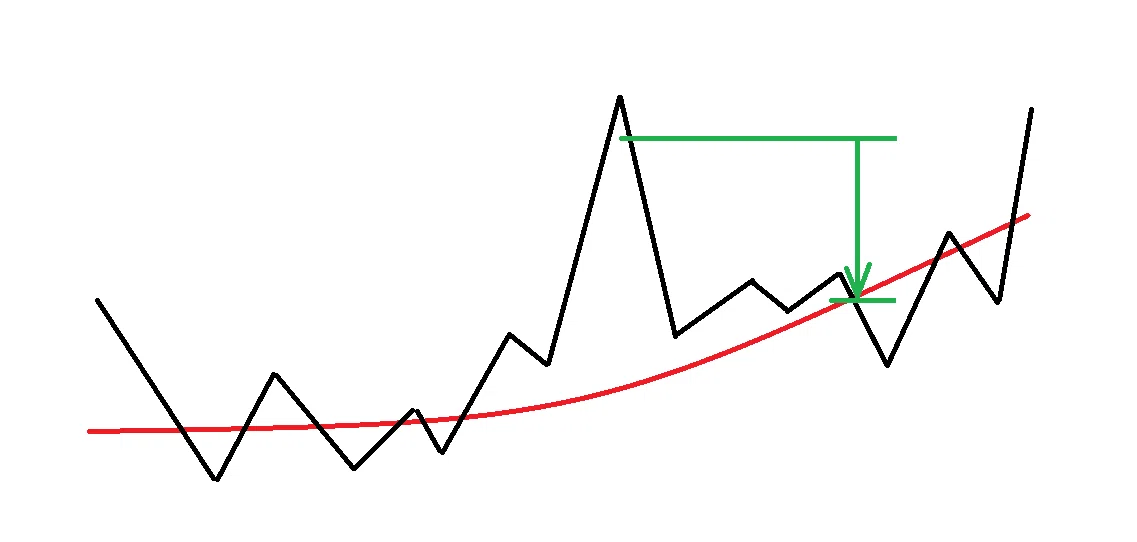
This method uses SMA75 and MACD12,26,9.
During Tokyo market hours, monitor prices that deviate significantly from SMA75; enter when MACD experiences a golden cross / dead cross, and exit when the price returns to SMA75.
You may choose to exit when the price reaches SMA, or wait for a candle to close; however, it is safer to exit as soon as it reaches the level.
A crucial note: do not fixation on the indicator values (period parameters).
The above values were simply chosen because they were convenient defaults.
Feel free to adjust to suit scale or assets.
There are no particularly special numbers. Focusing on the period is only for losing traders.
Let’s look at GOLD M5 as an example.
It might be hard to see, but these are the results for the last 6 business days of writing (2026-03-04 to 03-11). Coincidentally, all were wins.
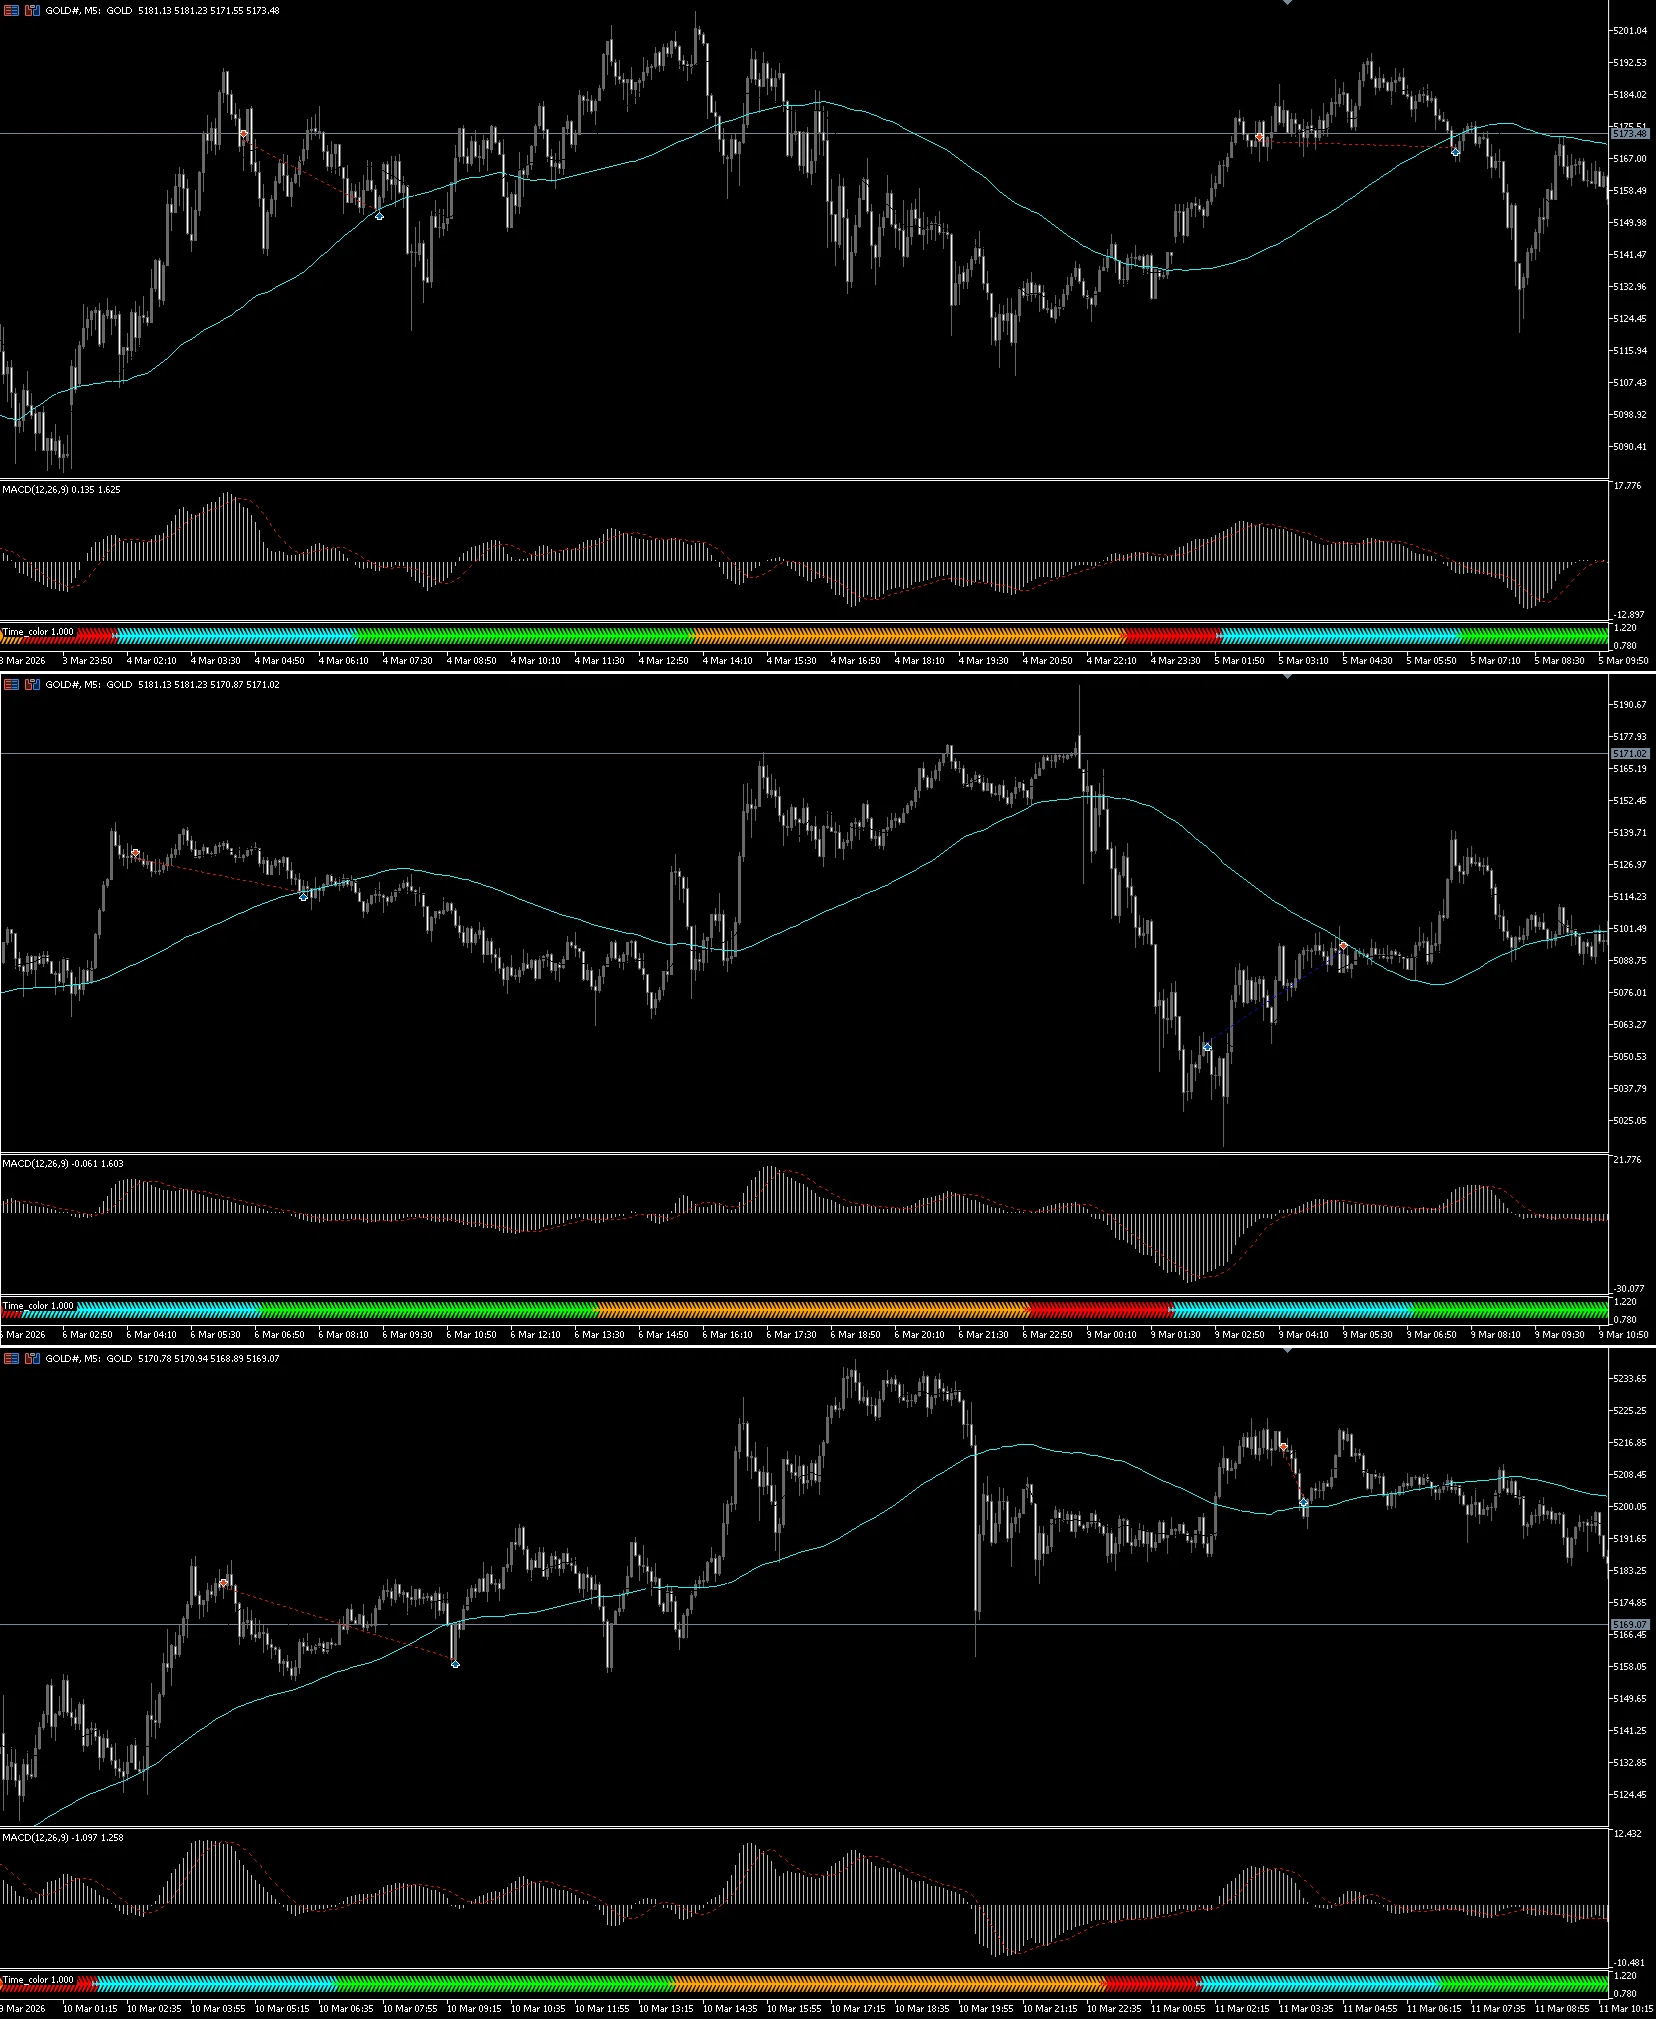
I have also added a supplementary indicator that color-codes market times.
In Tokyo time it is light blue, and if there is a MACD GC/DC at that time, I enter.
I don’t enter for small deviations. By looking at the magnitude of the MACD histogram before the previous day, if a histrogram of similar size appears, the price movement is easier to capture.
Also, the basic approach is to trade once per day, 0-1 times. Do not chase multiple entries.
Especially when there is a large deviation in the same direction, you may ride a trend reversal.
This method is more effective in ranging markets.
We filter out things that are likely to cause trend development, such as avoiding the beginning and end of the month, avoiding economic indicators, and avoiding times that tend to form trends.
That is why Tokyo time is specified.
It’s better to avoid Japanese indicators as well.
In Closing
That concludes this content for now.
The series will proceed with this kind of tone.
Thank you for reading all the way to the end.