

[5/15] "Those who can wait remain in the market."
In a plunging market, aren’t you tempted to go counter to the trend?
I also once saw RSI being oversold and thought, “It’s already fallen enough,” and jumped in.
Today I’ve整理 the reasons to curb that impulse.
Today's Market Situation
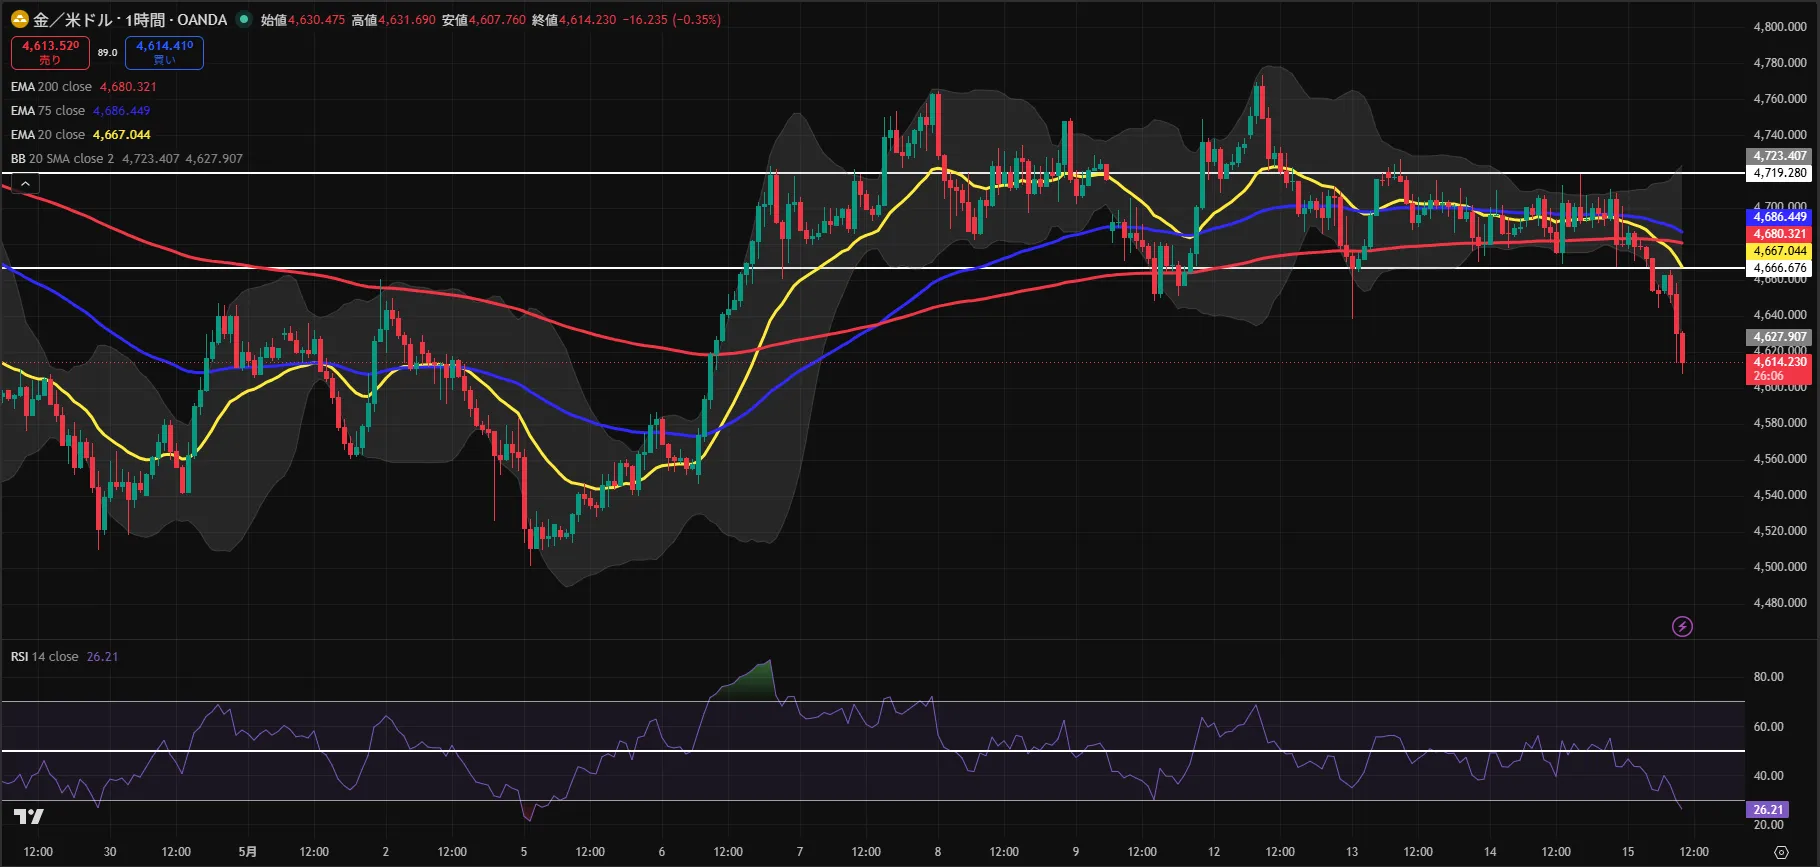
Today’s GOLD is at a current price of $4,618.500. The decline continues from yesterday, clearly piercing below the previous day’s low of $4,666.676. The 1-hour RSI (Relative Strength Index, indicating overbought/oversold) is 26.21, dipping below the oversold threshold of 30. The RSI itself has fallen sharply from 40.10 three hours ago to 26.21, continuing a downward trend.
EMA20 (short-term moving average) is 4680.321, EMA75 (medium-term moving average) is 4686.449, with the short-term below the medium-term. Meanwhile, EMA200 (long-term moving average) is 4667.044, located below EMA20. This indicates the EMA array is in a state of breakdown.
In short, it’s attempting a downward reversal, but the arrangement is not fully aligned yet—an indecisive phase.
GoGoTaro’s View
This article reflects personal analysis and does not constitute investment advice or solicitation. Please make trading decisions at your own risk.
Today my decision is to stay on the sidelines. The reason is simple: the 1H EMA is in a “breaking down” shape. EMA20 is below 75 while EMA200 is still below 20. This arrangement cannot be used as a basis for an entry according to the rules.
If in the future EMA20 falls below both EMA75 and EMA200 to complete a downtrend (20 < 75 < 200) and RSI moves below 50, I would consider selling as a retracement. The target line to watch would be around $4,680.
On the other hand, if RSI rebounds and price stabilizes in the $4,650–$4,670 area, a pullback-buy scenario near 1H EMA200 ($4,667) could be considered. However, in the current state where the array is breaking down to the downside, this has low priority.
Today's Reference Lines
Today there are no points meeting RR1.5, so no entry. The following are for reference.
▼ Long (buying on a dip) — for reference only as part of a monitoring view
Reference zone: $4,662–$4,672 (basis: 1H EMA200)
Reference take-profit line: $4,715 (around the previous day’s high)
Reference stop-loss line: $4,645 (20 points below the previous day’s low; key level)
Expected RR: 2.18
*These are educational reference values. Actual trading decisions are yours to make.
Regarding the retracement selling reference zone ($4,675–$4,685), the profit target is too close to the previous day’s low of $4,670, yielding an RR of only about 0.4. It is not at the level suitable for inclusion as a reference line, so it is omitted.
Important Lines
With the current price at $4,618.500, all major lines are positioned above it.
Resistance 1: $4,667 (basis: near 1H EMA20 and the previous day’s low)
Resistance 2: $4,680 (basis: 1H EMA20)
Resistance 3: $4,686 (basis: 1H EMA75)
Resistance 4: $4,720 (basis: previous day’s high)
1H EMA200: $4,667 (above the current price; clearing this line would indicate accelerated upside potential)
There is no clear supporting line below the current price, so we will not include one today.
A Word for Today
“Those who can choose to wait with evidence-based restraint rather than entering without justification will be the last ones standing.”
This article is personal analysis and does not constitute investment advice or solicitation. Please make trading decisions at your own risk.
If you found it helpful, a follow would be appreciated.
Feel free to leave questions or comments with your thoughts.