
Episode 4: What is price movement? "The price goes to look for ●●"
Chapter 4:
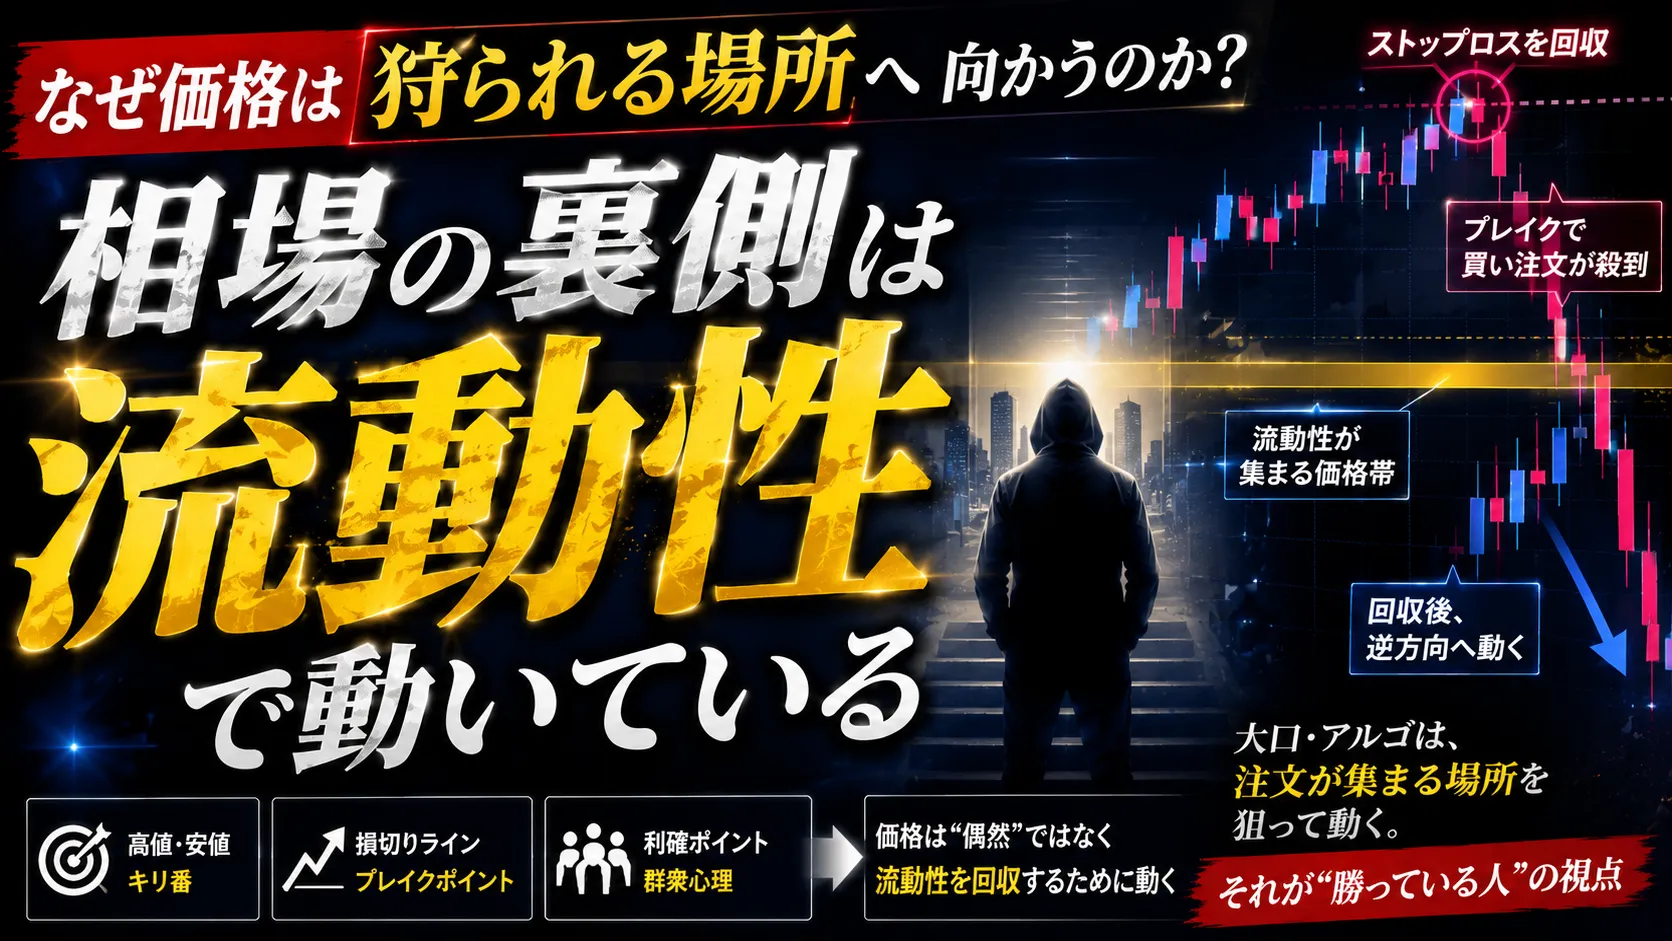
“A Place Where Prices Are Drawn In” Exists
Why does the market move toward a certain price range?
What you can’t see from win rate alone
A discussion of the “essence of the market”
In the previous article,
- Reasons you can have a high win rate but still not win
- That what’s truly important is the “exit strategy”
- Those who leave with profits pay attention to “where to exit”
explained.
And this time, we’ll go even deeper.
That is,
the theme of
“Why does the price move toward a certain place?”
This isn’t merely a technical discussion.
Rather,
a discussion close to the essence of “why the market moves.”
Many people look at charts.
But there is something truly worth looking at besides that.
General traders look at
- Candlesticks
- Signs
- Indicators
- Patterns
- High/Low prices
of course,
that in itself isn’t wrong.
However,
if you only look at those things, you’ll miss something important.
That is,
the perspective of “Why did the price move to that place?”
is essential.
■ Prices do not move randomly
When you’re just starting in the market,
the chart looks random.
Up or down.
It seems unpredictable.
However,
if you look for a long time,
you’ll notice a certain unease.
There are times when only similar places
respond.
For example,
- Near the previous high
- Starting point before a sharp rise
- Large wicks
- Prices that have stretched too far
- Places where it paused once
In such places,
the market reacts many times.
Is this just a coincidence?
■ Prices are pulled by “orders”
What matters here is not the price itself, but
the “orders”
.
In the market there are always
- Take-profit orders
- Stop-loss orders
- New orders
- Break orders
- Algorithm orders
present.
And prices tend to move toward places where these accumulate.
In other words,
Prices are about
“going to look for orders”
by nature.
■ The concept of “Liquidity”
This is where a very important keyword comes in.
It is
“Liquidity”
.
It may sound difficult, but
simply put, it is
“where orders are concentrated”
.
For example, where many people
“seem likely to take profit”
there will be a large number of take-profit orders lined up.
Conversely,
places where it’s believed that a stop will be hit if broken
will have a large amount of stop orders.
In short,
the market has
“price ranges where orders tend to accumulate”
exist.
And prices move as if drawn toward them.
■ Why are there sudden trending markets?
Understanding this helps explain a certain question.
Why,
despite similar charts,
some days trend unusually strongly?
This is
the result of a bias in orders
being involved.
For example,
the moment you surpass a certain price range,
- Stop-loss
- Break-entry
- Algorithmic reactions
occur all at once.
Then,
the price accelerates.
In other words,
when the market suddenly extends,
it’s not just “more buyers”;
including opposite trades
“orders chain together”
in many cases.
So there are things more important than lines, but
Here is a common trap many fall into.
That is, making drawing lines the goal.
For example,
a support line.
a resistance line.
a trend line.
a horizontal line.
Of course, they’re important.
but
what you really should look at is
“what exists around there.”
That is to say,
- Why does it react easily?
- What orders are accumulating there?
- Who is watching that area?
This is the key.
■ Meaning exists in price ranges
The stronger traders do not look at single points.
They don’t think, “This exact line will cause a reversal.”
Instead, they look at
“price ranges.”
Because what’s truly important is not the line itself, but
“the liquidity surrounding it.”
Therefore.
For example, as you approach a price range,
- volatility increases
- wicks increase
- volume increases
- a sudden slowdown occurs
- accelerates rapidly
these phenomena occur.
In other words,
prices are not just “reacting”;
it’s the orders that are reacting.
In fact, many people decide the exit by feel
This connects to the previous discussion.
Many traders spend time on entries.
But
exits are astonishingly vague.
- Because it feels like a clean cutoff
- Because it has stretched a little
- Because it feels uneasy
- Because it’s pulled back
In this way,
they bail out of a move that would have continued.
Why does that happen?
The answer is simple.
Because they cannot see
“how far is it likely to reach?”
It’s not “predicting the future,” but “ease of reaching.”
Misunderstanding this makes trading harder.
The market is not a game of 100% accuracy on entry points or the future thereafter.
What’s truly important is
What’s truly important is
“which price range is easy to move toward”
.
In other words,
not just “will it go up or down”
but also
- how far it tends to extend
- where it reacts readily
- where it tends to slow down
must be considered.
■ Here you can see a commonality
Actually,
the traders who have been consistently successful tend to share a common trait.
That is, they look at places where prices tend to cluster.
And interestingly,
this isn’t just a feeling.
There is a certain structure in place.
- Wave size
- Probability of reaching
- Market structure
- Liquidity
- Propensity to extend
There are, in fact, common features among these.
And,
understanding them transforms exit strategies from feeling-based to highly logical.
Returning to the initial theme now.
Why,
do identical entries yield different results?
The same entry.
The same direction.
The same-type chart.
Yet,
the results differ greatly.
This is because the judgment of “how far to push it” differs.
In other words, the real difference lies not at entry but at the exit.
And,
there is actually a certain rule at that exit.
■ Understanding the places where prices are drawn in changes your perspective
Until now, you may have been taking profits at places you felt were fine.
You may have seen reversals at places you felt were fine.
In fact, there is a common “structure” at those places.
And,
once you understand that structure,
- unnecessary early profit-taking
- unnecessary protective pulls
- inability to extend profits
begin to change dramatically.
■ Final episode preview
Now,
what is that “structure where price tends to cluster”?
Why are many pros and algorithms conscious of a certain ratio?
In the final episode,
we will finally delve into the core.
The exit that was once intuitive for profits will
transform into a “logical exit strategy.”
This is the moment profits become a logical outcome.