

[Tri-Currency Parity Analysis] GOLD 15-Minute Chart - Practical Example公開 | 介入余波PRO x TEPPAN
Looking at XAUUSD M15
S1 Rebound, Z=0 Reversion, and TEPPAN AB=CD Follow-through Long
In this piece, we will explain a chart example where the long signal from Intervention Aftereffects PRO Catcher displayed on XAUUSD M15 overlaps with the occurrence of TEPPAN’s AB=CD pattern.
The focal point is that after the signal triggered, the price reversed around slightly before reaching the SL, rebounded near the S1 pivot line, and moved upward toward the Z=0 direction. Subsequently, TEPPAN’s AB=CD pattern emerged, triggering a follow-through long signal. Currently, price is hovering near the R1 pivot line.
A moment when the “distortion” of the three-currency parity and TEPPAN’s “price pattern” pointed in the same direction
In typical chart analysis, decisions are made mainly from candlesticks for XAUUSD, pivots, horizontal lines, and price patterns.
On the other hand, Intervention Aftereffects PRO Catcher observes distortions in a triad, such as XAUUSD, USDJPY, and XAUJPY, using Z-scores. In other words, it looks not only at whether prices rise or fall, but also whether, from the perspective of the three-currency relationship, the movement represents a mean reversion or an expansion.
In this chart, after Catcher showed a mean-reversion toward Z=0, TEPPAN also fired a follow-through long via the AB=CD pattern. Because the distortion mean-reversion and price-pattern uptrend signals aligned, this appears on the display as a very strong upward signal.
1. XAUUSD M15 | S1 Rebound and Rise toward Z=0 direction seen with Catcher alone
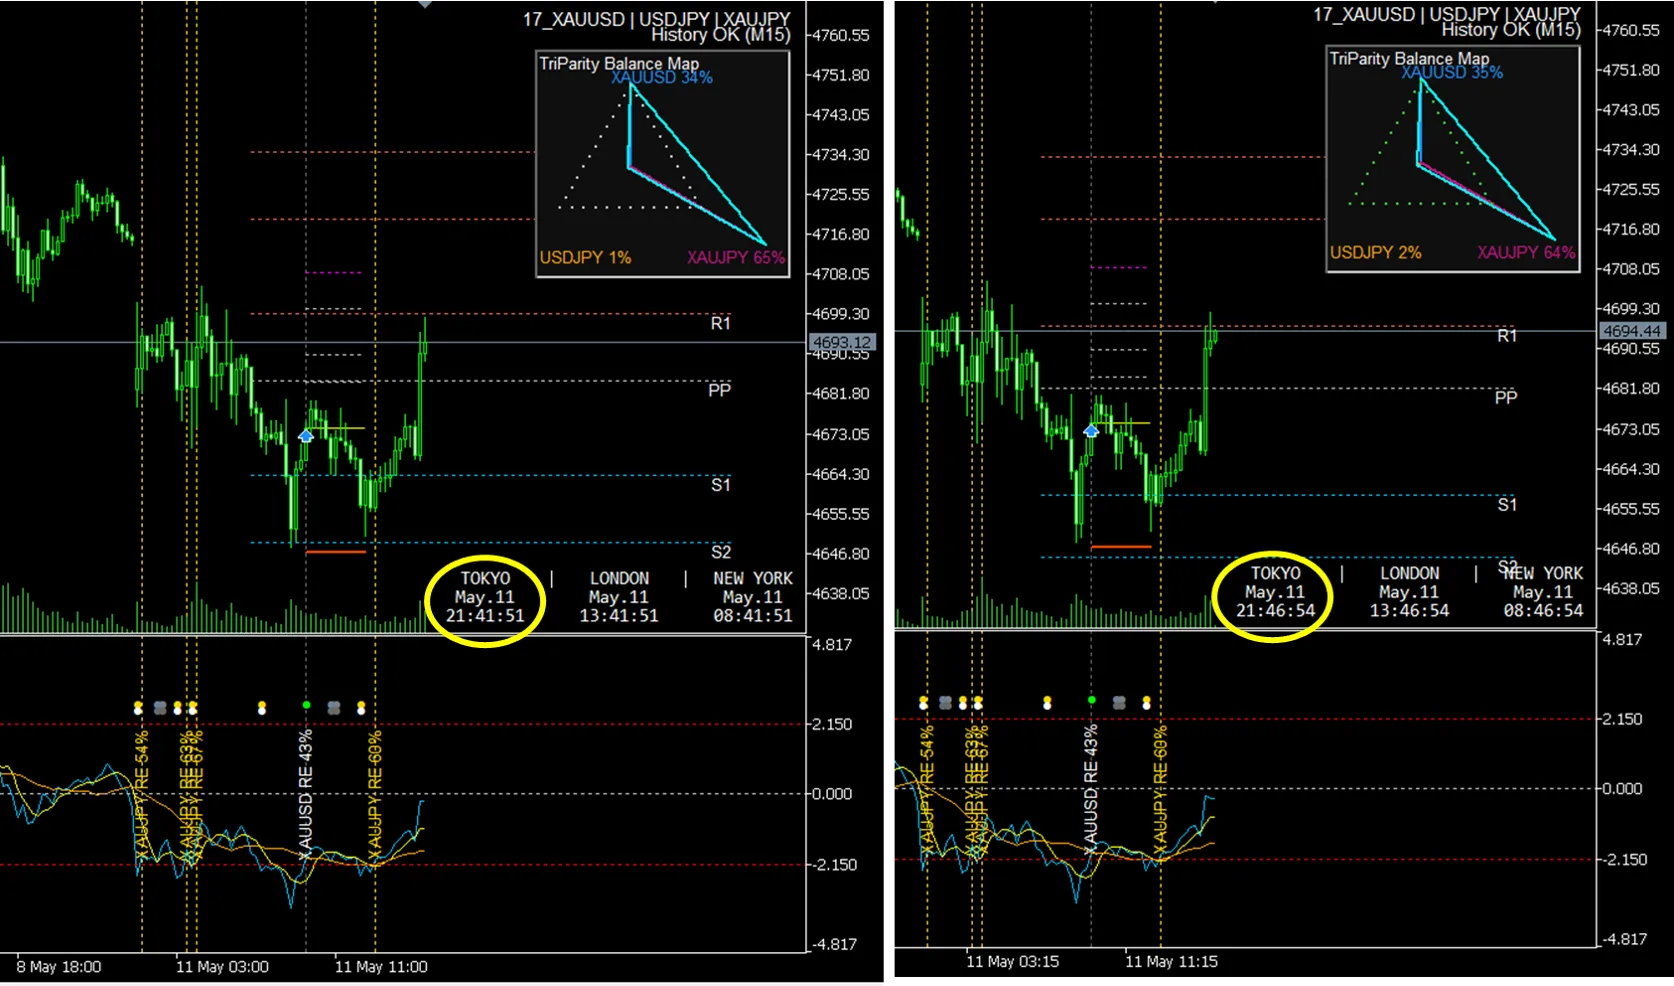 After the signal, price reversed near S1 just before hitting SL and rose toward the Z=0 direction. It is currently hovering near R1.
What can be seen in Image 1
In Image 1, XAUUSD M15 shows Catcher’s LONG signal. After the signal, the price dipped once, but reversed near the S1 pivot line before reaching SL, and then rose toward the Z=0 direction, moving up toward near R1 on the right side of the chart. This illustrates an instance where the distortions in the three-currency relationship did not keep expanding in one direction but temporarily moved back toward the mean. However, this does not mean that “it always rebounds at S1” or “always reaches R1.” This display is an illustration to observe where distortions begin to revert by combining Catcher signals, the Z-score, pivots, and the Balance Map.
Points to look at in Image 1
How Z=0 Target Line and Target 1–3 are considered
In Catcher, as time passes, the “price at which Z=0 occurs” may change. Z-scores are computed from distortions in the three-currency relationships, so theoretical Z=0 prices may move due to nearby pairs’ price changes. However, in actual chart trading, there are times when you want to confirm RR at entry. Therefore, Catcher computes the theoretical Z=0 price at entry and draws a horizontal line as a target line, split into three parts: Target1, Target2, and Target3. In the image, you can observe the distance from entry to the Z=0 direction as a staged objective.
How to read the lines in the image
2. Use the TriParity Balance Map in the top-right to see “who is creating the distortions”
If the Z-score shows the magnitude of distortion, the Balance Map is a helper panel to see which pair is driving that distortion.
In this top-right panel, the triad is shown asXAUUSD / USDJPY / XAUJPYand the Balance Map indicates roughlyXAUJPY 64%, XAUUSD 35%, USDJPY 2%as the contribution balance.
This does not mean that “XAUJPY has a 64% win rate.” It means that in the most recent distortions among the three currencies, XAUJPY contributed the most.
In other words, even if the main chart is XAUUSD, there are moments when XAUJPY is the largest contributor to the distortion on Balance Map. In such cases, rather than focusing solely on XAUUSD, you can switch to the XAUJPY chart to observe if there is a trading opportunity there.
Meaning of the white and yellow vertical lines
This design makes it easier to visually determine not only the signal itself but also which pair to monitor next.
3. Image attachment|TEPPAN AB=CD pattern occurrence triggers a follow-through long
In the next image, in addition to Catcher’s Z=0 directional mean reversion, TEPPAN shows AB=CD, triggering a follow-through long signal. This is a very strong upward signal where the distortion mean-reversion and price-pattern upward signal coincide.
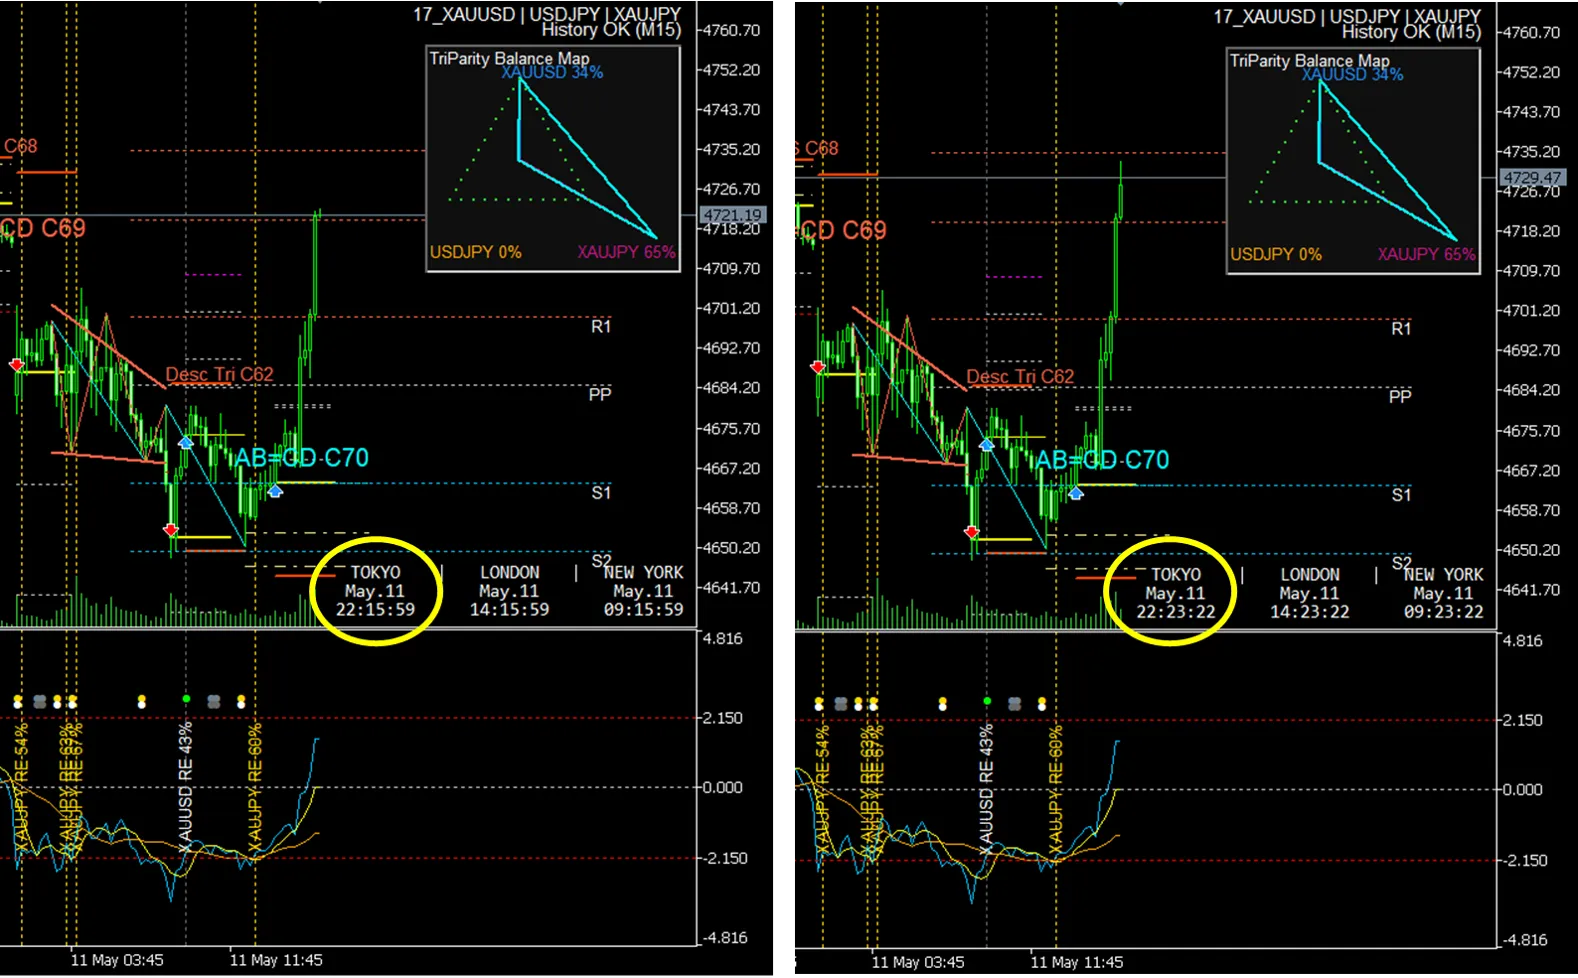 After AB=CD pattern occurs on TEPPAN, a follow-through long signal is fired. This provides further justification for the rise in response to the S1 rebound.
Reasons why Image 2 looks strong
TEPPAN AB=CD reinforces price structure
AB=CD is a representative harmonic price pattern that looks at the balance between impulse and corrective waves. TEPPAN visualizes this pattern on the chart to help determine whether the market is structurally primed for upward movement, not just moving higher.
In Image 2, after a S1 rebound and rise toward Z=0 on the Catcher side, TEPPAN displays AB=CD, and a follow-through long fires. This is a scenario where the reversal path from the three-currency parity analysis aligns with the price-pattern evidence.
Thus, this moment can be categorized as a highly strong upward signal composed of multiple elements in the same direction: Catcher’s distortion mean-reversion + TEPPAN AB=CD + follow-through long + upward movement toward R1.
Summary of this scenario
Roles of Catcher and TEPPAN
Look at the bases that align in the same direction, not just the signal
What matters in this image is not simply that there is a long signal for XAUUSD. After the signal, observe where price pauses, where it returns, and which pivot region it is near now, in conjunction with Z=0 targets and pivot lines.
Furthermore, by looking at the TriParity Balance Map on the top right, you can determine whether distortions are currently led by XAUUSD or by XAUJPY. When the yellow vertical line appears, it becomes practical to switch the main chart to XAUJPY to observe trading opportunities on the leading pair.
And in this additional image, TEPPAN AB=CD pattern occurrence has produced a follow-through long signal. The alignment of distortion mean-reversion in the three-currency parity analysis with the upward structure from price-pattern analysis creates a very strong upward signal.
Related Products
Intervention Aftereffects PRO Catcher, Scanner, LiveGAP
Tools to observe and visualize three-currency parity analyses on MT5. Catcher provides Z-scores, Nowcast, signal displays, Balance Map, and more to view currency distortions on the chart.
View Intervention Aftereffects PRO product pageTEPPAN
TEPPAN is a series of indicators that help discover price patterns, compare candidates, visualize on charts, and assist final judgments. By confirming AB=CD patterns on the chart and using them with Intervention Aftereffects PRO, you can verify the market from both shape and distortion perspectives.
View TEPPAN product pageThree-Currency Parity Analysis Master Course
A教材 to go beyond simply viewing signals in Intervention Aftereffects PRO, understanding the essence of three-currency parity analysis, observation methods, and how to record and verify results.
View Master Course product pageThis article aims to share indicator display samples and chart observations and does not constitute investment advice or buy/sell recommendations.
The signals, target lines, pivot lines, Balance Map, and TEPPAN AB=CD displays shown do not guarantee future price movements, profits, win rates, or any specific trading outcomes.
Actual trading decisions should be made at your own risk with proper risk management.