

Use of "Visualization Indicator" (Part 250)
「Visualization Indicator」 utilization(its250)
1. 「28currency pair list indicator」 to be further evolved into an indicator
「8CPVisualization Indicator」でAUDCADを描く
「8CPVisualization Indicator」にはOceania版、London版、NewYork版、AnyCP版があります。今回はNewYork版を使いました。
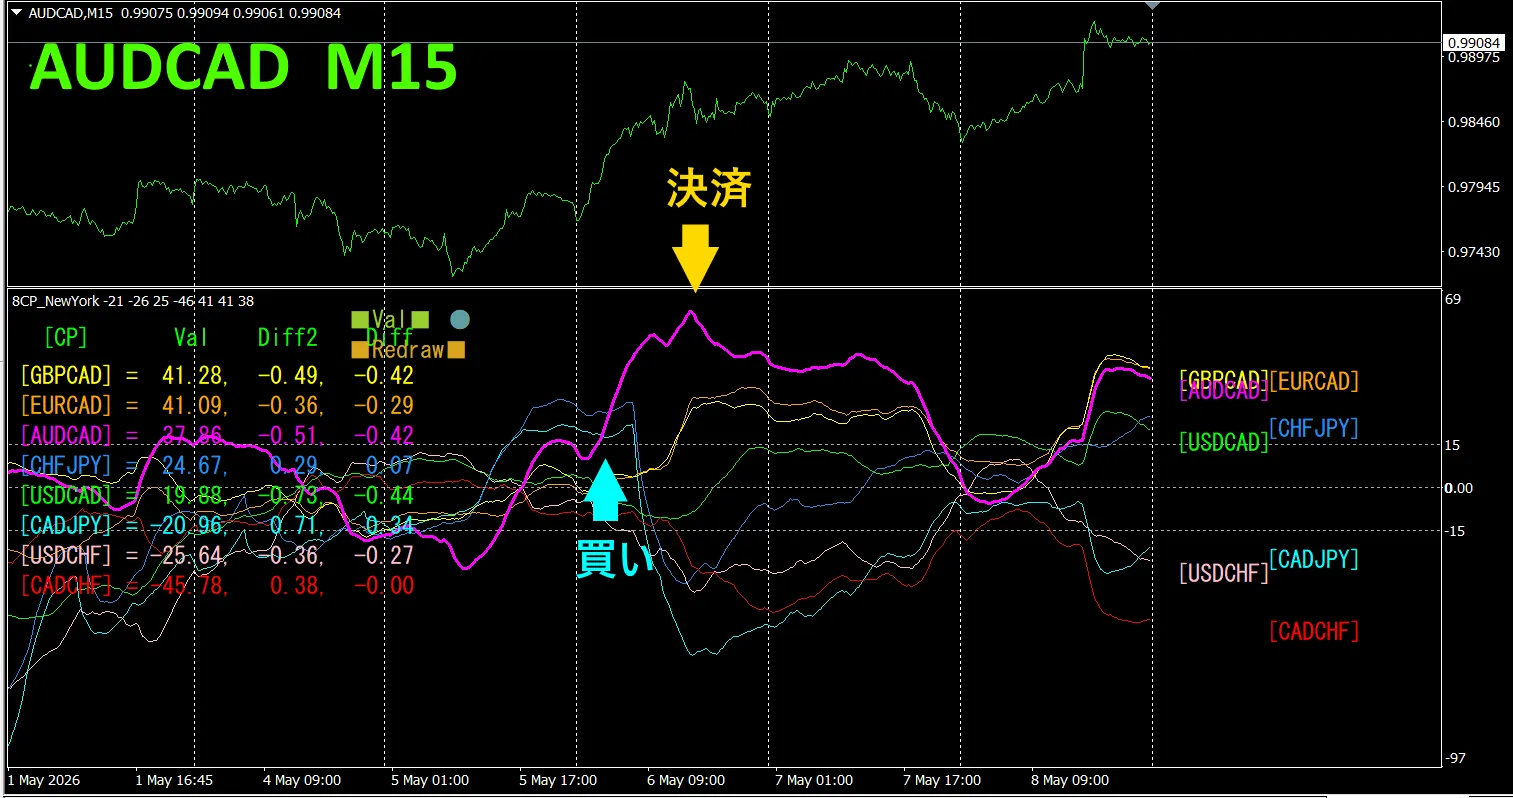
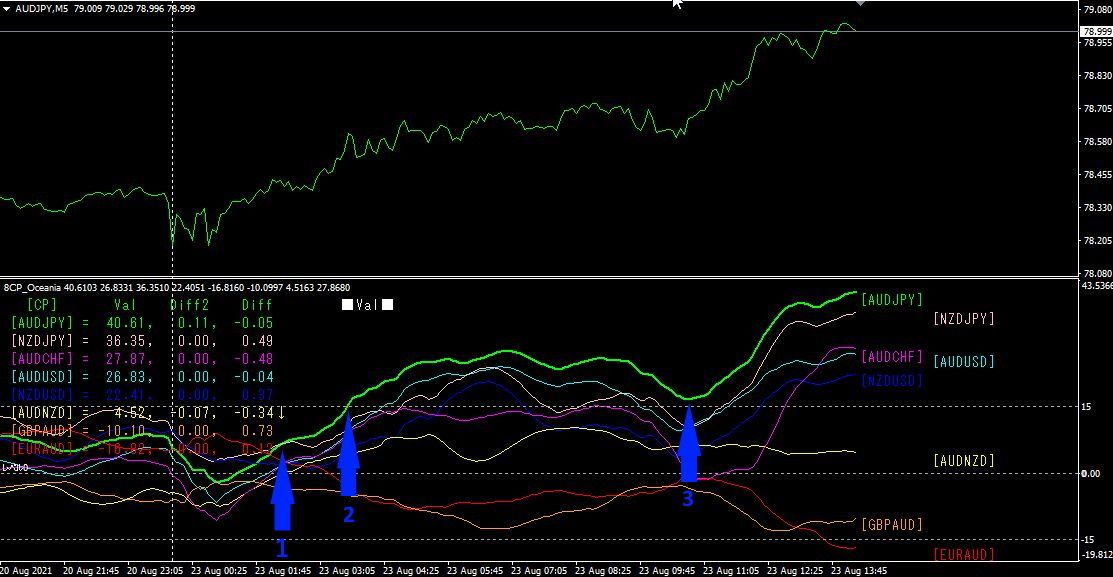
The top half is、AUDCADの15分足 chart。The bottom half is from the “8CPVisualization Indicator”、red-purple thick line graph corresponds to AUDCAD
On Wednesday, the AUDCAD graph rose above the others, so we will buy. Close the position at the same day’s high, yielding about60 pips。
Currency strength/weakness graph
for 15-minute chart shows thatAUD and CAD are inversely related. Trade only in the divergence/expansion area of AUDCAD. Because of the inverse relationship, target that point and trade accordingly.
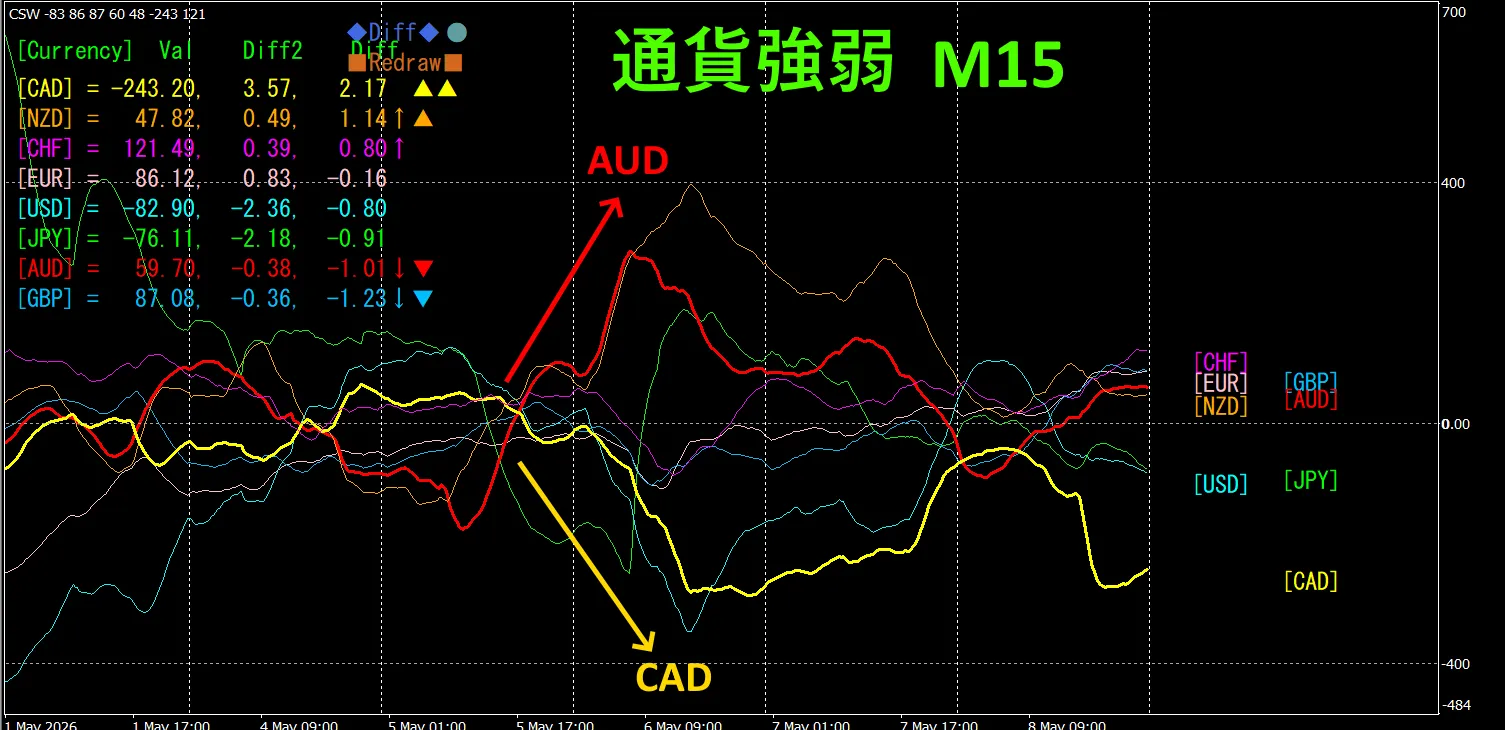
In FX, pick the pair that is currently growing the most and inversely related, and results will follow automatically.
“Trade currency strength inverse correlation!” is the rule of FX.
Using “TrendLine-EX” allows entries and exits to be automated by an angled trendline breakout. Leaving it as is makes trading easy. “TrendLine-EX” is a semi-automatic EA that can short-sell on a downward breakout of the trendline and auto-close on an upward breakout.
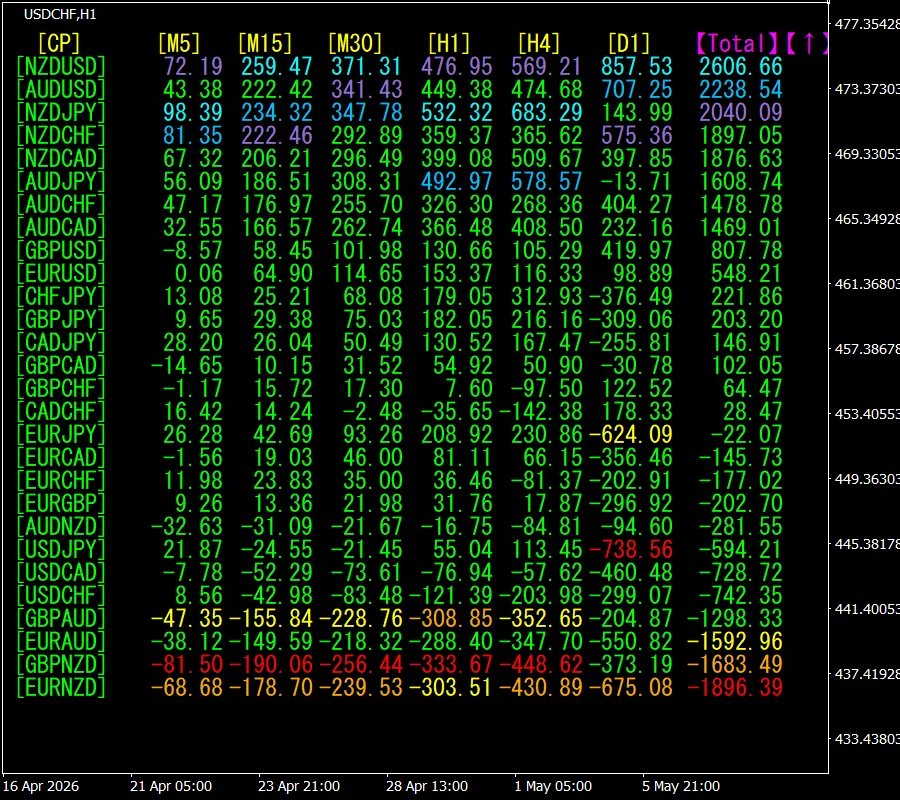
2. Best SelectTry the indicator
The below figure is a screenshot from May 6, 2026, at 11:02(JST)
[Total]
Now, let's look at the NZDUSD chart.
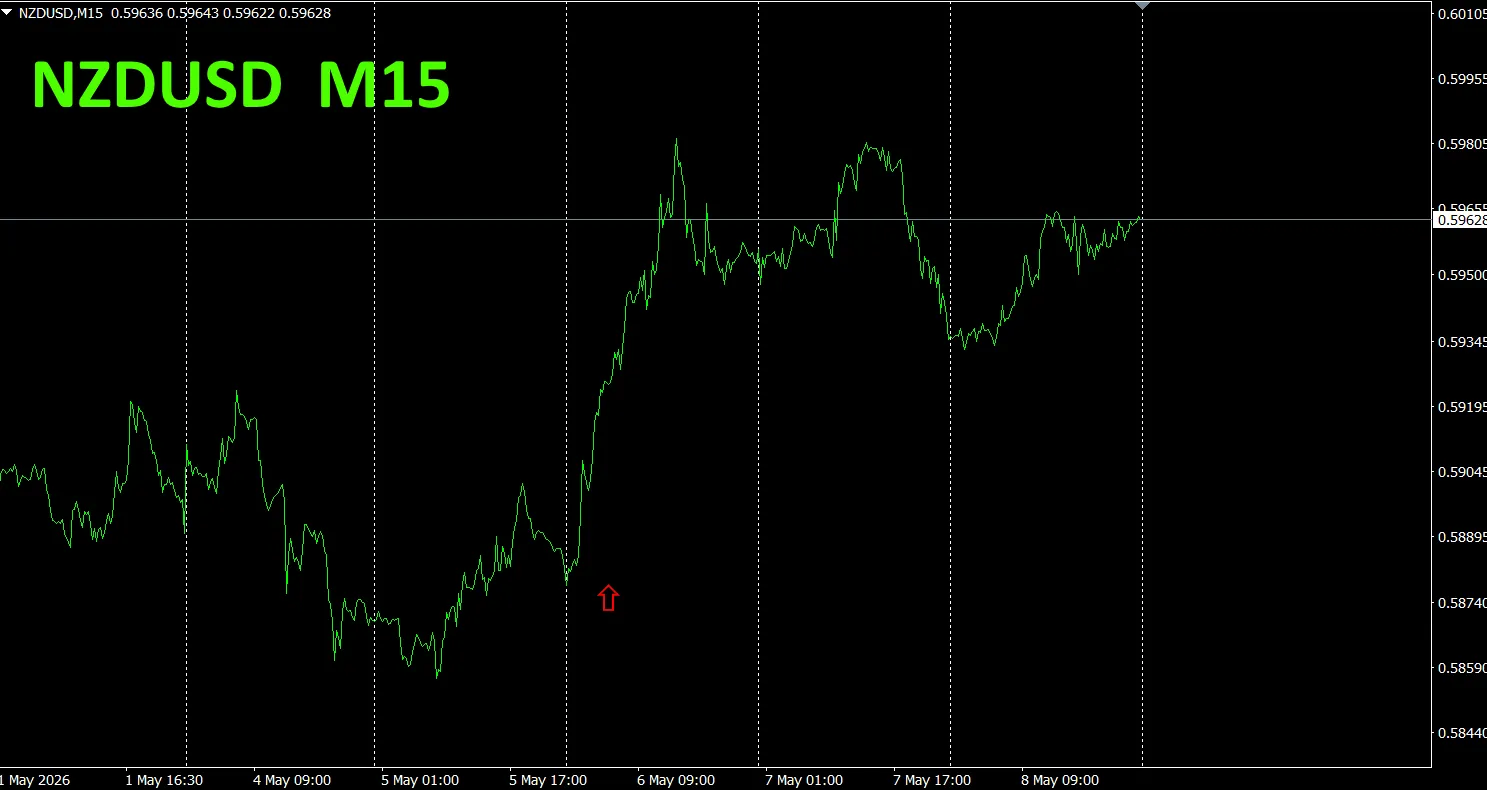
The red arrows show the points where the chart rose. Rising points captured.
“28 Currency Pair Best Select Indicator” allows you to easily identify which of the 28 currency pairs shows the strongest trend. “28 Currency Pair Disparity Comparison Indicator” shows the currency pair with the largest disparity among all pairs, enabling quick trading decisions.
“28 Currency Pair Best Select Indicator”

https://www.gogojungle.co.jp/tools/indicators/35128
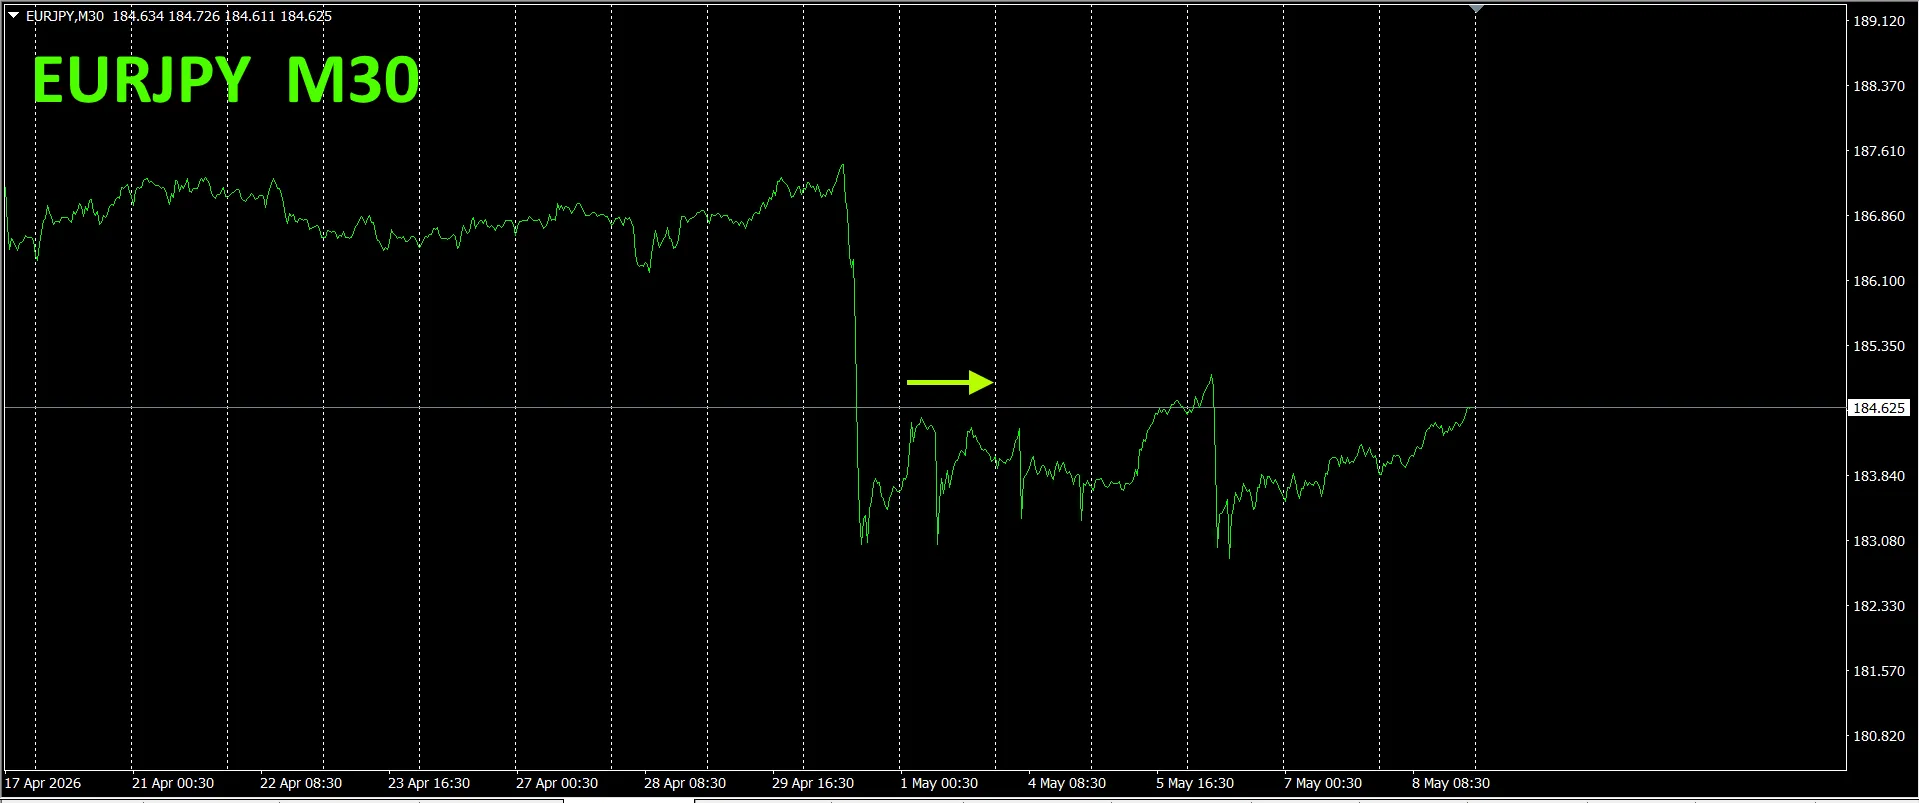
3. 2021 year 5月から追っている EURJPYの動きはどうなった?
We have been tracking EURJPY since May 2021.
To see the overall trend, a 30-minute chart shows about three weeks of recent data.
Last time, we wrote as follows。
Pink represents EUR, green represents JPY. Currency interventions cause large fluctuations. none showing a clear directional bias yet. JPY tends to drift down slightly after a strong spike up, but EURJPY appears to stay in a range for a while
The impact of the intervention has caused a drop, but since then it has not moved up or down much, remaining in a range。
30-minute currency strength chart..
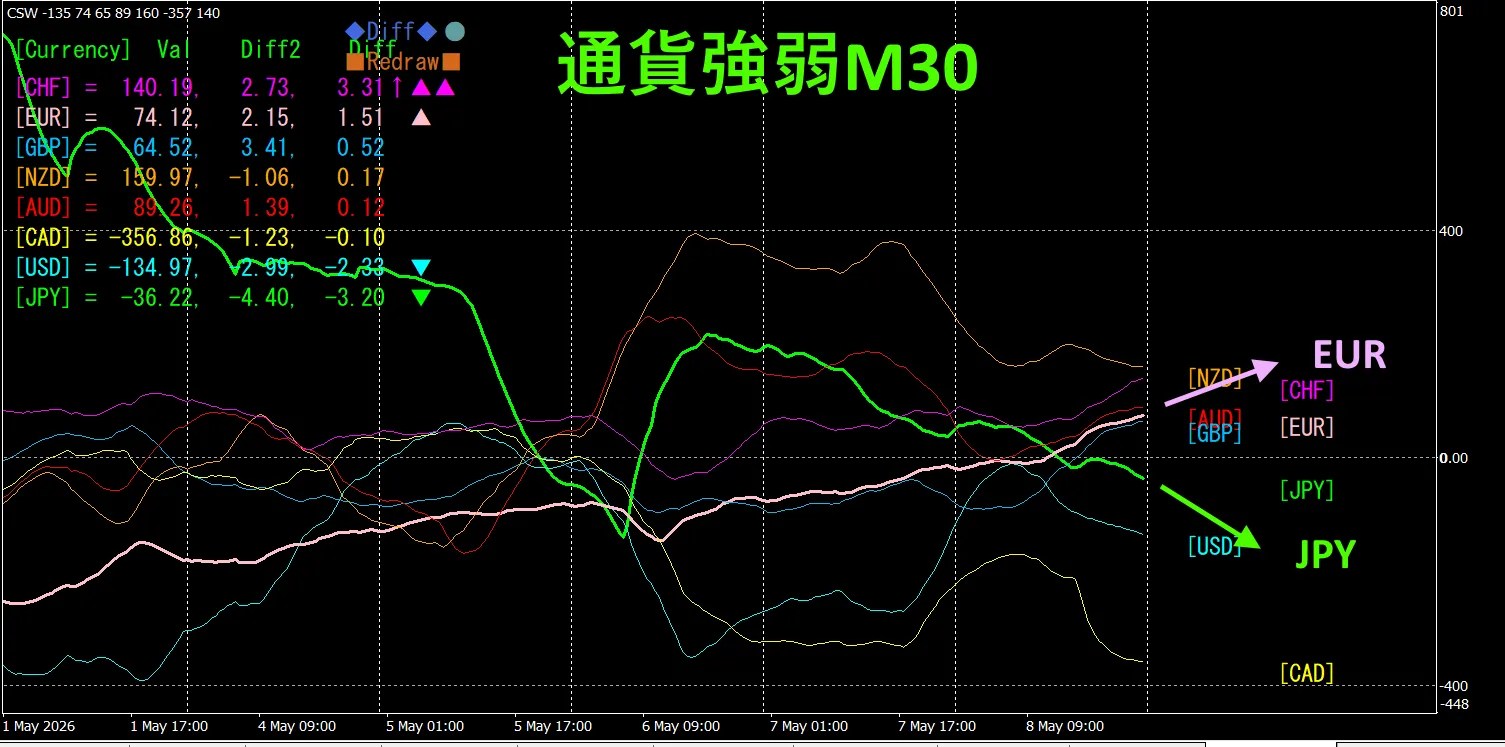
Pink represents EUR, green represents JPY. Currency interventions caused a large fluctuation, but EUR vector is upward and JPY downward. EURJPY is expected to move upward.
4. Try the new indicator Dual_MACD_Trend_Indicatortogether
New indicator “Dual_MACD_Trend_Indicator” is described below.
MT4 version:https://www.gogojungle.co.jp/tools/indicators/62199
MT5 version:https://www.gogojungle.co.jp/tools/indicators/62202
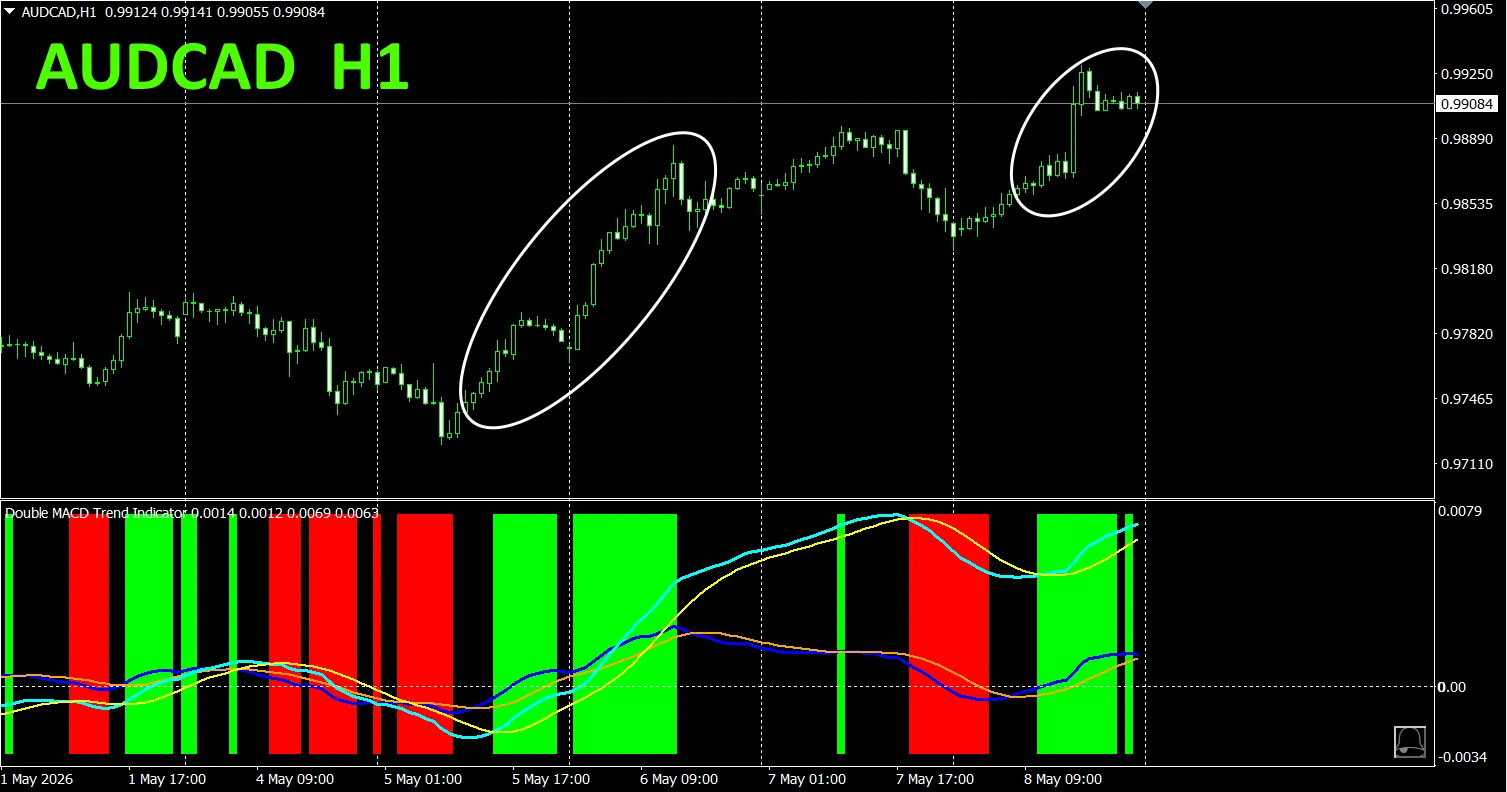
A clear indication of trend direction with color bars. If color is Lime, it’s a buy; if Red, a sell; no color means no trend. Because of color display, you can grasp trend at a glance.
This indicator was applied toAUDCAD on the 1-hour chart.
Red zones for sell and green zones for buy are clearly separated, making trades easy to execute at a glance.In the upper diagram, focus only on the portion encircled by a white oval; since the indicator shows green color, buy signals are triggered.
In “Dual_MACD_Trend_Indicator”, buy in green zones, sell in red zones, and do not trade otherwise.
Using “Dual_MACD_Trend_Indicator” eliminates trading ambiguity.
5. “Trend_Color_MA_MTF”. From the sales page,
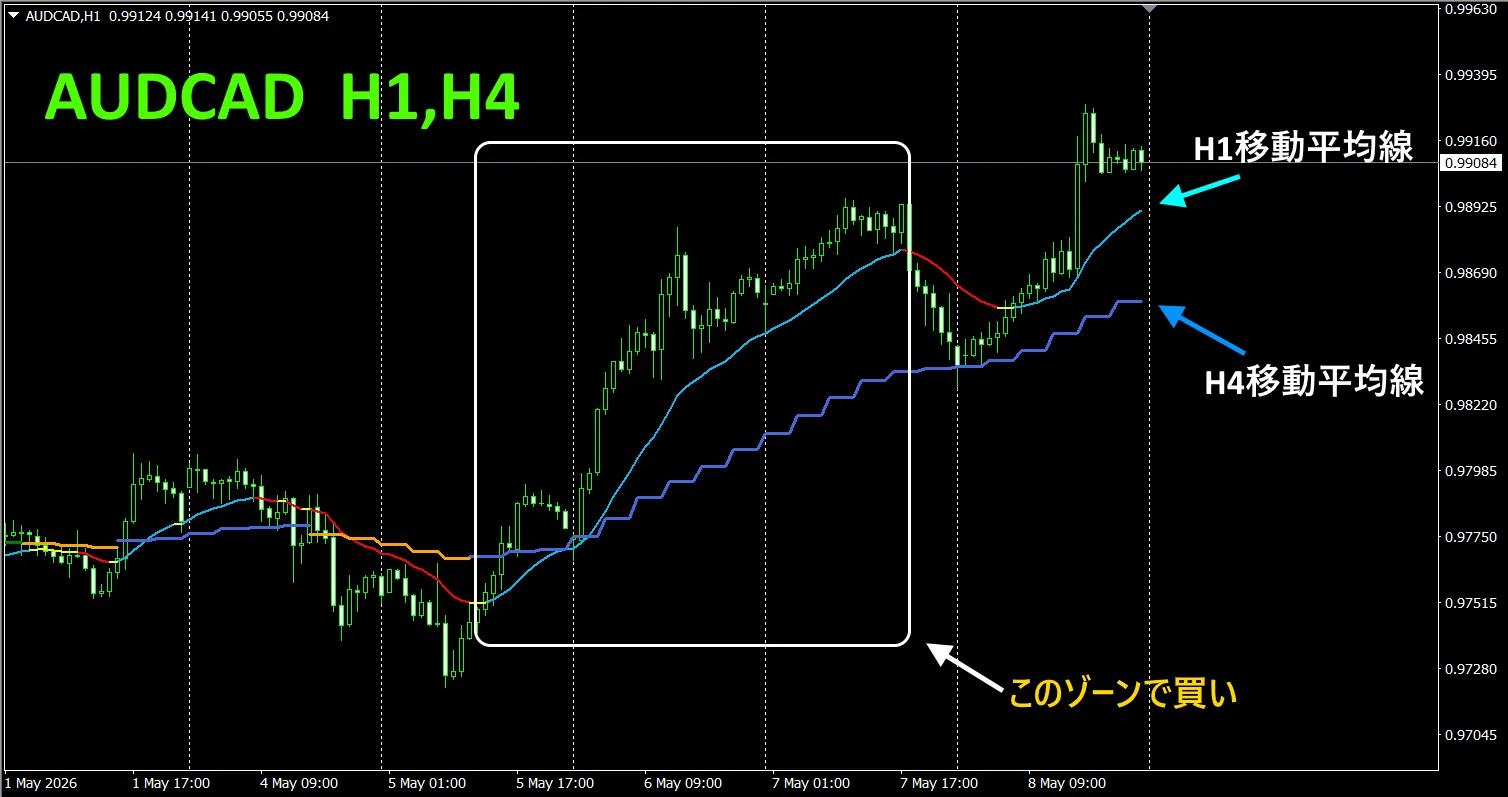
“Trend_Color_MA_Dual_MTF”. This tool is not merely a moving average. It visualizes trend direction with “color” and notifies you the moment a opportunity arrives with “sound” and “notification”, acting as your personal assistant.
As an example, on the AUDCAD 1-hour chart, the 4-hour moving average is displayed simultaneously. The staircase-like formation of the 4-hour MA shows in blue during uptrends and red during downtrends, enabling quick alignment with the current chart’s trend and the higher-timeframe trend.
When the higher timeframe and the current timeframe colors match, trade: red for sell, blue for buy.
For selling, the 1-hour MA turns red while the 4-hour MA turns orange, and selling occurs when the price bars break below the two moving averages.
For buying, the 1-hour MA turns light blue while the 4-hour MA turns blue, and buying occurs when the candles break above the two moving averages.
This trading strategy allows you to trade.
For details, please refer to the following link.
https://www.gogojungle.co.jp/tools/indicators/75985
“8CFD Visualization Indicator Any version”
https://www.gogojungle.co.jp/tools/indicators/32288
“Totoro Indicator”
https://www.gogojungle.co.jp/tools/indicators/50115
“TrendLine-EX”

https://www.gogojungle.co.jp/tools/indicators/42257
“8C currency strength visualization indicator” is, refer to the following page。

MT4 version https://www.gogojungle.co.jp/tools/indicators/39150
MT5 version https://www.gogojungle.co.jp/tools/indicators/39159
【Products I have listed for sale】


Is it OK?