
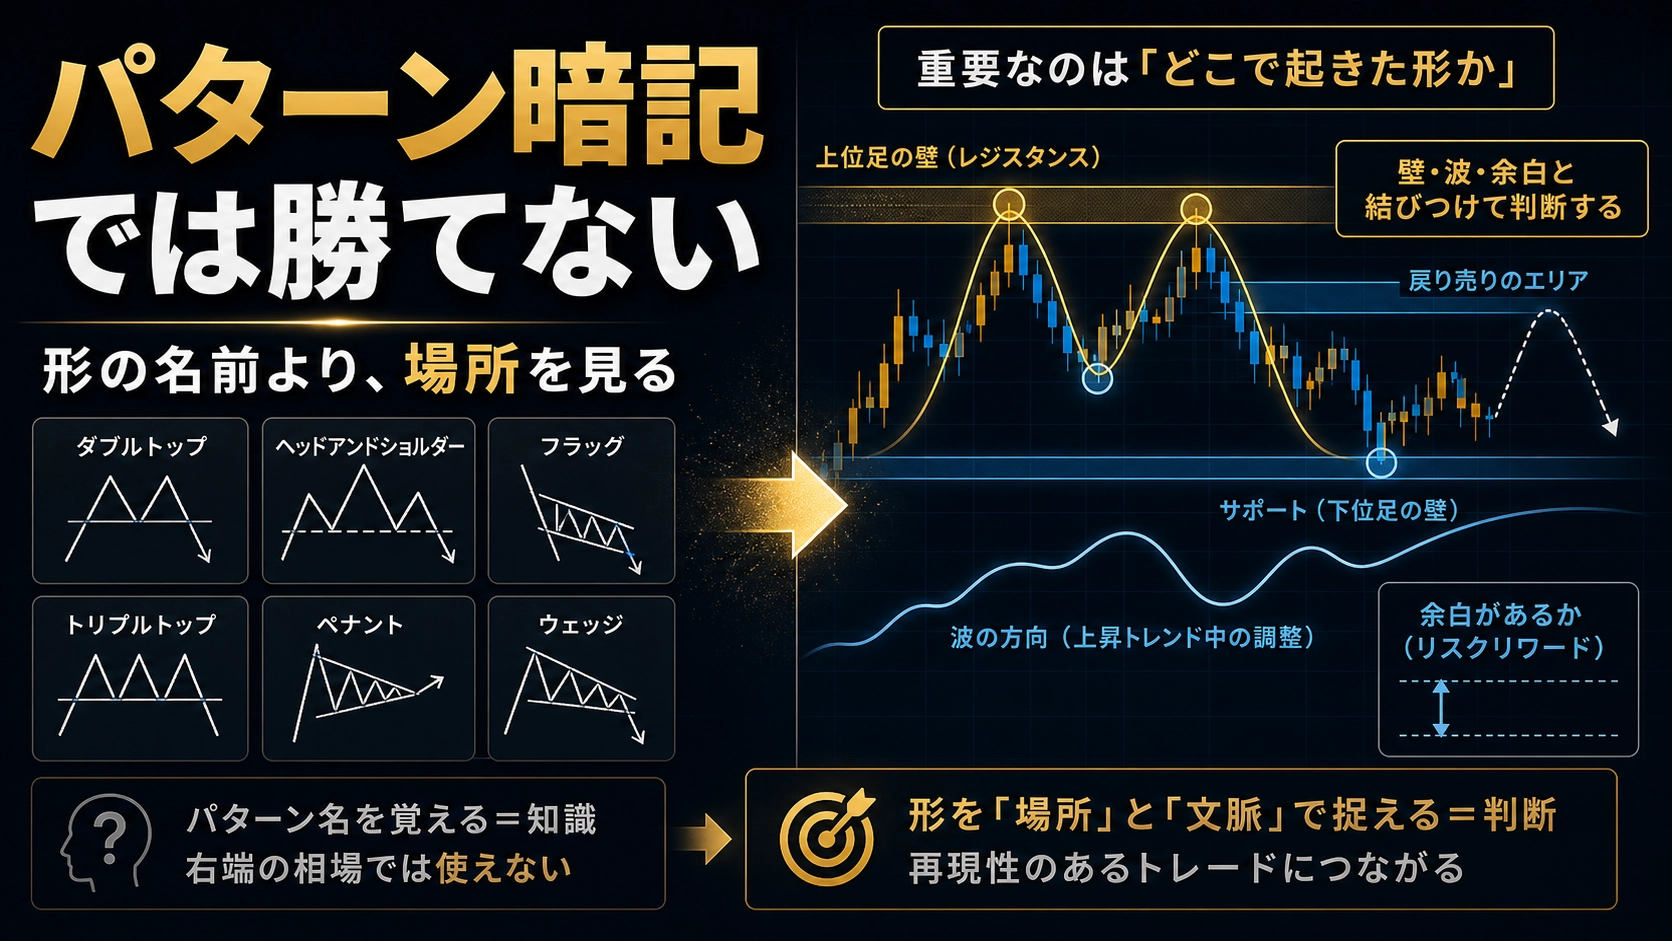
The Real Reason You Still Won't Win Even If You Remember the 【Chart Pattern】
Even if you memorize chart patterns, you won’t win because you don’t have enough patterns memorized. Today I’ll share the real reason behind it.
Good evening!
I’m Masashi.
After watching charts for 18 years, I’ve realized the biggest difference between people who win and those who don’t is the very way they “look at charts.”
↓ A GOLD special feature has been organized with a special薬
Please join now before it’s too late.
The real reason you can’t win even after learning chart patterns
? Double top, head and shoulders, flags…
I’ve memorized all the patterns. I’ve read the books. I’ve checked them in videos as well.
Yet, for some reason, I can’t win.
Have you ever had this experience?
❌ You entered thinking you found a pattern, but it moved in the opposite direction.
❌ Or, you noticed the pattern was forming, but for some reason your body wouldn’t move.
Knowing a chart pattern and being able to use it are two completely different things.
? In this article, we’ll dig into the five perspectives of the structure behind why you can’t win even after learning chart patterns.Structure.
If you finish reading and think “So that’s what it was,” your next trade might change a little^^
1. The Reality: “Learning patterns yet not winning”
There are things traders who study chart patterns often do.
❌ Open the chart and start looking for, “Oh, this is a flag,” “Here looks like a double top.”
Finding patterns makes you happy.
You think, “I can go today.”
But when you enter, it moves against you.
I used to do this too (;'∀')
? Right after you’ve memorized patterns, you’re especially prone to this.
Because the recently learned pattern makes you want to use it more than anything.Then you try to fit the chart shapes into the patterns you know.
? This is a kind of scary truth: the human brain has a tendency to make things look like the shapes you know.“Your brain tends to make patterns look familiar.”.
The more you memorize patterns, the more the chart starts to look like those patterns.
It’s not about whether the pattern truly appears, but aboutseeing the pattern you want to see.
In market terms, this is called“interpreting conveniently”.
? From the moment you memorize chart patterns, people begin to look at the market by “fitting” rather than “seeing”
For example, suppose you learned a while ago that you should sell if you find a head and shoulders.
Then you look at a chart and see three peaks that resemble it.
“This is it!” you enter.
But it doesn’t move. After waiting a bit, it actually breaks upward.
You think, “Did the pattern fail?”
But in reality it’s often the case that“It wasn’t a head and shoulders pattern.”.
❌ The right shoulder was a little too high
❌ The angle of the neck line was different
❌ The location where it appeared was different
? Patterns have a context:“where it appeared,” “the flow just before it,” and “the surrounding conditions.”.
If you ignore that context and enter just by shape, your win rate will naturally drop.
But when you’re just starting to study, you pay more attention to the shape than the context.
This is part of the reason you’re not winning even after learning patterns^^
? Are you on the side of “looking at the chart” now?
? Or are you on the side of “fitting it in”?
Be honest with yourself.
2. The real cause isn’t lack of context but lack of structure
When you hear “you should look at the context,” some people think, “Then I should gather more information.”
❌ Add indicators.
❌ Add moving averages.
❌ Look at RSI as well.
❌ Check Bollinger Bands too.
Then you end up with a screen full of indicators (;'∀')
I did that too.
? But more information does increase “things to consider.”
However,the more information you have, the more indecision you’ll have.
MACD may show a sell signal while moving averages are rising.
RSI near 50 is neutral.
Then which side should you enter on?
? This isn’t due to lack of information.It’s because you haven’t seen the structure
..
? “Structure” is roughly like“a map of the market.”.
Where the market is now, what state it’s in, where the walls are, and what the waves look like.
If you understand this, you can decide “this isn’t a place to enter now” and “this is likely to stop here” even without many indicators.
? Patterns are memorized by name, but structure is learned by understanding the market’s state
Chart patterns are statistical: they show that in the past a similar shape appeared and moved similarly.
So even if two patterns look the same, if they appeared in different places, their movements will differ.
? When a pattern appears right before a known resistance wall
? When a pattern appears just after crossing a wall
? When a pattern appears far from the wall in an intermediate area
The market condition in each case is completely different.
Yet if you judge the same way by shape, you’ll have no chance to win.
? Reading the structure means reading the context of “where it appeared and in what state.”
Learning chart patterns and learning to read the structure are completely different studies..
3. What successful people are casually doing: the truth
When you listen to successful traders, you’ll sometimes hear“I kind of understand it; I enter by feel.”.
? But that isn’t it.
That “vague feeling” has a real identity.
? It’s“unconscious structural checking”.
People who have traded for a long time can, the moment they see a chart, automatically judge
“The wall is here,” “the current wave is coming from here,” “Is this moment a place to trade or not?”
This is why it looks like they have a gut feeling.
But in reality, there’s a very deep structural understanding as the foundation.
? Saying “I kind of understand” means you’ve practiced unconsciously confirming structures
On the other hand, traders who only memorize patterns tend tobe reactive: “pattern appears → enter”.
That judgment doesn’t include “the current market state.”
? Let’s compare concretely.
❌Pattern-dependent trader
“A triangle appeared on the chart. If it breaks up, enter” → Breaks up and enters → It returns to stop
?Trader who reads the structure
“A triangle appears. But there’s a big wall up ahead. Based on the wave flow, it’s likely to be a temporary movement. I’ll pass.” → When it returns, they confirm the decision was correct, which builds confidence
Do you see the difference?
Both see the chart’s “shape.”
But whether the structure is visible or not completely changes the decision.
? More specifically, successful traders have“reasons not to enter”.
Losing traders look for “reasons to enter.”
This difference may seem small but it profoundly affects long-term results.
To have a reason not to enter, you must see the structure.
With patterns alone, you can’t manufacture a reason not to enter.
4. A way to read the market by walls, waves, and time-frame back-and-forth
So, concretely, how do you see the structure?
? I’ll organize it with three keywords.
“Walls,” “waves,” and “time-frame back-and-forth.”.
? First“Walls”.
A wall is a price level where the market stops several times or begins to move strongly.
On the chart you’ll find places where it seems to pause several times or break through and move rapidly.
Anyone can find walls by looking at the chart.
You don’t need special tools.
? Finding a wall and being able to use it are two different things
How the price behaves near the wall, what happens after it breaks through, and how your entry thinking changes when you’re near the wall vs. moving away from it.
That’s the usable state.
The wall is visible.
But if you don’t know how to use that wall, you’ll end up like with patterns—“I know it, but I can’t win.”
? Next“Waves”.
Markets go up and down in cycles—up, down, up again.
This up-and-down movement is called a wave.
By identifying where you are in the wave, you can roughly understand“which direction momentum currently favors.”.
Are you near the top of the wave, the bottom, or somewhere in the middle?
With that understanding, when a chart pattern appears, you can see whether you’re chasing the move or opposing it.
⚖️ And“Time-frame back-and-forth”
When viewing the market, relying on a single time-frame narrows your view.
? First, confirm the current situation on a lower timeframe.
? Then confirm the wall position and wave state on a higher timeframe.
? Finally return to the lower timeframe to make the entry decision.
In this back-and-forth, only when multiple conditions align—“near the higher timeframe wall” and “riding the wave”—do you reach a state where you can trade confidently^^
? The higher timeframe is used only to checkthe wall position and wave state.
If you try to time entries on the higher timeframe, your judgments become blurred.
A detailed method is summarized in“The Market’s Answer”, but conceptually the reason for the back-and-forth is“each timeframe has its own role.”.
If you don’t know the roles, you won’t get an answer no matter how many times you go back and forth.
5. Five action steps you can start tomorrow
“I get it, but what should I do starting tomorrow?”
If I don’t answer this, there’s no point in writing this article, so I’ll be specific.
?Only those who can turn knowledge into action can gradually get closer to the market instead of just getting used to it.
✅Step 1: Stop pattern hunting from today
When you open a chart, stop looking for patterns.
Instead, try confirming only “where the current price is” and “which direction the previous wave is pointing.”
Just this changes what you look at.
✅Step 2: Practice finding walls every day for 5 minutes
Open the chart and draw lines at places where you see it has paused several times or where it started to move strongly.
That’s all. Don’t judge. Don’t enter.
Continuing this practice gradually changes how you view charts.
✅Step 3: When you feel like entering, check your position relative to the wall
When you feel like entering, first check whether the current price is near or far from the wall.
Even if a pattern appears far away, that’s only a “shape appearing.”
When something is happening near the wall, that’s when the perspective of “this might become a trading opportunity” arises.
✅Step 4: Keep a record of “missed entries”
Not entries, but records of the moments you did not enter.“This pattern appeared, but I stayed out because it was far from the wall.”
“I stayed out because it was against the wave’s direction.”
Record these.
As your accuracy in avoiding trades improves, your entry accuracy also improves.
✅Step 5: Build a habit of alternating between lower and higher timeframes
When considering entries, always check on the lower timeframe first, then confirm the wall and wave state on the higher timeframe, and return to the lower timeframe.
Initially this may feel tedious.
But once you can do this back-and-forth naturally, you’ll gradually develop a sense of “I kind of understand.”
✍️ You don’t need to change everything at once. Step 1 and 2 alone can be started this week
Summary
✨ Memorizing chart patterns is not a bad starting point.
But it won’t make you win just by itself.
?“Fitting patterns” and “reading structure” are separate tasks.
? Where the wall is, What wave state, and Where you are now.
As that becomes clear, the way you use chart patternschanges..
? Knowing alone isn’t enough. Small correct steps in the right direction will clearly change your view of the market
Don’t rush—build it up step by step.
? For those who want to dive deeper into walls, waves, and time-frame back-and-forth, you can read“The Market’s Answer”.
In GOLD-special discretionary trading, this material organizes the concept of“reading structure”over two years.
It’s not flashy, butyou’ll have a solid basis to make your own judgments^^
If you’re interested, please have a look.
? More details here
https://www.gogojungle.co.jp/tools/ebooks/77829
? I’ve also created a free AI tool for trading analysis. Please try it
https://trade-ai-free.streamlit.app/
【The Classic Technique for Explosive Profits】
▼ GOLD Special薬 Manual
https://www.gogojungle.co.jp/tools/ebooks/50406
? Free gift | Partial manual released
https://www.gogojungle.co.jp/info/22533