
[How to Identify a Stagnant Market] Explained by an 18-Year Trader
You’re not noticing that the chart isn’t moving not because of where you’re looking, but for another reason. Today I’ll talk about the true nature of that.
Good evening!
I’m Masashi.
After watching charts for 18 years, I’ve realized that the biggest difference between those who win and those who don’t is how they spend time in a market that isn’t moving.
Please join us while there’s still time.
How to identify a stagnant market|18-year trader explains
When you open the chart, it feels like nothing is moving.
But you don’t know when it will move, so you end up watching the screen for a long time.
And before you realize it, an hour has passed and you still haven’t done anything…
Have you had this experience?
“Not noticing that it’s moving” isn’t because you’re looking in the wrong place. It’s because your “purpose” for looking is wrong.
In this article, I’ll share the way to distinguish between a market where movement has stopped and a market that’s about to move, along with theway of thinking.
This isn’t about techniques,it’s about how to read the chart’s structure, so please read to the end ^^
1. The true nature of “I can’t just wait”
You open the chart and the market has hardly moved.
It’s not going up, nor is it going down.
In that state, what do you do?
Most people take these actions.
❌ Try to switch to smaller timeframes to see more detail
❌ Start predicting, thinking it might move soon
❌ Frustrated, enter even though it isn’t moving
I used to be exactly the same.
Seeing that it isn’t moving makes it feel like it’s my fault for not waiting, and I feel I must take some action (\';'``
? But in reality the opposite is true:The most useless entries are born during the time movement is stopped.
? If you keep watching the screen without realizing it isn’t moving, that’s a breeding ground for losses
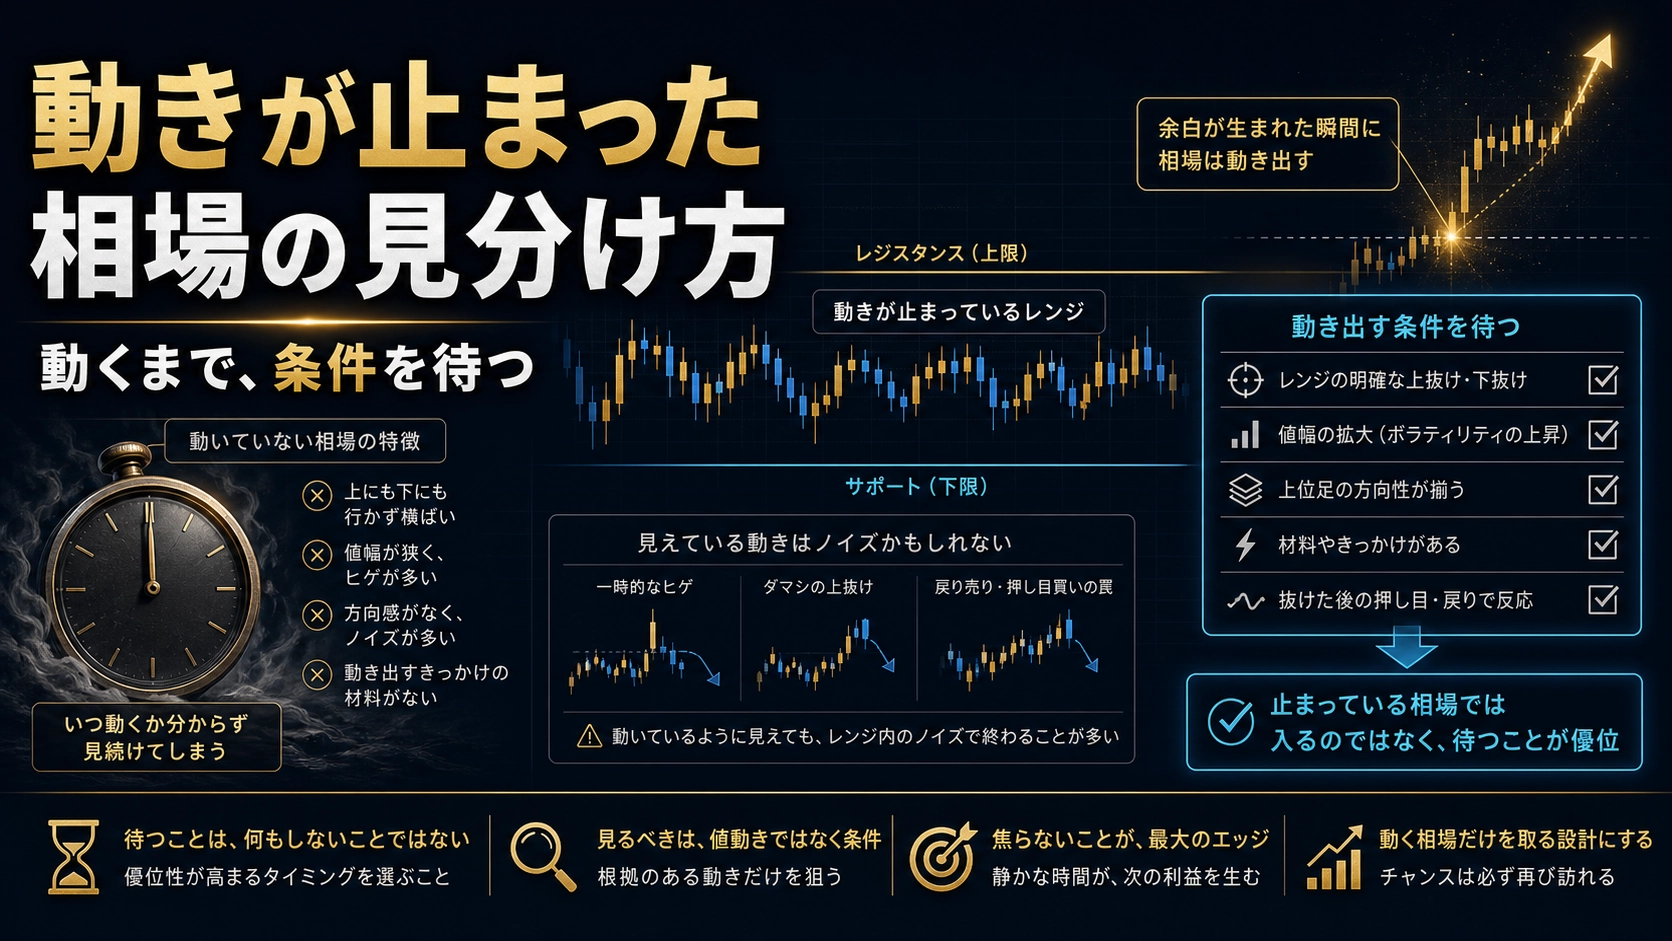
Concretely, this state looks like this:
? The real body of the candlesticks is extremely small
? It continues to move without breaking up or down
? You find yourself thinking, “I’m waiting for the next bar”
People who are aware of this see it as obvious, but in actual trading, very few can judge in real time that “it’s stopped now.”
? If you look at the screen for a long time, you can’t distinguish “small movement” from “stopped.”
Even if movement is small, the psychology kicks in that “this could be a chance.”
Behind this psychology, there isa lack of understanding of market structure.
If you don’t know the structure of when and why the market stops, you will keep reacting to the movement right in front of you.
? Not urgency, butLack of structural understanding
2. The fundamental reason we misread the “stopping”
Why can’t you notice movement has stopped?
Because you’re only looking at the size of the move,not at where it’s stopping.
? Whether the market is stopped cannot be judged by the size of the candlestick alone.
What’s important is“where it’s stopping”.
? If you don’t know the chart’s structure, you can’t read the meaning of the stopping point
To be a bit more concrete,
? There are places in the market that prices bounce off repeatedly or are drawn toward repeatedly, like a“wall”.
The price tends to bounce around near that wall, which is a common form of a “stopping” state.
When it’s near that wall, two things tend to happen:
? ① It breaks through the wall and moves strongly
? ② It gets bounced by the wall and returns in the opposite direction
No one knows which will happen at that moment.
But if you can just recognize that “I’m near the wall and it’s stopping now,” your decision quality changes dramatically.
? If stopping occurs away from the wall, it’s probably not a pre-movement signal but simply a lack of energy.
? If stopping occurs near the wall, it may be a time of “gathering” before moving in one direction.
? To distinguish these, you must also check the state of the wave (trend).
Whether the market’s wave is moving up, down, or losing directionality must be checked together with the wall position.
Only when you look at both the wave state and the wall can you see the reason for stopping.
In other words, if you look at the chart without understanding both the wall and the wave,all stoppages look the same
You’ll only hold a vague hope that “something might happen if it moves,” without clarity.
? Not only changing where you look, but changing yourpurpose for looking.
That, I believe, is the first step to accurately identifying a stagnant market ^^
3. What winning traders actually look at
To be honest.
The difference between winning traders and losing traders isn’t the tools they use or the amount of information they have.
? The difference lies inthe purpose and awareness of what they are checking.
? Losing traders look for where to enter. Winning traders verify whether the situation is actually enterable
At first glance these may look similar, but they are completely different actions.
❌ People who look for where to enter try to find a point to get into the chart.
Even when movement is stopped, they try to give meaning to “this could be a chance.”
Even if the shape is bad, they bend the interpretation to fit their hopes.
? Meanwhile, those who verify whether it’s a situation to enter start by organizing the current state.
? Is the market currently near a wall?
? Does the wave currently have a clear direction?
? Is the current stopped state a “gathering” or an “energy depletion”?
After checking these, if you decide it isn’t a situation to enter, you close the chart for that day.
That alone, but those who can do this are really rare.
? After 18 years, what I feel most is thatthe ability to make decisions not to act was the biggest turning point.
What to do in a stagnant market isn’t to look for entries, but toconfirm the reason it’s stopped.
And find the basis to decide, “Today I will do nothing.”
? People who can wait without a reason and those who can wait with a reason experience completely different levels of stress.
Without a basis, you feel anxious, you keep looking at the screen, and that leads to impulsive entries.
Breaking this loop isstructural understanding
From thinking “I feel like it’s stopping” to “it’s near the wall and I’m temporarily withholding judgment,”
just that change reduces unnecessary trades dramatically.
4. A mindset to accurately distinguish stopping
From here I’ll explain how to distinguish a stagnant market at the level of thinking, not methods.
This isn’t about the method details, but about the perspective you use to view the chart.
? First, the order in which you view the chart matters.
⚖️ Check the current movement on the lower time frame, then check the wall’s position and the wave’s state on the higher time frame, then return to the lower time frame to judge again.
Thisreversal
⚖️ Do not judge whether it’s stopped only by the lower time frame. It only makes sense after you’ve checked the higher time frame’s wall and wave by going back and forth
? The role of the higher time frame is not to find entry timing.
Only to confirm the wall’s position and which state the wave is in.
If you keep the image that you go to the higher time frame to confirm these two, that’s a good habit.
? When you’re near the wall, stopping could be the state before moving in either direction.
? Stopping away from the wall might just mean a loss of directionality.
You can’t determine this unless you check the wall’s position on the higher time frame.
If you only look at the lower time frame, all stoppages look the same.
? Next, the view of the wave’s state.
? A stop in a one-direction wave might be a buildup of energy for the continuation of movement.
? A stop in an oscillating wave might be a sign that movement is weakening.
We can’t confirm which is which, but just checking which state it’s closer to changes how you view the chart.
? The important thing is not to predict the next move when stopped.Do not forecast the next move.
Instead,accurately confirm the current state.
Then decide whether it’s a situation to enter or not.
5. Habits you can start tomorrow to distinguish stopping
?Start by deciding what not to do today before deciding what to do today。
✅Step 1: When you open the chart, first check the lower time frame for the current state
The goal isn’t to find an entry, but to express in words what the current state is.
Can you say in one word, “moving up,” “stopped,” or “moving down” first?
If you can’t put it into words, that’s a sign you haven’t organized the situation yet.
✅Step 2: Check the wall’s position on the higher time frame
After confirming the current state on the lower frame, check where the wall is on the higher frame.
Understand whether the current price is near the wall or away from it.
Don’t go looking for entries; simplyfocus on confirming the location.
✅Step 3: Check the wave state on the higher frame
After confirming the wall, look at what state the wave is in.
Is it trending in one direction or oscillating?
Again, do not predict. Just verify which state it’s closer to.
✅Step 4: Decide if it’s a situation to enter or not
After steps 1–3, decide whether today is a day you can enter or not.
If you’re away from the wall and there’s no directional movement, it’s a day to pass.
If your decision has a basis, closing the chart isn’t fleeing but the correct decision.
✅Step 5: Record “Today I did nothing”
This is subtle but important.
By recording days when you did nothing, you accumulate the fact that you could make non-entry decisions.
As the number of days avoiding unnecessary trades grows, your confidence in your own judgment increases.
✍️ What’s needed is to shift your purpose from “find a point to enter” to “check the situation”
After 18 years, I’ve found this change of purpose to be the hardest but most effective ^^
Please try it before tomorrow’s trade.
Summary
Distinguishing a stagnant market isn’t a difficult technique.It’s not a matter of clever tricks.
? Instead of asking “is it stopping,” check “where is it stopping.”
? Verify the wall’s position and the wave state by going back and forth between the lower and higher time frames.
✅ And if it isn’t a situation to enter, have the basis to decide not to act today.
With just this,unnecessary trades decrease and the anxiety of waiting also fades。
? From the day you can accurately distinguish a stagnant market, trading becomes quieter
There’s no need to rush.
Please accumulate the habit of checking things one by one ^^
? The concepts I’ve shared here—“wall position,” “wave state,” “back-and-forth verification of lower and higher frames”──If you want to study these ideas more deeply, take a look at my compiled“Answer of the Market”.
It’s a教材 I spent two years developing, complete with videos and AI tools.
It isn’t flashy, but it gives you a solid basis for making your own judgments^^
? More details here
https://www.gogojungle.co.jp/tools/ebooks/77829
? I also created a free AI tool for trade analysis. Please feel free to try it
https://trade-ai-free.streamlit.app/
【Old-school techniques to aim for massive profits】
▼ GOLD-specific remedy manual
https://www.gogojungle.co.jp/tools/ebooks/50406
? Free gift|Partial manual released
https://www.gogojungle.co.jp/info/22533