

Breaking News XAUJPY 30-minute Chart "Pattern Analysis × Three-Currency Parity Analysis"
Viewing XAUJPY on a 30-minute chart
Pattern Analysis × Three-Currency Parity Analysis
This is a practical example where both price patterns and currency distortions can be confirmed simultaneously by overlaying TEPPAN VIEWER and Intervention Aftermath PRO Catcher on the same chart.
Today, May 7 (Thu) at 5:40 AM, using the XAUJPY 30-minute chart as the subject, I will整理 based on what can be confirmed from the image.
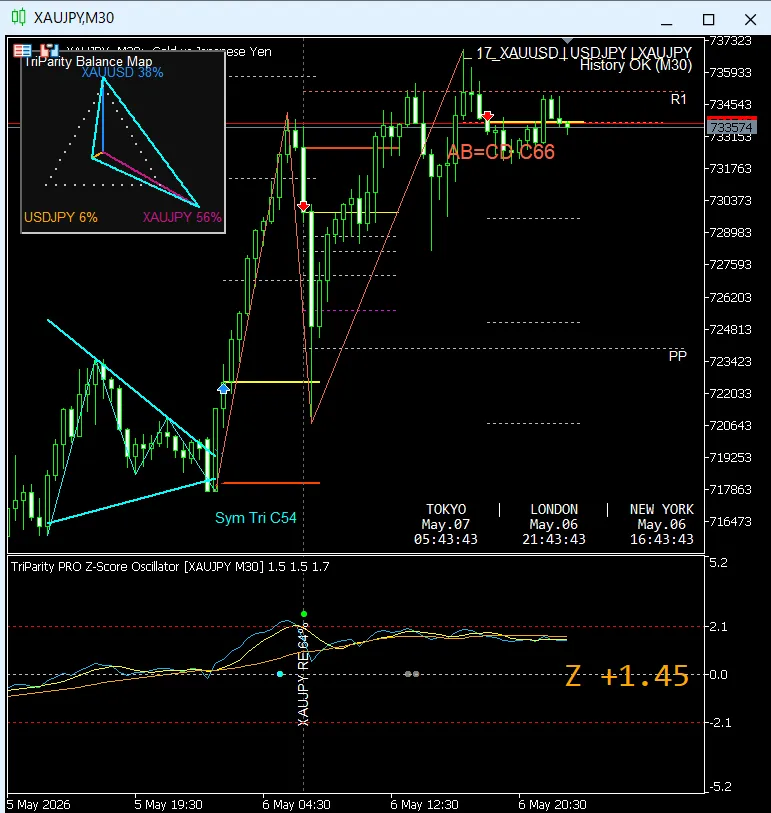
TEPPAN’s buying phase, Catcher’s selling phase, and a new AB=CD pattern
In this chart, TEPPAN VIEWER first captures a buying phase from the price pattern perspective, after which XAUJPY rises notably.
Subsequently, at the high price range, selling signals appear from the three-currency parity analysis tool “Intervention Aftermath PRO Catcher,” and a rebound from there is observed. Currently, a newAB=CDpattern is displayed on TEPPAN VIEWER.
Not just XAUJPY in isolation, but looking at the relationship among XAUUSD, USDJPY, and XAUJPY
The subject this time is,XAUJPY 30-minute chart.
The chart loads two elements that visualize price patternsTEPPAN VIEWERand that perform three-currency parity analysisIntervention Aftermath PRO Catcher.
In Intervention Aftermath PRO Catcher, among 21 triads, an appropriate triad is automatically selected according to the currency pair shown on the main chart.
In other words, rather than looking only at the price movement of XAUJPY in isolation,the position of XAUJPY within the three-price relationship of XAUUSD, USDJPY, and XAUJPYcan be confirmed in this setup.
Flow visible from the images
On the left side of the image, TEPPAN VIEWER captures a triangle consolidation buying phase, and afterward XAUJPY rises sharply.
Meanwhile, in the subsequent high-price range, selling signals appear from Intervention Aftermath PRO Catcher, and a substantial pullback is observed from there.
It can be seen that TEPPAN captures a buying phase from the price-pattern perspective, followed by Intervention Aftermath PRO Catcher catching a selling phase from a three-currency parity analysis viewpoint.
Of course, this does not mean “it will move the same way in the future.” However, what is very interesting is that, when looking at past price movements, price-pattern analysis and three-currency parity analysis seem to function at different phases.
Viewing distortions among currencies with Z-Score Oscillator and TriParity Balance Map
In the top-rightTriParity Balance Mapare shown the contribution balances of XAUUSD, USDJPY, and XAUJPY. In this screen, XAUJPY’s weight is prominently displayed, allowing visual confirmation of which pair is strongly involved in the current distortion.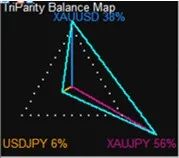
In the lower partZ-Score Oscillatorshows the current Z valuearound +1.45.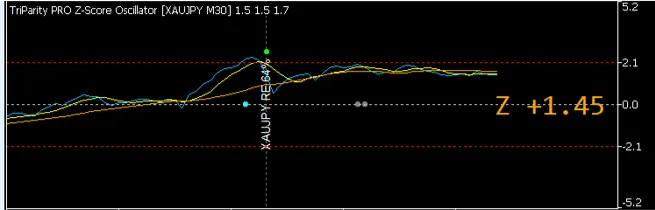
The Z-score is a metric to assess how far the three-currency relationship is deviating from the normal state. It provides a basis for understanding where XAUJPY stands within the triad.
Currently showing a new AB=CD
After a recent rise, a new pattern has formed on TEPPAN VIEWER.
In the current chart, TEPPAN VIEWER showsAB=CDpattern.
This is a stage where, after the recent rise, another pattern has formed, and whether the price will push higher or enter a brief pullback should not be judged by TEPPAN patterns alone, but should be verified together with Catcher’s Z-score, TriParity Balance Map, Nowcast, and other indicators.
Thus, TEPPAN VIEWER is a tool for visually capturing price patterns, and Intervention Aftermath PRO Catcher is a tool for capturing distortions between currencies through three-currency parity analysis.
Key points this time
Products in use
Intervention Aftermath PRO Catcher · Scanner · LiveGAP
Core tool suites for observing and visualizing three-currency parity analysis on MT5. Catcher uses Z-score, RE/BO, Nowcast, TriParity Balance Map, TP/SL display, etc., to confirm distortions and positional relationships on individual charts.
View Intervention Aftermath PRO product pageTEPPAN
TEPPAN is an indicator series consisting of RADAR, VIEWER, CONFIDENCE, COMPASS, supporting everything from candidate extraction to pattern visualization, final judgment, and timing confirmation. In this example, TEPPAN VIEWER visually displays the price pattern of XAUJPY.
View TEPPAN product pageRoles of TEPPAN VIEWER and Intervention Aftermath PRO Catcher
Seeing “shape” and “distortion” at the same time changes market perception
TEPPAN VIEWER is a tool for visualizing chart shapes and price structure. Intervention Aftermath PRO Catcher, on the other hand, is a tool for seeing how prices distort within the three-currency relationship.
By combining these two, you can simultaneously confirm pattern-based dominance, currency relationship distortions, current Z-score position, and the contribution balance of the leading pair. This XAUJPY 30-minute chart is a clear example of that value.
This article is intended to share indicator display examples and chart observation, and is not investment advice or a trading recommendation.
The signals and patterns shown do not guarantee future price movements, profits, win rate, or any trading results.
Actual trading decisions should be made at your own risk and with adequate risk management.