

Everyday Nikkei 225: 2026/5/7
Detailed analysis tool link
Note: Have steadily received high praise.
■ Newly developed performance + indicator DAVID (David)
https://www.gogojungle.co.jp/tools/indicators/73936?via=users_products
■ Excellent trendline drawing indicator “Unparalleled Sword”
https://www.gogojungle.co.jp/tools/indicators/54499?via=users_products
■ Indicator Pack MT4/5 version, monthly subscription
“天下無双” Synchronization System
https://www.gogojungle.co.jp/tools/indicators/50319
“David” Synchronization System
https://www.gogojungle.co.jp/tools/indicators/73939?via=users_products
Trial version・Ultimate Synchronization System Monthly
https://www.gogojungle.co.jp/tools/ebooks/50353
Below: Current situation analysis article
One-word comment: Rebound
Daily chart:MAX Oscillator: Synchronization Band“Strong rise””
4-hour chart“Weak rise” signal suggests
Weekly chart “Weak rise” signal suggests
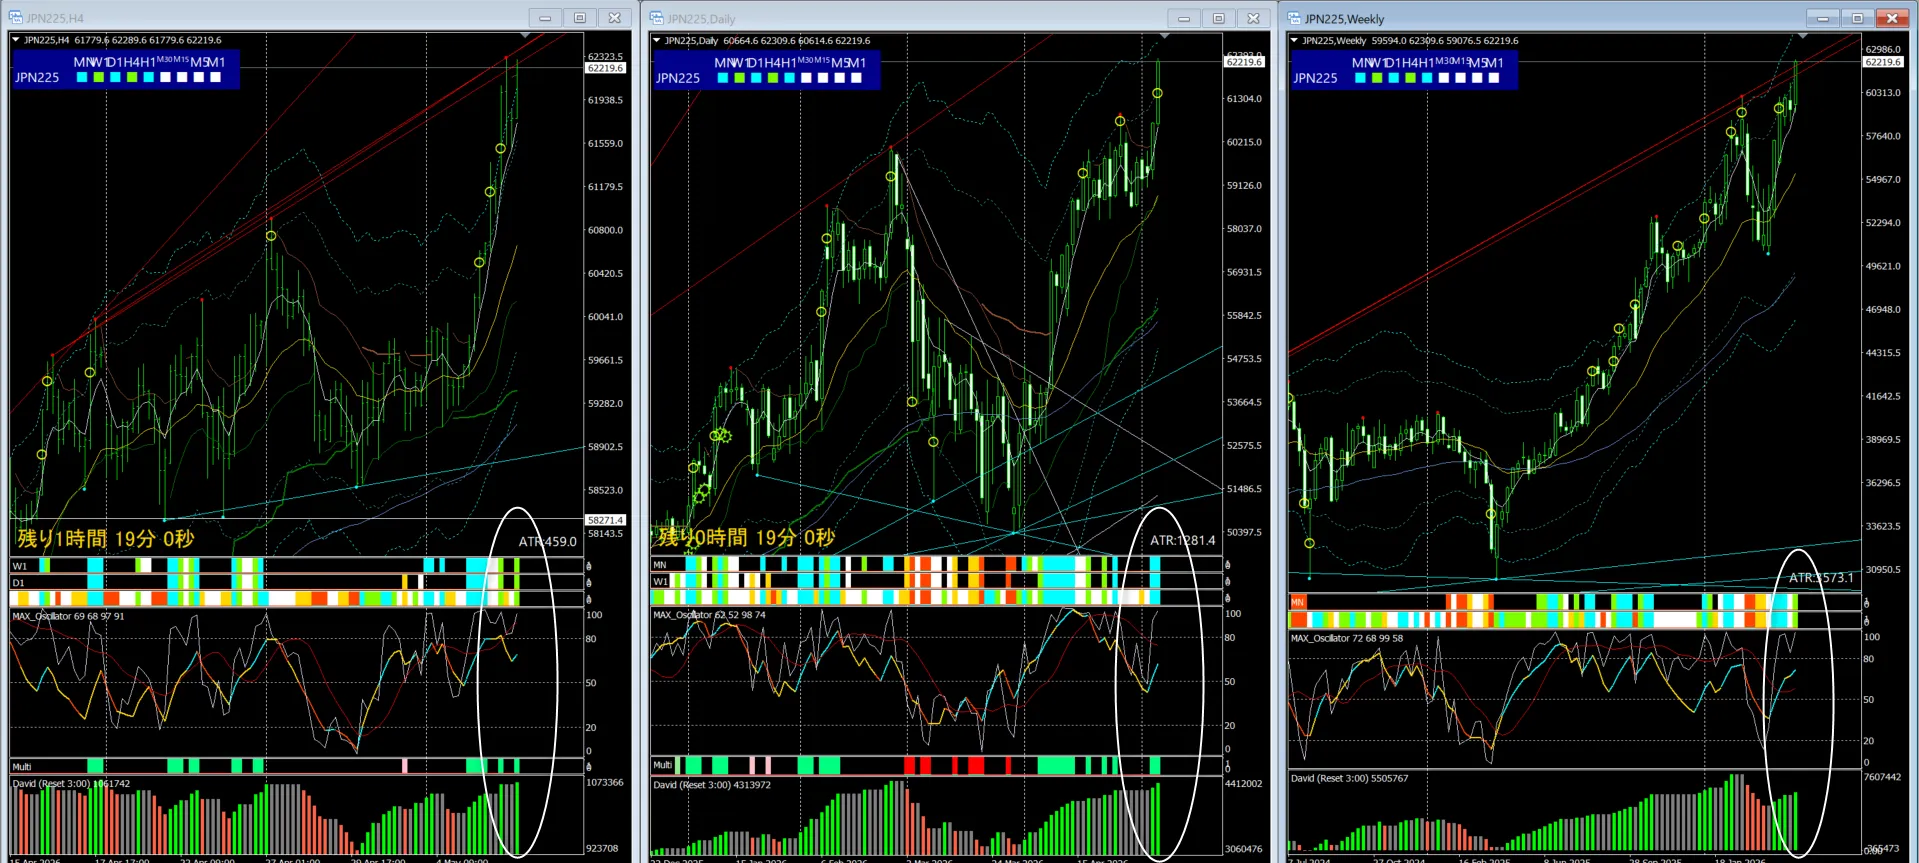
※ In the near term, prices will rise, but beware over-committing
Signals on both weekly and daily charts are bullish
Show considerable strength.
However, the MK channel deviation on the daily chart is close to 3x
Be cautious about chasing
Other than that, no particularly dangerous signs, so is a pullback buying approach reasonable?
Consider the potential impact of sudden changes in Iran situation
Price movement can become extremely volatile depending on the time period
If you think it's risky, it's better to exit quickly, and risk management is essential
Caution remains necessary.
Do not ignore near-term moves; maintain flexibility to respond to short-term waves
Be especially careful of sudden, unexpected changes!
Notes
Volatility is quite high, so pay careful attention to money management.
Notes
This is analysis commentary on the current situation by the original indicator, and and does not recommend buying/selling or guarantee future movements.