

[1-hour chart trading validation] Chirou attempted trading using moving averages (MA)
Shirou here!
In order to support more effectively, I feel I need to understand the basics of FX more deeply, so I’m reviewing and re-inputting things like
- the properties of Dow Theory
- the characteristics of moving averages
and so on.
This time I tried trading with moving averages from yesterday, so it’s also for me, but I’d like to share it.
I hope this serves as a reference for how moving average lines can be used.
Moving Average Trade
The method is as follows (SMA will be discussed later).
- Moving averages used: daily chart, 4-hour chart, 1-hour chart, each SMA20
- If a double bottom or double top forms on the 1-hour chart, enter from the neck
- Nearest high 1:1
Enter in line with the slope of the moving averages on the daily and 4-hour charts.
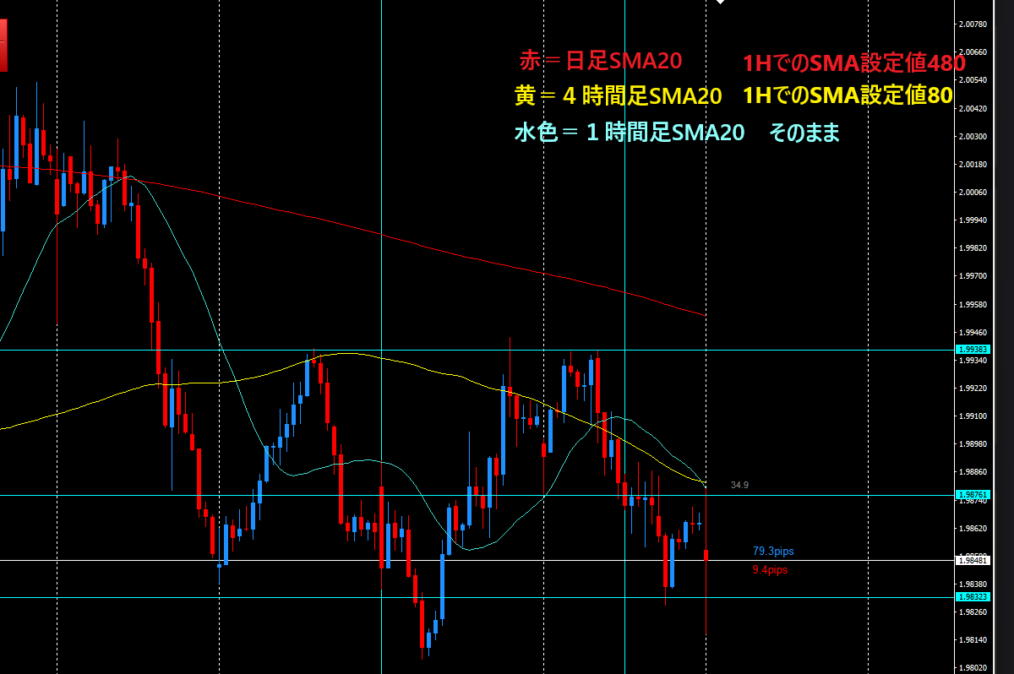
While glancing at yesterday’s chart, the SMA on the EURNZD daily and 4-hour charts looked reasonably tilted.
This is how the chart looked to me.
When I looked, I was right at the entry point marked with a circle.
The reds and yellows (daily and 4-hour) were nicely tilted, and on the 1-hour chart a double top was forming.
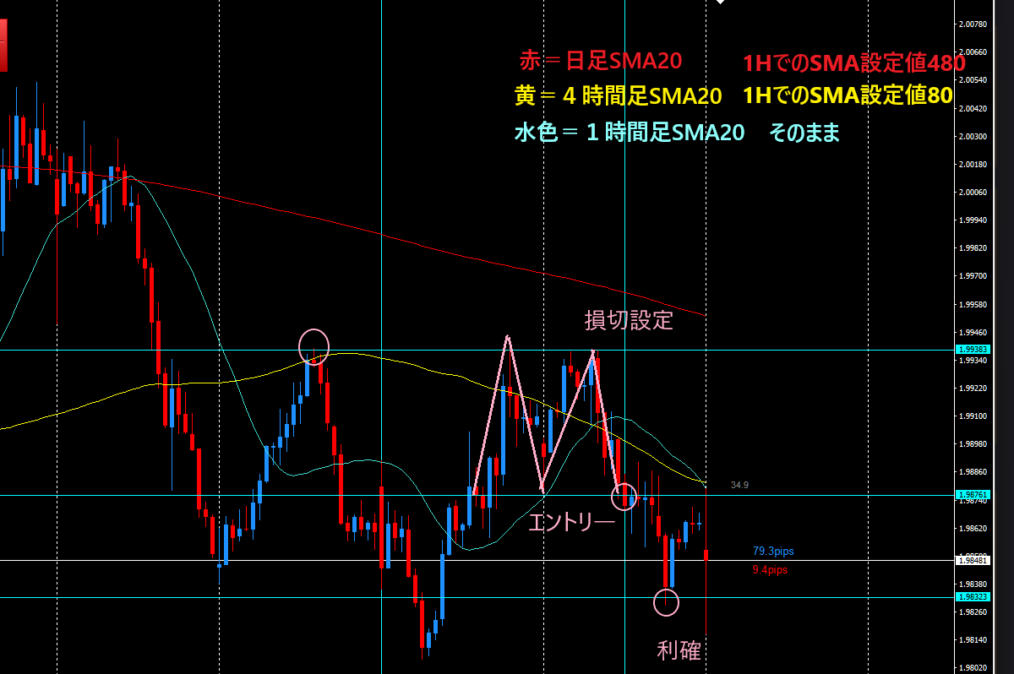
There was a bounce off the most recent high (left circle), giving the impression that the upside was heavy (resistance was in effect).
The right peak of the double top was lower than the left, indicating selling pressure.
It had just broken above the neck line. I placed the stop on the right peak and took profit at 1:1.
(In reality, for some reason it was TP a bit higher)
Actual data
| Entry time | Type | Amount | Currency pair | Entry price | Stop loss (S/L) | Take profit (T/P) | Settlement time | Settlement price | Fee | Swap | Profit in PIPS | Profit amount | Magic number | Comment |
| 2026.05.05 12:26:01 | Sell | 0.01 | EURNZD+ | 1.98765 | 1.99384 | 1.98328 | 2026.05.05 18:38:52 | 1.98328 | -9 | 0 | 43.7 | 406 | 0 | [tp] |
About SMA
There is much debate about EMA vs SMA for the 1H, 4H, and daily charts, but either should be fine.
Basically, from any site or textbook you will see
not fighting the 20 directions allows for a rough environmental recognition
So I’ve input SMA20 for 1H, 4H, and daily on the 1-hour chart.
Moreover,when the moving averages (such as EMA, SMA20) are properly tilted, the trend is clearly in that directionand this view is overwhelmingly common, right?
With the daily and 4-hour directional cues in place, if there are timing opportunities on the 1-hour chart for buy-the-dip or sell-the-rally (e.g., W-bottoms, W-tops), that alone provides a high level of edge.
Since I had the chance, I also added oscillators and oscillator DX.
Verification on Heaven and Earth Charts
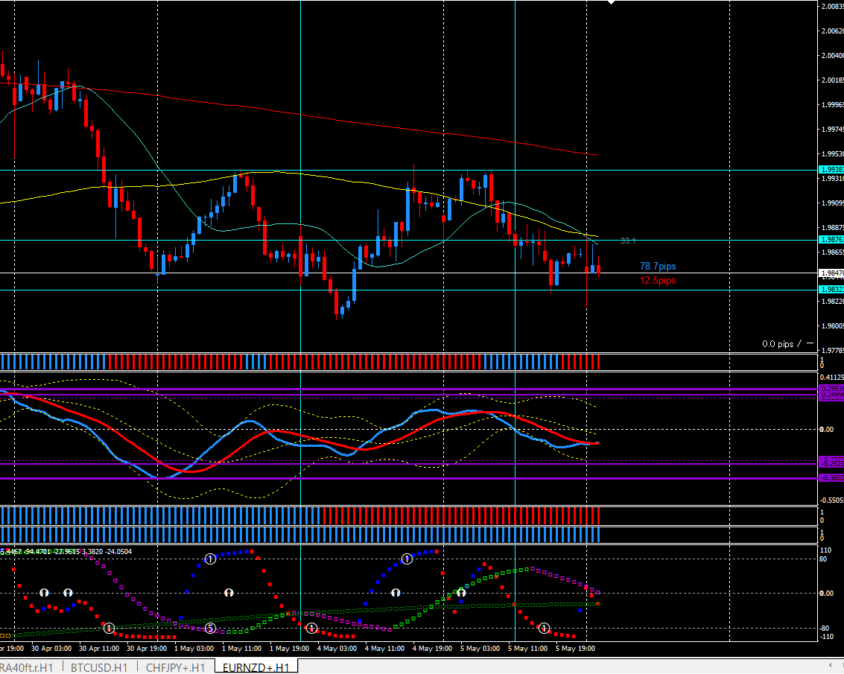
The histogram is ordered from top to bottom: 1-hour chart, then 4-hour chart, then daily at the bottom.
The oscillator is LV2.
The response is strongand TF2 switches frequently, so entry points for a trend-following strategy are hard to pinpoint.
The entry near the double top seems best with Oscillator DX cross.
Entries from Oscillator DX cross can be slightly delayed.
However, as shown in the image, it tends to be a reliable entry after the double top forms, so post-cross entries are indeed solid and very good.
The previous peak also presents a sign ⑤ and a clean downward cross of the Oscillator DX, so it can serve as an entry trigger.
This article ends here.