
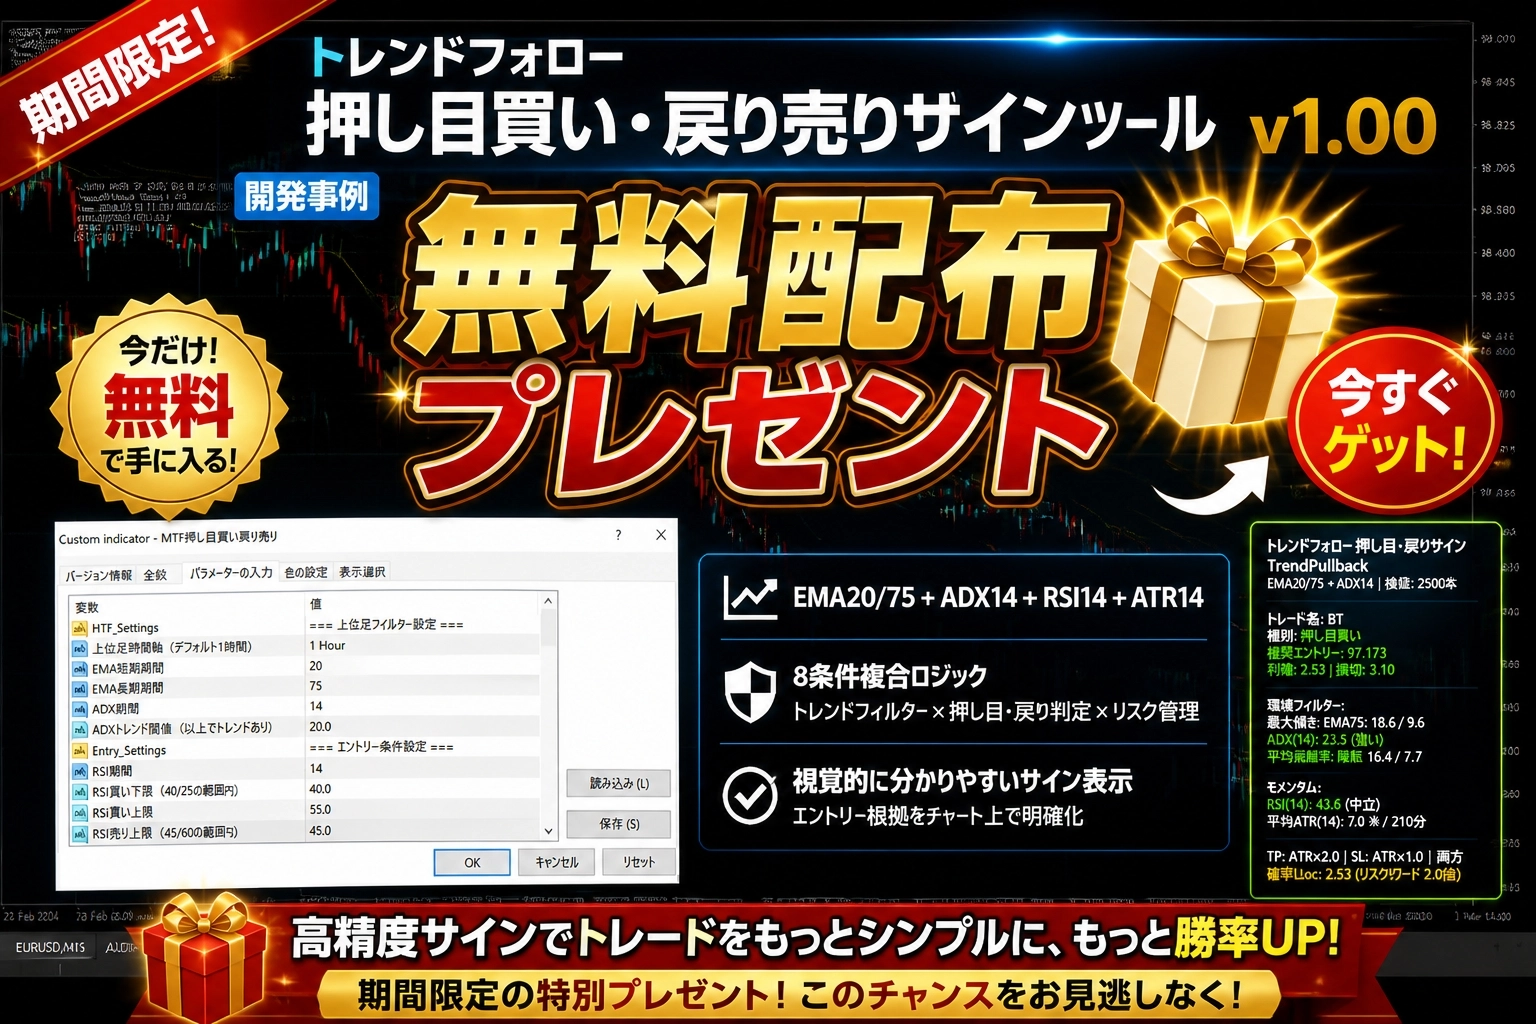
Free distribution: EMA20/75 + ADX + RSI aiming for "trend-following pullback buying and retracement selling signal tool"
This time, I’m planning to give away for free the trend-following pullback buy and pullback sell signal tool (for MT4) that I always use.
Many people feel that even paid signal tools don’t win at all… I was the same. That’s why I decided to distribute a tool whose logic can be clearly explained and that you can use with confidence.
Tool Logic (everything will be disclosed)
There’s nothing scarier than a black-box signal tool, so I’ll disclose the logic first.
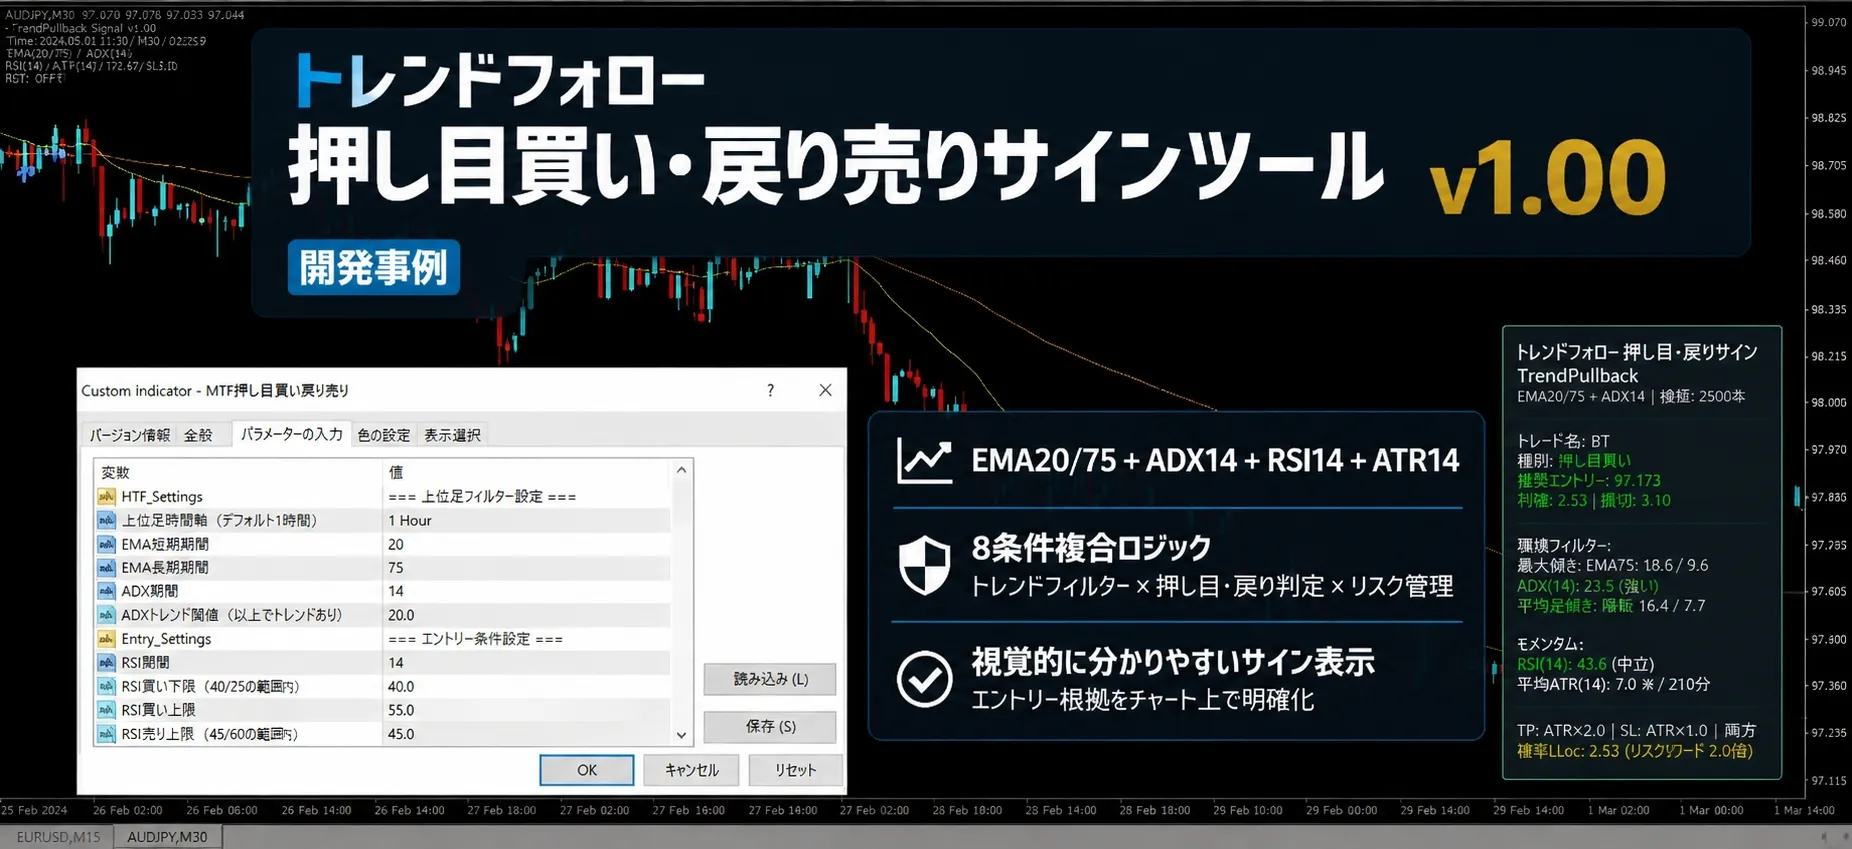
Upper timeframe (1-hour) determines the trend → lower timeframe (15-minute) catches pullbacks and pullbacks, a classic multi-timeframe setupthat’s how it works.
The conditions for a buy signal are simple,
1-hour: EMA20 > EMA75, price above EMA75, ADX14 above 20 (indicating an uptrend)
15-minute: EMA20 > EMA75, price touches EMA20 (pullback), RSI14 at 40–55 (rebounds from oversold), bullish candle confirmed, breaks recent high
Only when all of these align will an arrow appear.
Sell signals are the reverse conditions.
The flow is: confirm trend strength with ADX → wait for a pullback to EMA20 → gauge depth with RSI → confirm with a high break, so you can explain to yourself why the signal appeared now.
ATR is also displayed at all times, so you can use the same for your stop-loss width as well.
Who I want to use this tool
- People who want to profit steadily with a trend-following approach
- People who want swing trading on 15-minute to 1-hour timeframes, not scalping
- People who want a tool whose logic they can understand
- People who want to graduate from simply entering as arrows indicate
No repaint, candle-confirmed, supports alerts and push notifications.
Download method
Click below on “Read more” to receive the download link for the EX4 file.
Just place it into the MT4 Indicators folder and apply it to a 15-minute chart to use.