

NK225 Futures MTF Dow Theory Analysis Report 2026-05-05 6:42
NK225 Futures MTF Dow Theory Analysis Report
1. Trend Table
●=Hold / ✕=Close price break / ↓=Bearish transition on break below / ↑=Bullish transition on break above
2. Key Price Ranges
3. 4H Analysis
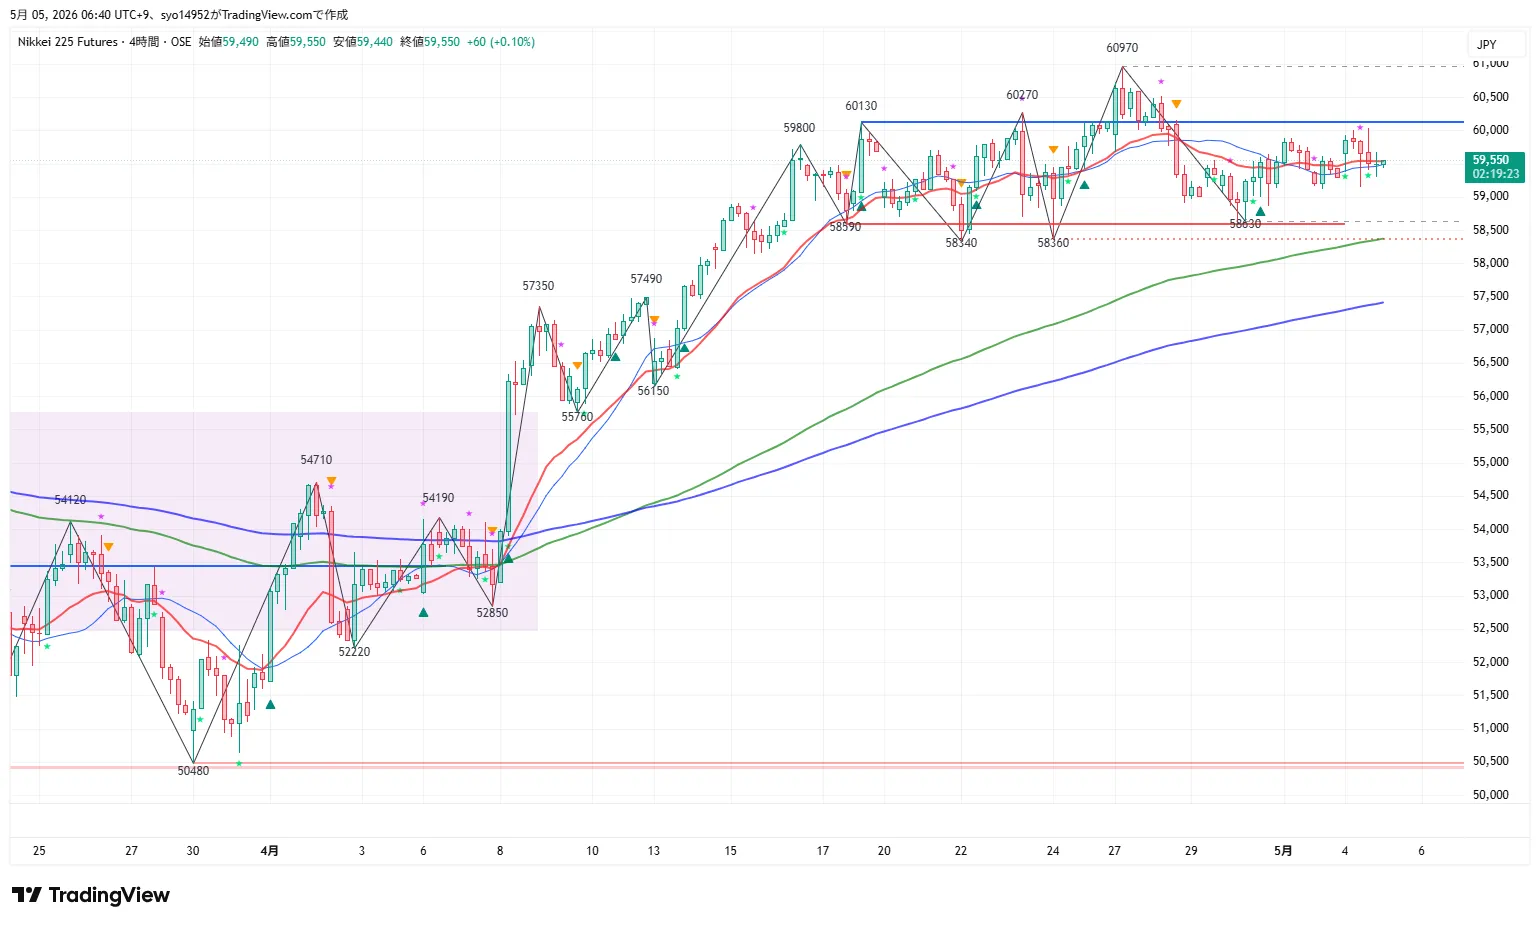
【4H / SW3 / Upward】
The 4H remains in an upward trend and upward wave. 58,360 serves as a pullback low, sustaining the macro upward structure.
However, it has not reached the 60,970 high, and has not clearly broken above the 60,130–60,270 resistance band.
Overnight, it retraced near 60,040, then plunged to the 59,300s, currently rebounding to 59,550. The 4H remains upward, but this is seen as a choppy adjustment within a high-price range.
4. 1H Analysis
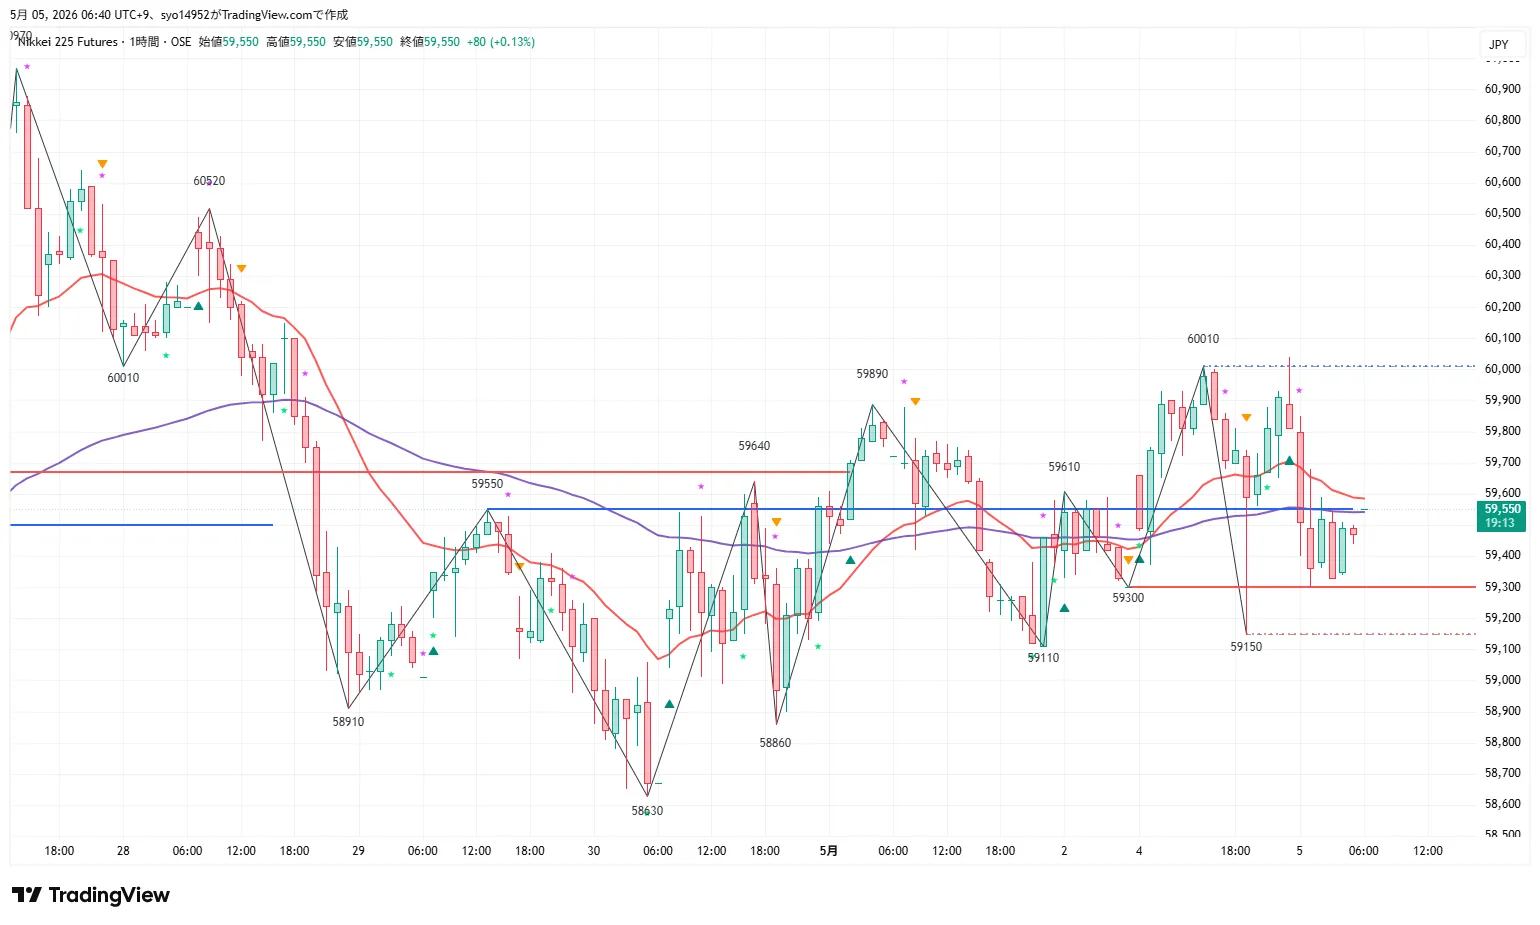
【1H / SW2 / Flat & Upward Wave】
The 1H shows flat, but the wave is upward. Structure is upheld with 59,150 as pullback low.
After a drop from 60,010, it halted at around 59,300 and retraced to 59,550.
However, until the 59,610〜59,720 close recoveries, the upward resumption on the 1H remains unconfirmed. A break below 59,150 would weaken the 1H upward wave.
5. 15m Analysis
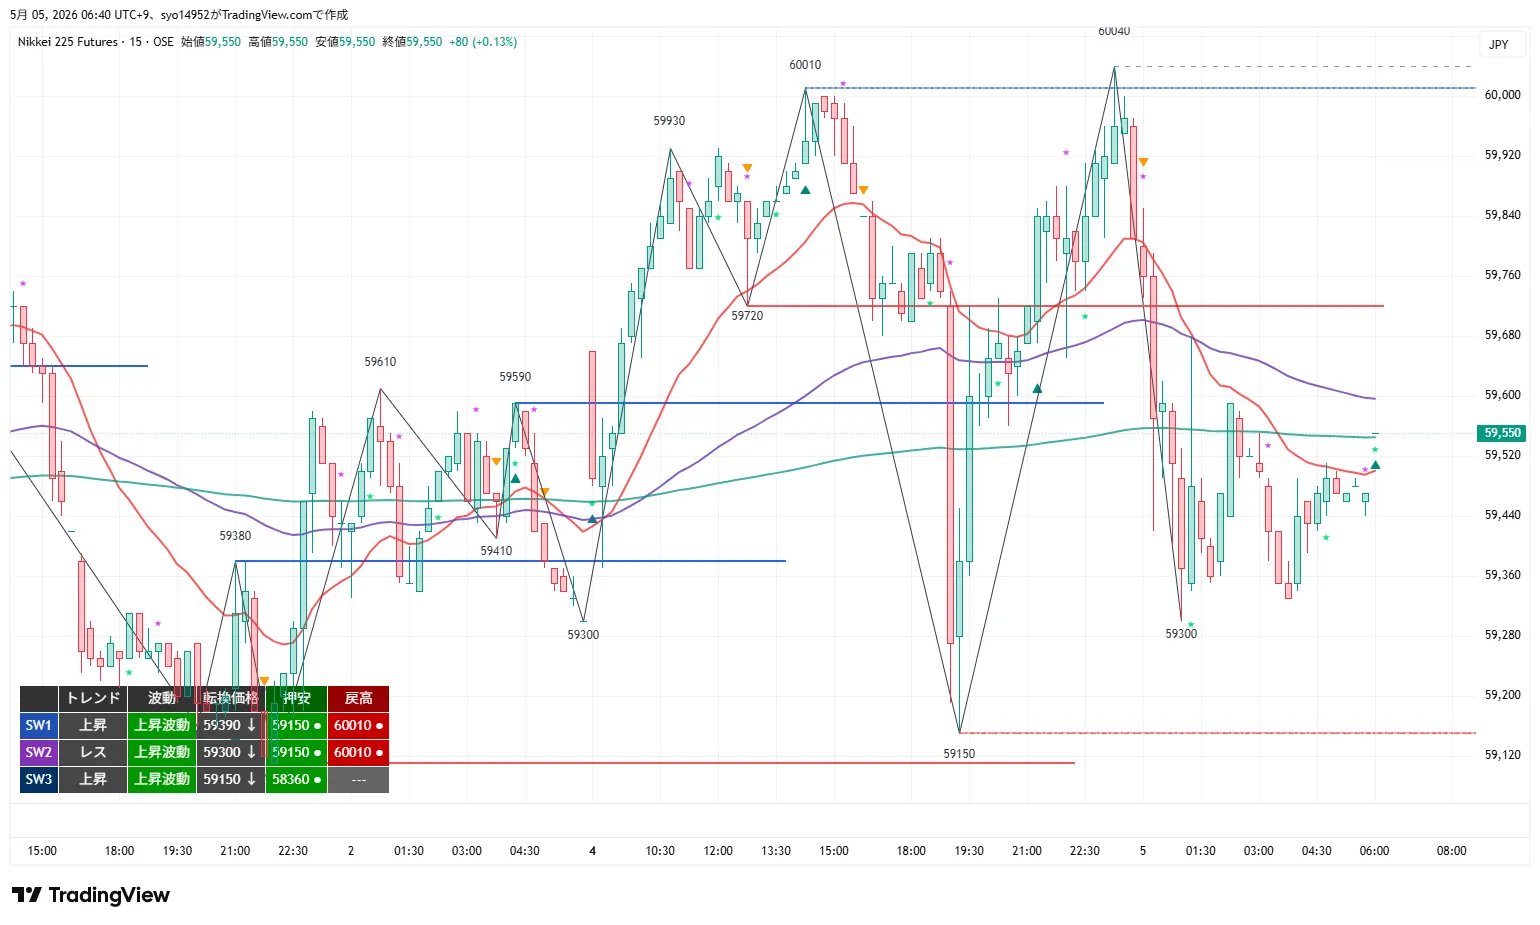
【15m / SW1 / Upward】
The 15m shows an upward trend and upward wave. After a night drop to around 59,300, it rebounded to 59,550.
Currently near the 20EMA, the key is whether it can break above 59,590–59,610 for a short-term focus.
If it recovers 59,720, the rebound continues; surpassing 60,010 would clarify the short-term up move. Conversely, a break below 59,390 means a failed rebound, and breaking 59,150 suggests downside momentum.
6. Conclusion
As of 6:42, the 4H remains upward, the 1H is flat but upward, and the 15m is in an upward regression. The macro trend is upward, but the short-term focus is whether it can break the 59,590–59,720 pullback selling zone.
- Upward:A close above 59,610 sustains a short-term rebound; a recovery above 59,720 favors the upside; above 60,010 confirms a renewed rise.
- Downward:A break below 59,390 on a close breaks the 15m rebound and 1H/4H downside risk increases.
- Macro:As long as 58,360 is held, the 4H upward structure remains in place.
- Current Assessment:A pullback rebound is in progress, but still below the upper resistance zone. Prioritize break confirmation over adding on dips.
7. MTF Coherence
Macro remains upward. However, not yet above 60,970, staying in a high-price range.
With 59,150 as the pullback low, the upward wave remains intact. Recovery to 59,720 clarifies the upside.
Short-term rebound underway. Breaking through 59,590–59,610 is the first hurdle.
MTF coherence is improving to the upside. However, 1H is still showing as flat, so full upward alignment cannot be claimed until 59,720 is recovered.
8. Trade Ideas
- Close above 59,610 on a daily close
- Recover and hold above 59,720
- After a pullback in 15m, resume higher
- Confirm upside potential toward 60,010
Target Range:59,720 → 60,010 → 60,130
Invalidation Line:Close below 59,390
- Failed to break above 59,610
- Close below 59,390
- Observe pullback selling pattern
- Look for downside toward 59,150
Target Range:59,300 → 59,150 → 58,860
Invalidation Line:Recover with a close above 59,720
9. In-Position Invalidation Lines
Invalidation Line:Close below 59,390
As the momentum of the 15m upward wave wanes, consider exiting or scaling back.
Invalidation Line:Recover with a close above 59,720
If the pullback selling band is surpassed, consider exiting as upside momentum strengthens.
10. Current Action
As of 6:42, after an overnight plunge, a rebound is underway. The 15m is in an upward regression, but has not clearly broken through the 59,590–59,610 resistance band.
New longs should wait for a close above 59,610, or a pullback confirmation after recovering 59,720.
Shorts can be considered after a break above 59,610 fails and a move below 59,390 occurs. Do not tilt to strong downside until breaking below 59,150.
11. Cautions
The 4H maintains an upward structure, so the macro trend remains not bearish.
However, due to the sharp drop from 60,010, upside pressure is evident, so avoid chasing highs on morning rebounds.
Decide after confirming whether 59,610 is breached or 59,390 is broken.
12. About This Report
This report analyzes NK225 futures using the Dow Theory Indicator across 4H / 1H / 15m timeframes.
We organize market context, key price levels, and trading ideas based on closing-price swing structure, pullback lows, retracement highs, and transition prices.
※This report is for information purposes, and investment decisions are the reader's responsibility.
#Nikkei225 #Futures #MTFAnalysis #DowTheory #MarketContext #Nikkei225 #Futures