Utilizing the “Visualization Indicator” (Part 249)
「Visualization Indicator」 Usage(その249)
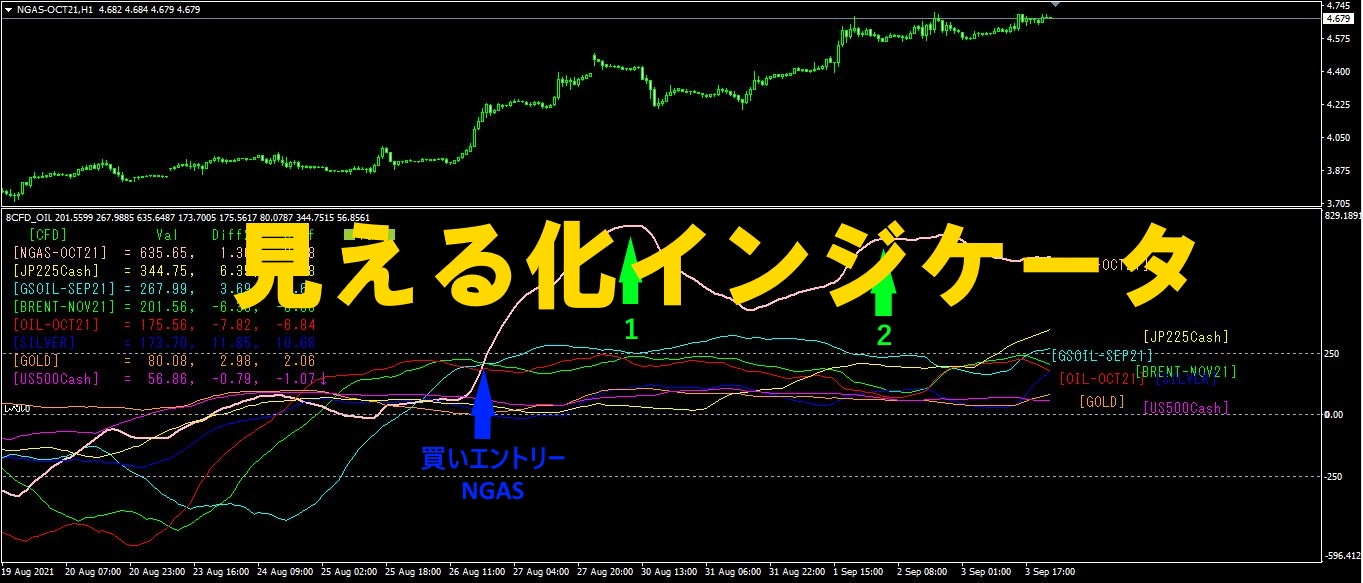
1. Evolution of “28 Currency Pairs List Indicator” into an enhanced indicator
“8CP Visualization Indicator”) to draw USDJPY on the chart
“8CP Visualization Indicator” includes Oceania version,
London version, NewYork version, AnyCP version exist. This time we used London version.
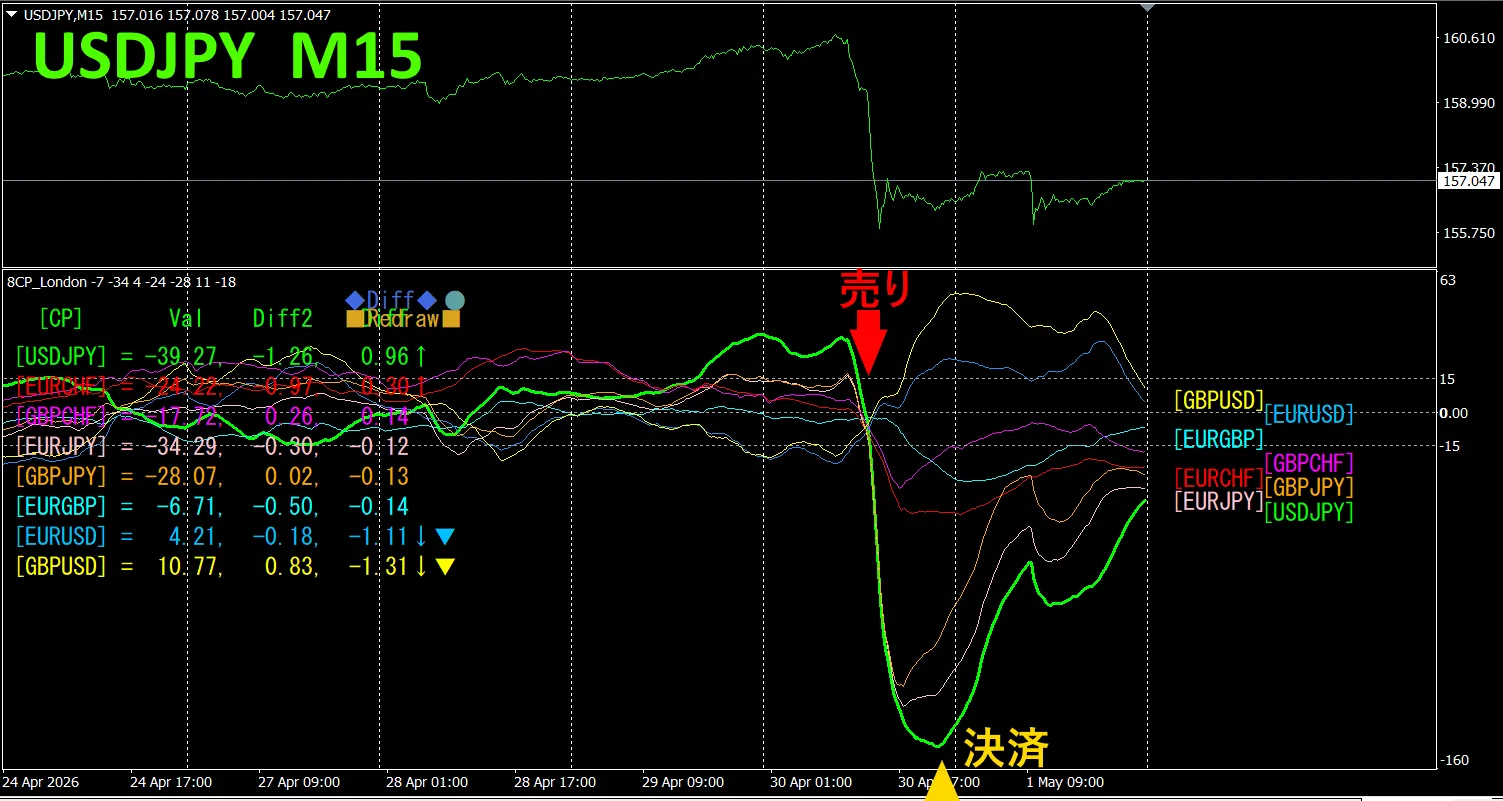
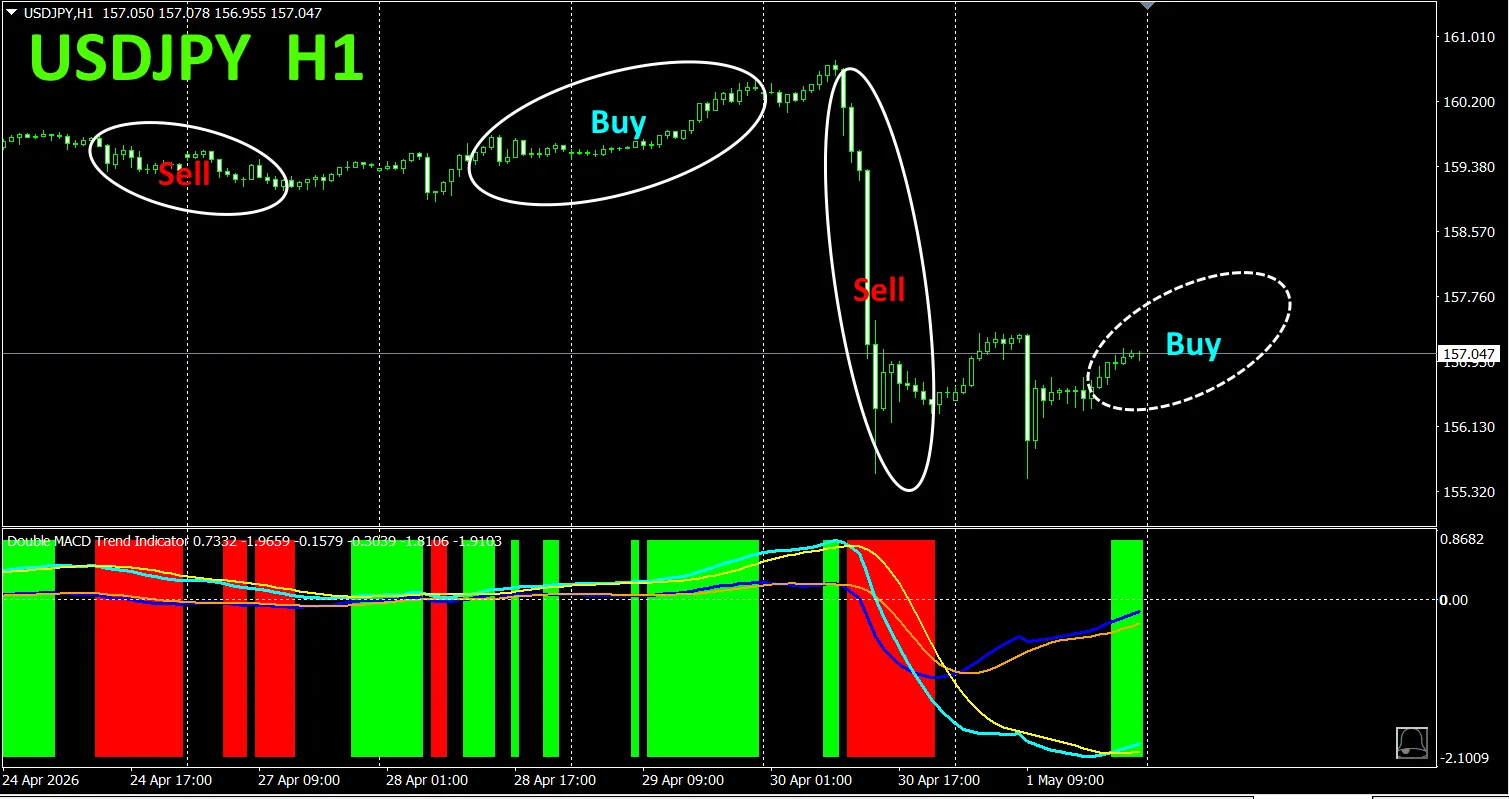
The upper half is USDJPY 15-minute chart. The lower half is based on the “8CP Visualization Indicator”. The green thick line graph corresponds to USDJPY
On Thursday, USDJPY stock dropped below other graphs, so we sold. Closing at the intraday bottom 280 pips of profit. However, due to a sharp drop, capturing all of it would have been difficult.
This chart drop was caused by The intervention size is about Interventions had some effect, but in the long run the yen is likely to weaken further.
Currency Strength-Wind Diagram
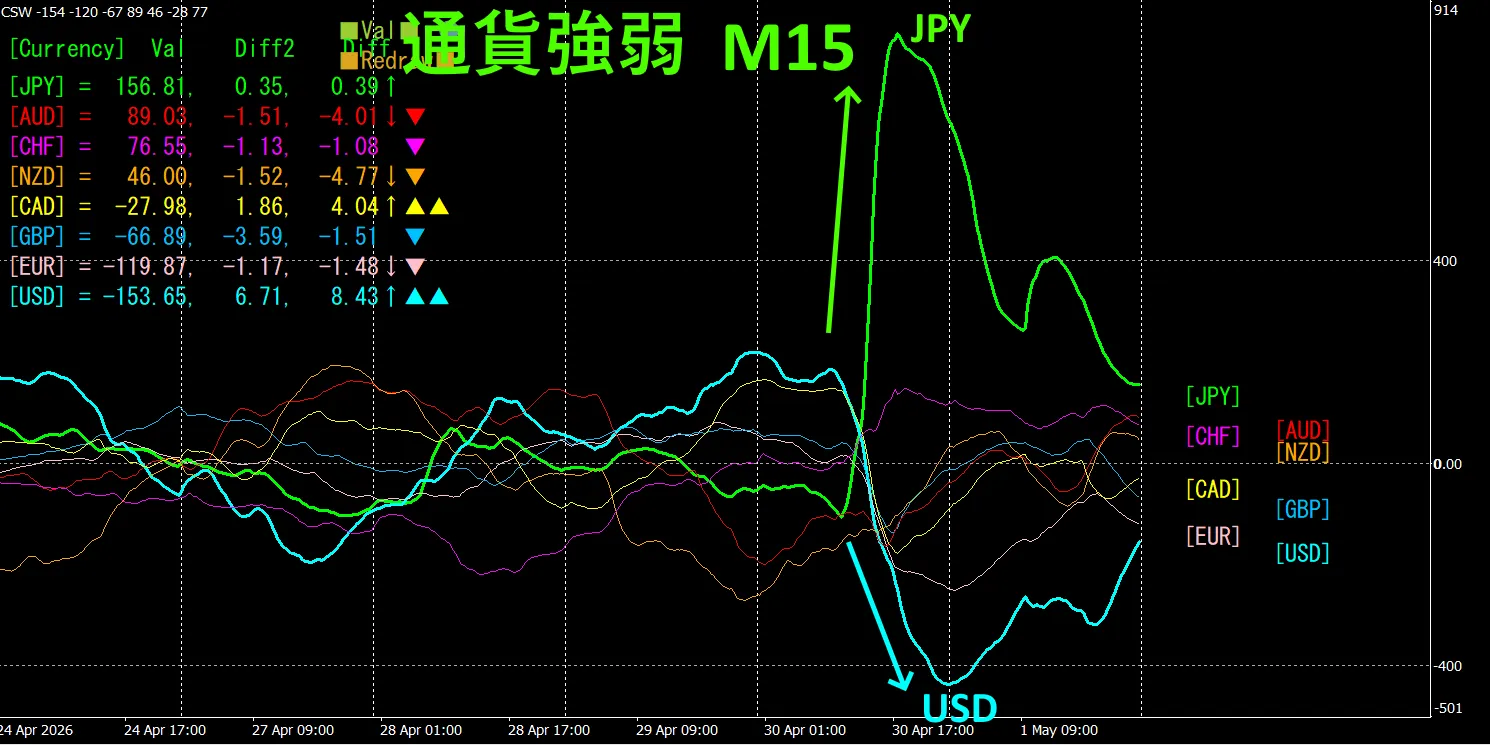
Looking at the 15-minute currency strength graph shows USD and JPY moving in an inverse correlation.Trade only when USD/JPY spreads out (expands).Because they are in inverse correlation, target only those points for trading.
In FX, you should pick the currency pair that is currently growing the most and showing inverse correlation; results will follow.
“Trade the Currency Strength Reversal!” is a fundamental rule in FX.
Using “TrendLine-EX” allows you to automate entries and exits by diagonal trendline breaks. It can be left as is for easy trading. “TrendLine-EX” enables automatic selling on a break below a trendline and automatic exit on a break above a trendline, functioning as a semi-automatic EA.
2. Try Best Select Indicators
Below is a screenshot dated
[Total]
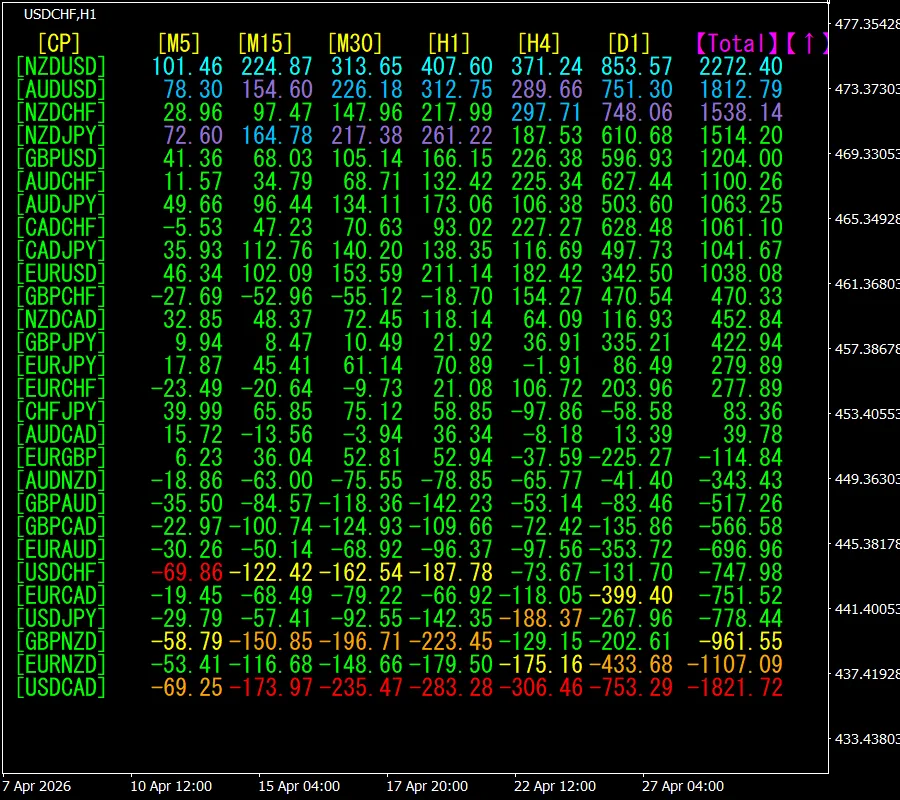
Now, let's look at the NZDUSD chart.
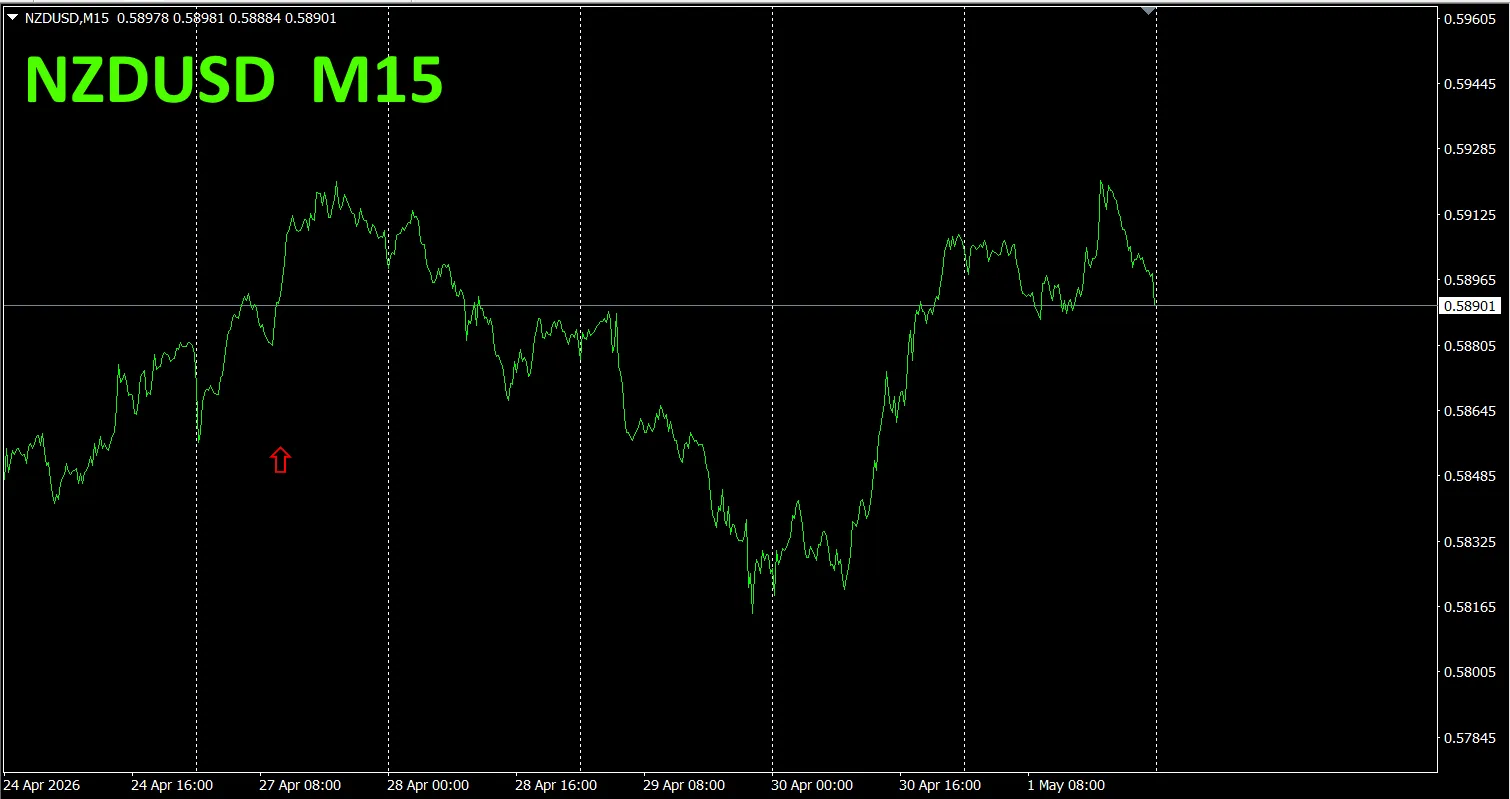
The red arrows mark the captured screenshot location.
“28 Currency Pair Best Select Indicator”
“28 Currency Pair Best Select Indicator”

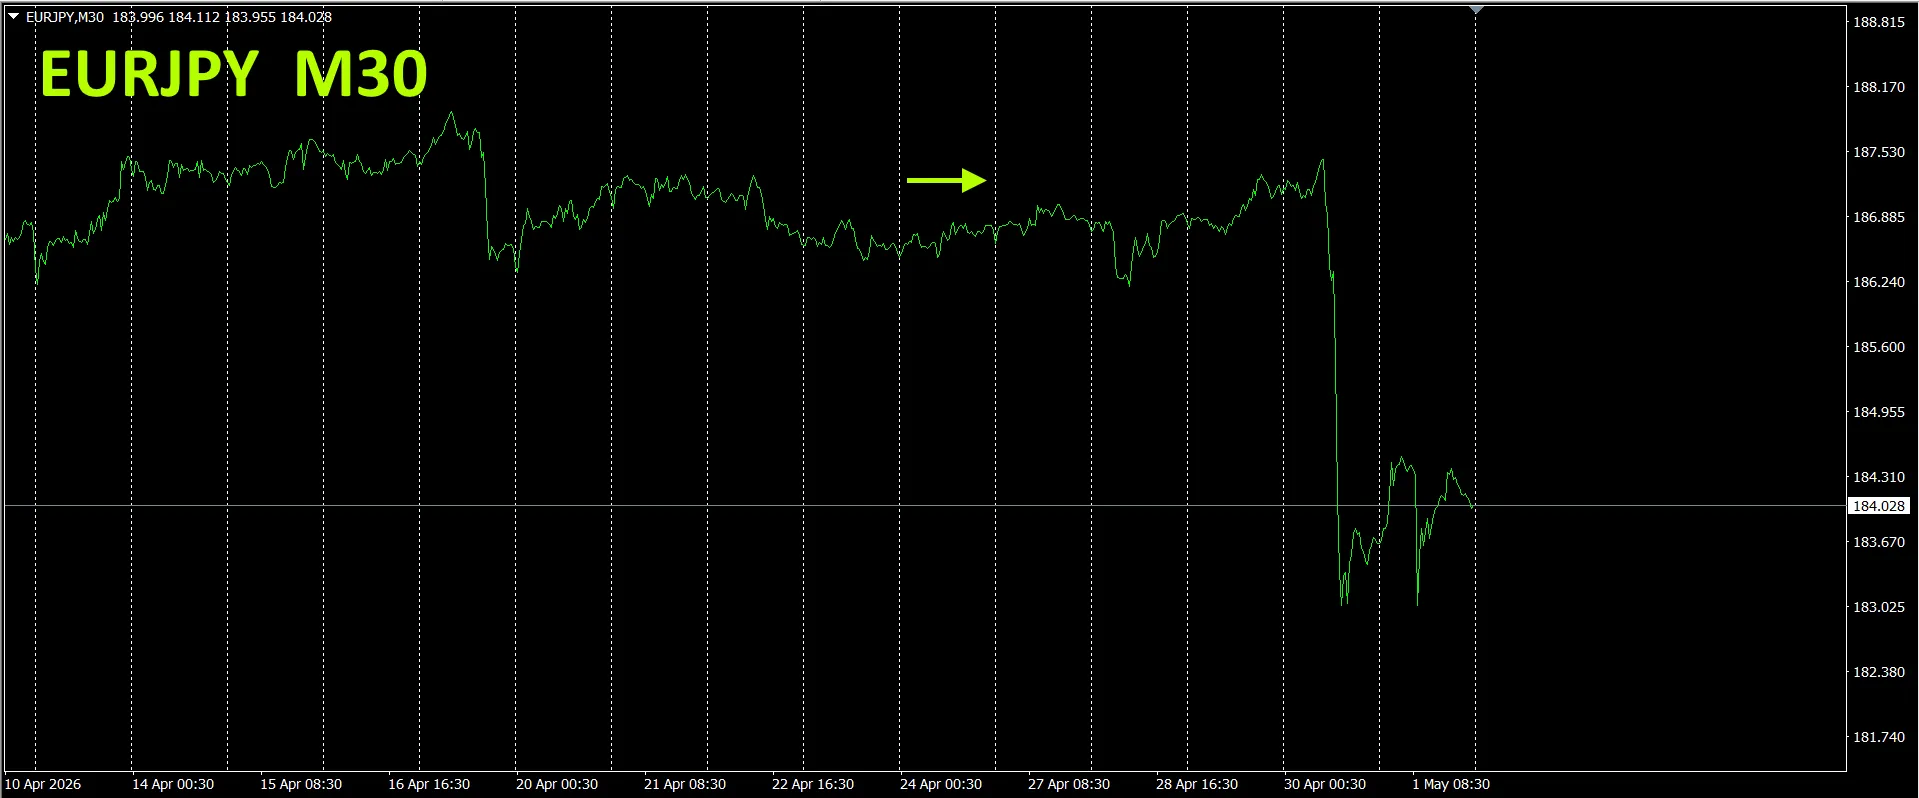
3. Since May 2021 we have tracked EURJPY movement.
From May 2021, we have been tracking EURJPY.
To view the overall trend, we chart roughly three weeks on a 30-minute timeframe.
Previously we wrote the following:
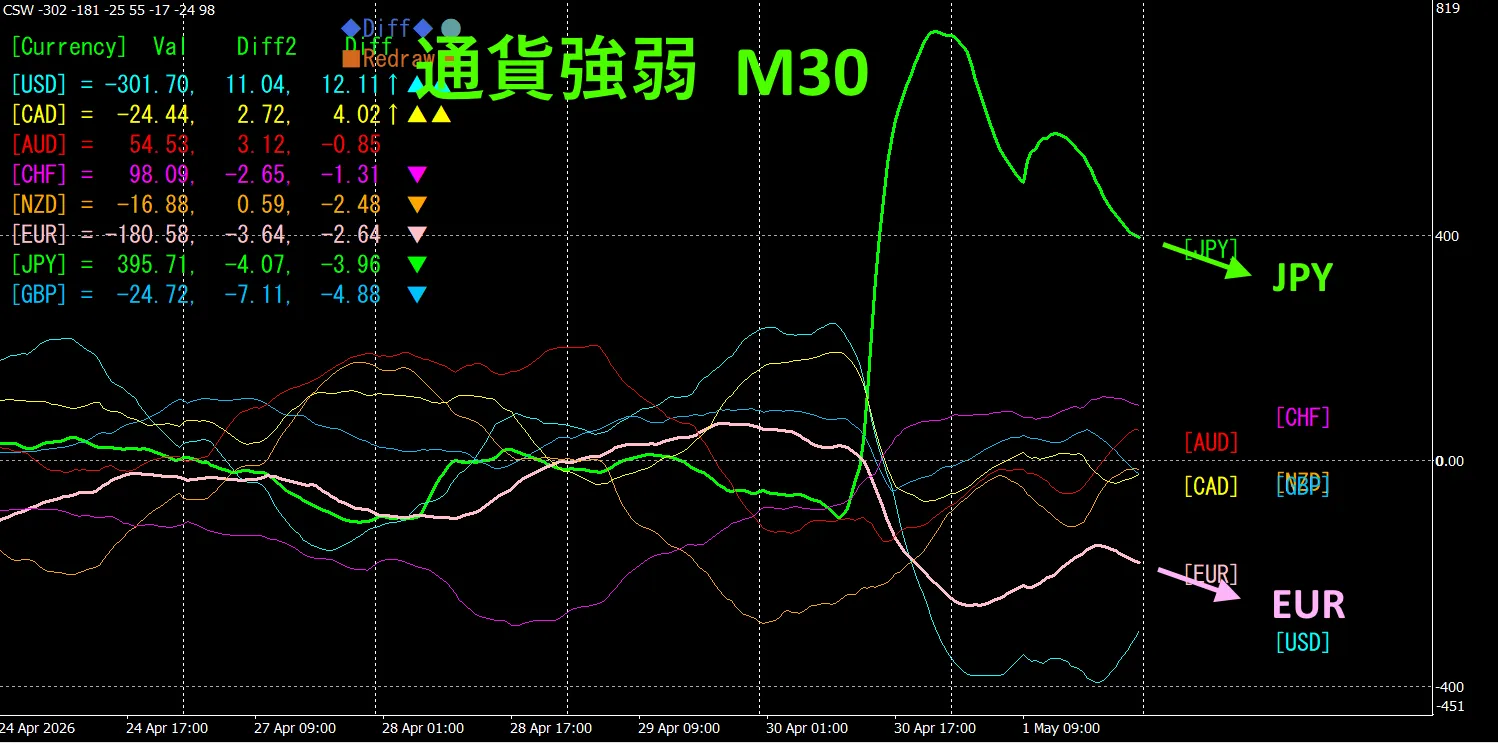
30-minute currency strength chart.
Pink is EUR, green is JPY. The currency interventions caused large fluctuations. The vectors point slightly downward for both, showing no clear direction. JPY may drift lower due to rebound after a sharp rise, but EURJPY is likely to stay in a range for a while.
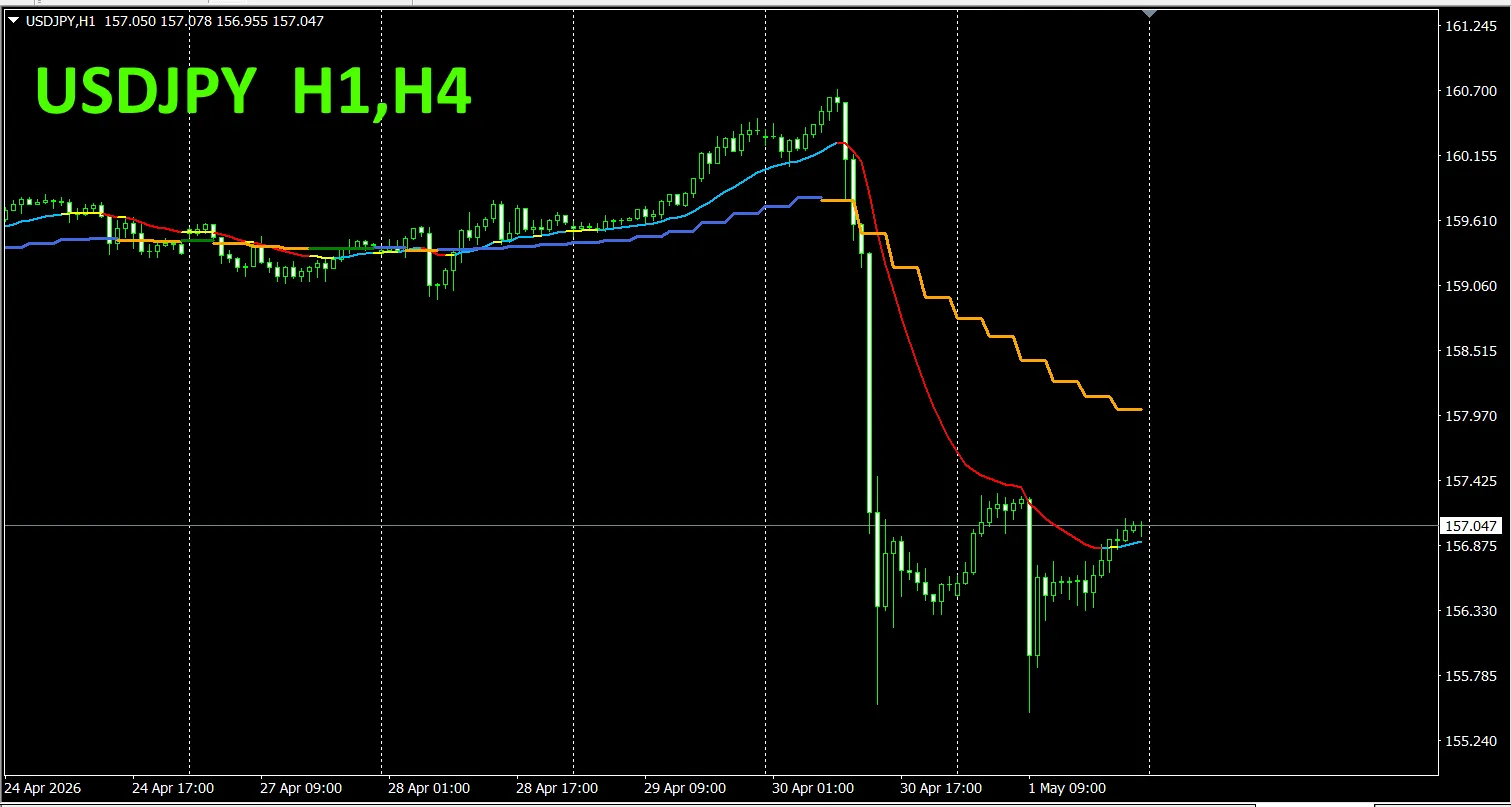
I have introduced this indicator to USDJPY on the 1-hour chart.