

[May 1] "On days of doubt, the one who can wait is strongest."
0
I think that days when the line of sight isn’t clear are the most troublesome.
I used to enter trades simply with a vague feeling of “maybe this is a good time to sell,” and would find myself moving my stop-loss. When the chart lacks a solid basis, the mental strain becomes too much.
Today’s GOLD is precisely one of those days. Since the numbers don’t show a clear directional momentum, in today’s article I’ll explain the reasons and share reference lines you can use.
Today's Market Situation
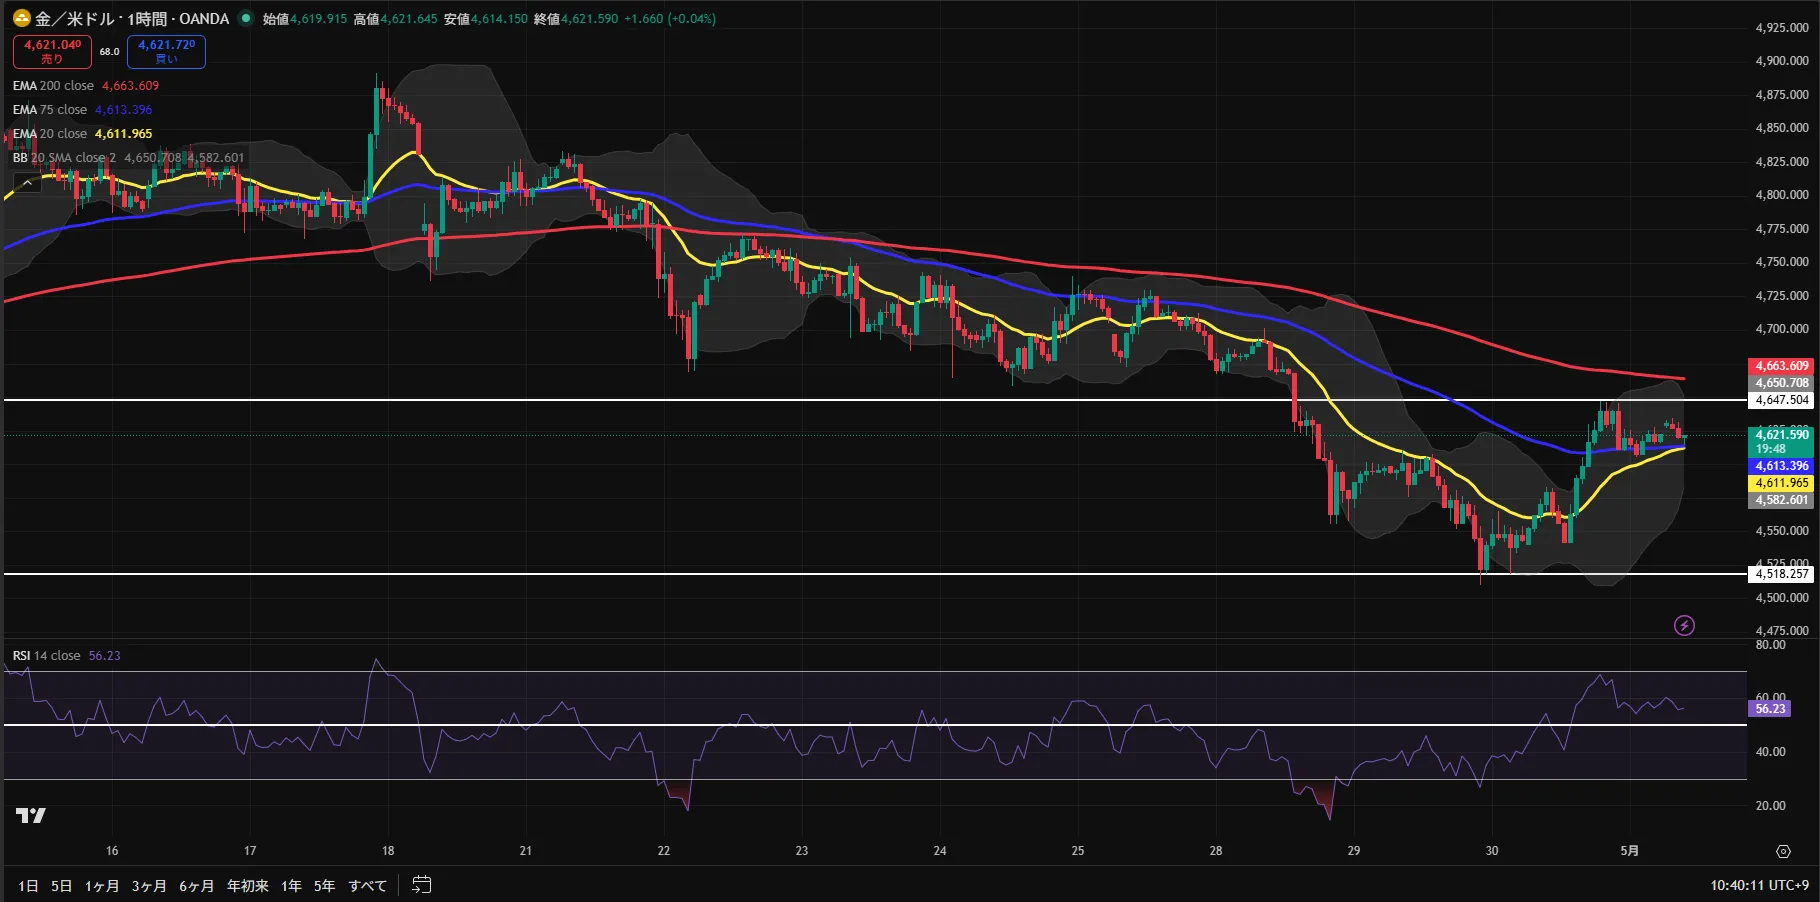
The current price is hovering around $4,621.
Looking at the 1-hour EMA (moving average), EMA20 (short-term) is 4,611.965, EMA75 is 4,613.396, and EMA200 is 4,663.609, forming a downward sequence from short-term to long-term. Meanwhile, the RSI (overbought/oversold indicator) is 56.23, above 50, indicating buying momentum in terms of strength.
In short, the chart shape is bearish while the momentum is bullish, a split between direction and strength. On days like this, the basis is thin, and whichever direction the price moves, one can retrospectively claim “that’s how it was.”
On the 4-hour chart, the EMA remains in a down sequence (EMA20 at 4,615.614, EMA75 at 4,681.454, EMA200 at 4,739.371), so the major trend remains downward. However, the 4-hour RSI is also around 48.70, nearly neutral, so no strong trend is present.
GoGo Taro’s View
This article reflects an individual analysis and is not investment advice or solicitation. Please make buy/sell decisions at your own risk.
If the current price falls below the 1H EMA20/EMA75 (around $4,612) and RSI turns below 50, I expect selling pressure to intensify. In that case, a move toward the previous day’s low near $4,518.26 may unfold.
On the other hand, if the current price clearly breaks above yesterday’s high of $4,647.50, a short-term rebound could accelerate. In that case, the next potential resistance to watch would be near 1H EMA200 (4,663.609).
Either way, the current position is in a “neither” state. I myself believe today isn’t a day to force a trade.
Today’s Reference Lines
There isn’t a clear point meeting RR1.5 today, so I will skip entering. Below are for reference only.
This article represents personal analysis and is not investment advice or solicitation. Please trade at your own risk.
▼ Short (mean reversion)
Reference zone: $4,608–$4,618 (basis: 1H EMA75)
Reference take-profit line: $4,520 / Reference stop-loss line: $4,670
Expected RR: 1.6 (below target / personal judgment)
Because RR is in the 1.5 range, proceed with extra caution. Be sure to check your stop-loss settings.
*These are educational reference values. Make your own actual trading decisions.
Important Lines
Resistance: $4,650 (basis: previous day’s high)
Support: $4,610 (basis: 1H EMA75)
Support: $4,610 (basis: 1H EMA20)
Support: $4,520 (basis: previous day’s low)
1H EMA200: $4,665 (this line currently sits above the price; breaking above it could accelerate the rise)
Today’s Word
“Not moving on a day you can’t move is what protects your trades tomorrow.”
If this was helpful, a follow would be appreciated and encouraging.
Feel free to leave questions or impressions in the comments.
× ![]()