

【FX】 Three gentle explanations for why horizontal lines and trendlines are noticed
【FX】Three Reasons Why Horizontal Lines and Trendlines Are Observed, Explained Simply
This is Shiro!
For FX traders, horizontal lines and trendlines are said to be easy to observe.

What exactly is the reason why horizontal lines are observed?

I want to know why they are observed
In this article,
I will personally explain the reasons why horizontal lines and trendlines are observed in the first place
.
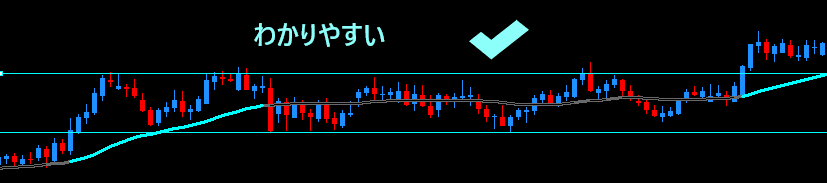
【FX】Why Horizontal Lines and Trendlines Are Observed
Horizontal lines and trendlines are easy to observe and help FX traders read the market.
For example
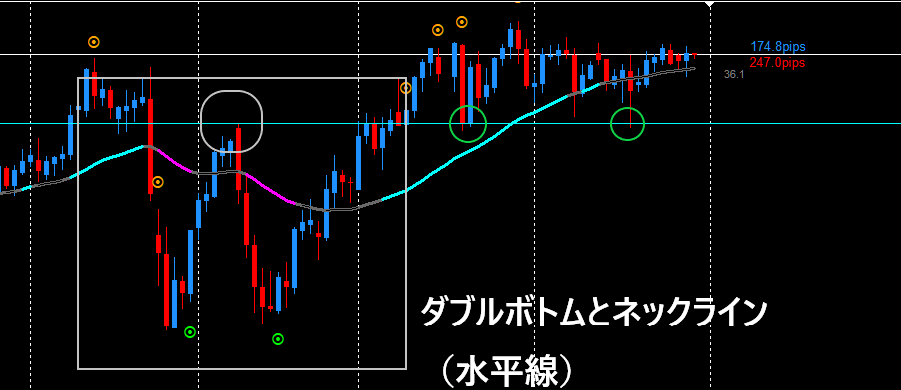
USD/JPY on a daily chart.
The neck line of the double bottom is watched (green circle).
So, why are they observed?
First, about the horizontal lines that are easy to observe
because orders tend to accumulate
.
In short, a horizontal line is like a chart’s“reserved seat that everyone is watching”.
To explain more intuitively, in three points.
1. There is a buildup of orders saying “if it comes this far, I want to do something”
On stock or FX charts, prices that have repeatedly bounced off a level (horizontal line) become a place many want to trade at“a place to take a position”.
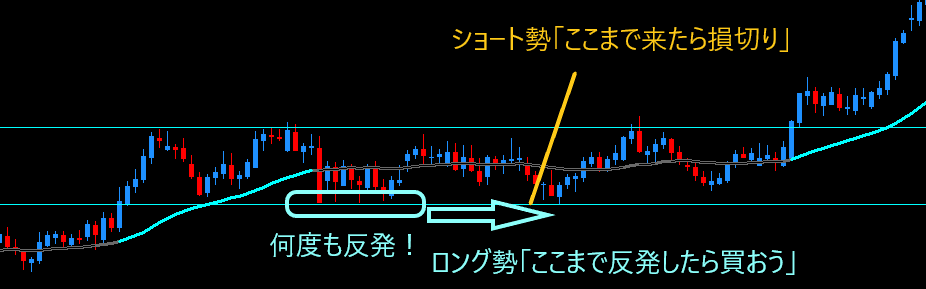
- People who want to buy
- “Because it rose here before (repeated rebounds!), if it drops to this level again I’ll buy (dollar-cost averaging)”
- People who want to sell
- “Because it stopped here before (repeated rebounds!), if it breaks past this, I’ll cut loss (buy back)”
- “Because it stopped here before (repeated rebounds!), if it breaks past this, I’ll cut loss (buy back)”
Thus, around the horizontal line,there isa large volume of orders waiting, so when the price approaches, it reacts strongly.
If buyers hold long positions, the market tends to rise.
If sellers cut losses, they will buy back what they sold, turning into a buy order.This is a buy-back.
Therefore, when buyers buy and sellers cut losses, the market tends to rise due to a synergistic effect
.
2. The market rules driven by “majority vote”
If there are many buyers, the market goes up; if there are many sellers, it goes down.
All professionals, amateurs, and AI around the world look at the same chart and think “this line looks strong,” so they all take the same action at once.
Because “everyone notices it, it ends up moving that way”, a kind of self-fulfilling psychology of majority vote is at work.
3. The psychology of “regret” and “relief”
For example, someone who thought “I’ll buy here but didn’t” will aggressively buy the next time the price comes back to that level. (Long)
Conversely, someone who sold at that price and was in the red will settle (buy back) as soon as the price returns, feeling “I’m saved” (Long).
Or, there are patterns where those who have sold gradually raise the price from a support line and then cut losses (buy back) when profits shrink.
Thishuman emotions of “frustration” and “relief”also generate energy to trigger buy/sell at specific prices (horizontal lines).
The difference and how awareness works for horizontal lines and trendlines
So, is there a difference in how horizontal lines and trendlines are perceived?
This is stillthat horizontal lines are stronger.
Trendlines can be viewed differently by different people, so their shapes change more easily.
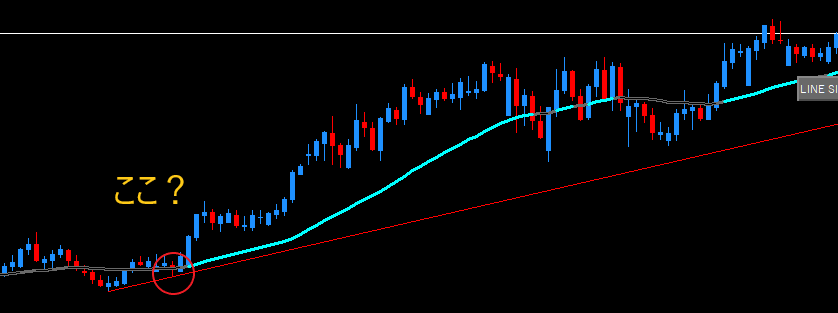
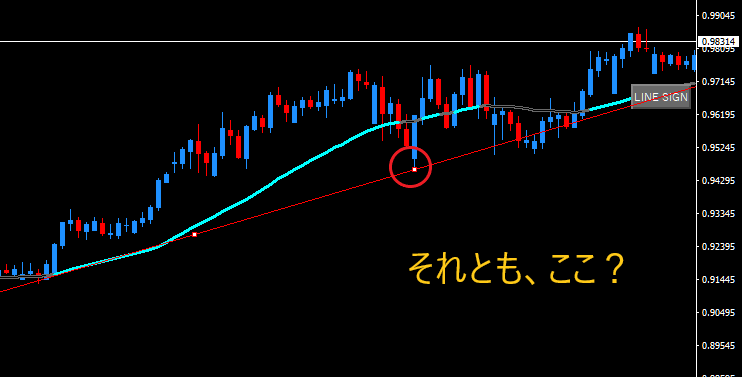
On the other hand,horizontal lines tend to be seen similarly, soorders accumulate more easilyas a mechanism.
Summary

Let's move to the summary.
The basic reason horizontal lines are easily observed is that
orders tend to accumulate
.
When there are repeated rebounds at a support, buyers purchase at the support and sellers close their short positions (buy back),
and through this synergistic effect, they tend to rebound from the support
.