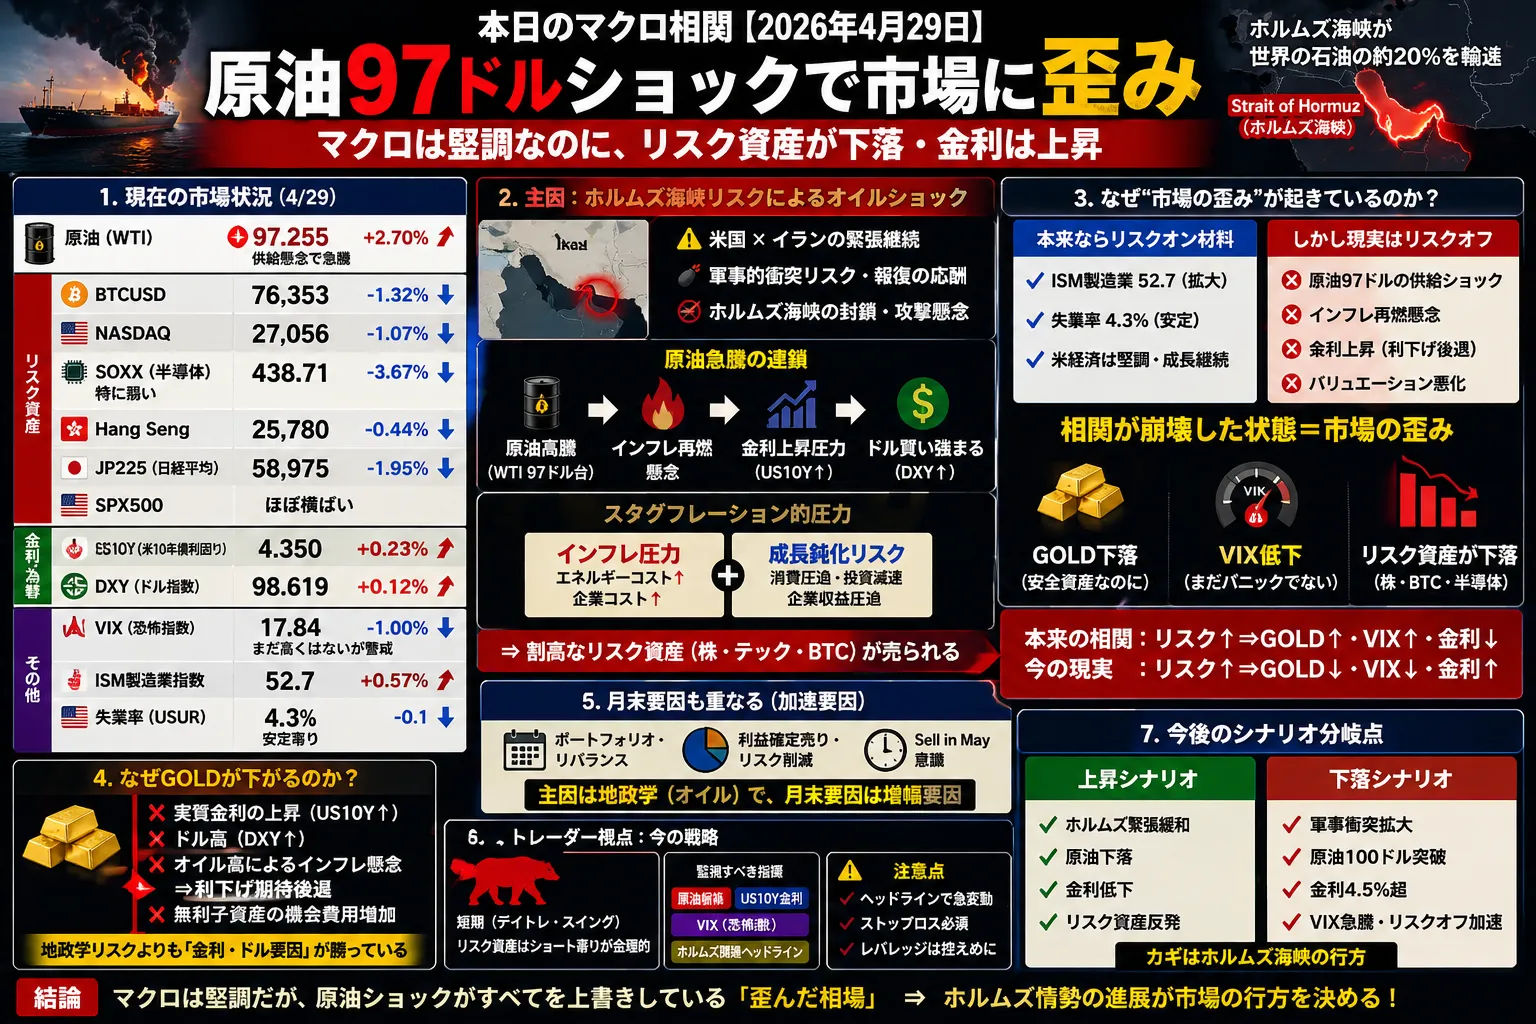

Today’s Macro Correlation 【April 29, 2026】 A must-read for all traders! What is the "market distortion" caused by the global oil shock? — Why macro is strong but risk assets are sold
■ Introduction: What is happening in the market now
(Created based on information around 6:00 AM)
End of April 2026,
the financial markets are experiencing a very important “distortion.”
Typically,
- ISM Manufacturing: 52.7 (Expansion)
- Unemployment rate: 4.3% (Stable)
This data would typically indicatea risk-on environment.
However in reality,
- Stocks (NASDAQ, semiconductors) decline
- BTC declines
- Rising interest rates (US 10Y 4.35%)
- Oil surge (WTI $97)
This is the exact opposite movement.
This is clearly an abnormal state where
“Macro is good, asset prices are bad”
.This is an abnormal state.
■ Why now is “the macro is good but stocks are falling”
The core of this phenomenon is simple.
Oil shocks are overwriting everything
The current market is
driven by energy, not the economy
right now.
■ The Hormuz Strait risk is the starting point for everything
The biggest trigger this time is
the Strait of Hormuz
.
This is a critical point where about 20% of global oil shipments pass.
What is happening now:
- Continued US–Iran tensions
- Risk of military conflict
- Concerns about blockade or attacks
This makes the market very aware of a
“supply shock.”
As a result, again
- WTI: $97 (surge)
is occurring.
■ Oil price increases are triggering stagflation pressure
Oil price increases are not merely price rises.
In the financial markets, this implies
“stagflation pressure.”
Specifically:
- Rising energy costs
- Pressure on corporate profits
- Consumption slows
- Inflation re-ignites
In other words
it cools the economy while pushing prices higher
This is the worst combination.
■ Why are interest rates (US 10Y) rising
Currently, the US 10-year yield is
4.35% (rising)
.
This is very important.
The reason is clear:
- Oil price rise → inflation concerns
- → Fed rate-cut expectations retreat
- → Bond selling
- → Rates rise
In other words, the market is
“rate cuts are far away.”
starting to judge.
This is the so-called
higher for longer
scenario.
■ The real reason risk assets are being sold
Here is the most important point.
What is being sold now:
- NASDAQ
- SOXX (semiconductors)
- BTC
What they have in common?
“valuation-dependent assets”
These are supported by
- low interest rates
- liquidity
- expectations of future growth
However now:
- rising rates
- liquidity squeeze
- increased costs
In other words,
the model for valuation itself is breaking down
and being sold off as a result.
■ Why semiconductors (SOXX) are the weakest
The reason SOXX is the weakest at -3.67% is clear.
Semiconductors are:
- a very long-term growth story
- high P/E
- capital expenditure dependent
In other words,
the most rate-sensitive asset
.
Additionally:
- rising power costs
- increased operating costs for AI data centers
are stacking up.
■ Structural reasons for BTC decline
BTC behaves similarly.
Currently, BTC is:
- an ETF-like fund
- a liquidity asset
- a high-beta asset
in nature.
In other words
high sensitivity to financial conditions
.
The recent decline is a typical adjustment caused by:
- rising rates
- strong dollar
- decreased liquidity
..
■ Then, why isn’t GOLD rising
This is a very important distortion.
Normally:
- Geopolitical risk
- Oil price rise
→ GOLD should rise
but in reality:
- GOLD falls
Reasons are three:
① Real interest rates rise
② Dollar strength
③ Bond yields rise
In other words
“Yield assets” are chosen over safe-haven gold
.
This is the state.
■ Why VIX is not rising—anomaly
Currently VIX is
17.84 (low)
.
This is important.
Under normal circumstances this would be:
- VIX above 25
which would not be unusual.
In other words, the market is
“not yet in a panic.”
But this also implies:
risk of rising later
is indicated.
■ Is this market distortion
In short:
this can be analyzed as a typical short-term distortion.
Reason:
- Macro is good
- But energy shock
This combination has been seen in oil-shock periods in the past.
In other words:
“the original correlation has temporarily broken down.”
This is the state.
■ End-of-month factors cannot be ignored
The timing of April 29 is also important.
At month-end, there will be:
- portfolio rebalancing
- profit-taking
- risk reduction
occurring.
Additionally:
- Sell in May considerations
also overlap.
However this is
not the main cause but an amplifying factor
.
■ Possible turning points going forward
Market divergence is very clear.
Upside scenario
- Hormuz tensions ease
- Oil declines
- Rates fall
- Risk assets rebound
Downside scenario
- Military conflict escalates
- Oil breaks through $100
- Rates above 4.5%
- VIX surges
■ Trader perspective strategies
Short term:
- Short bias for risk assets
- especially SOXX, NASDAQ, BTC
Indicators to monitor:
- Oil (most important)
- US 10Y
- VIX
Note:
- Headline-driven moves
- Risk of sharp rebounds
■ When will this distortion resolve
The key is one thing.
.
- Blockade risk subsides → normalization
- Tension persists → distortion widens
Very simple.
■ The essence of what is happening now
The current market is,
an energy-driven macro overlay market
in effect.
To summarize:
- Macro: good
- Oil: bad
- → Inflation re-ignites
- → Rates rise
- → Risk assets fall
In other words
“Even in a good economy, the market falls.”
This is the classic example.
■ The fundamental focus points of this market
The most interesting aspect of this market is
that correlations are breaking down
- Gold does not rise
- VIX is low
- Stocks fall
- BTC weak
This may be a signal that
the market is transitioning to the next phase
for 2026, the market is not simply risk-on or risk-off but
“resources × interest rates × geopolitics”
moving into a new phase.
Whether you can understand this distortion will determine your future trading success.