

[April 29] "The rationale becomes silence."
0
In this plunging market, isn’t there anyone who feels that a rebound might be coming soon?
I feel the same. That’s why today I’m thinking in terms of a selling bias.
I have organized the basis for that.
Today’s Market Situation
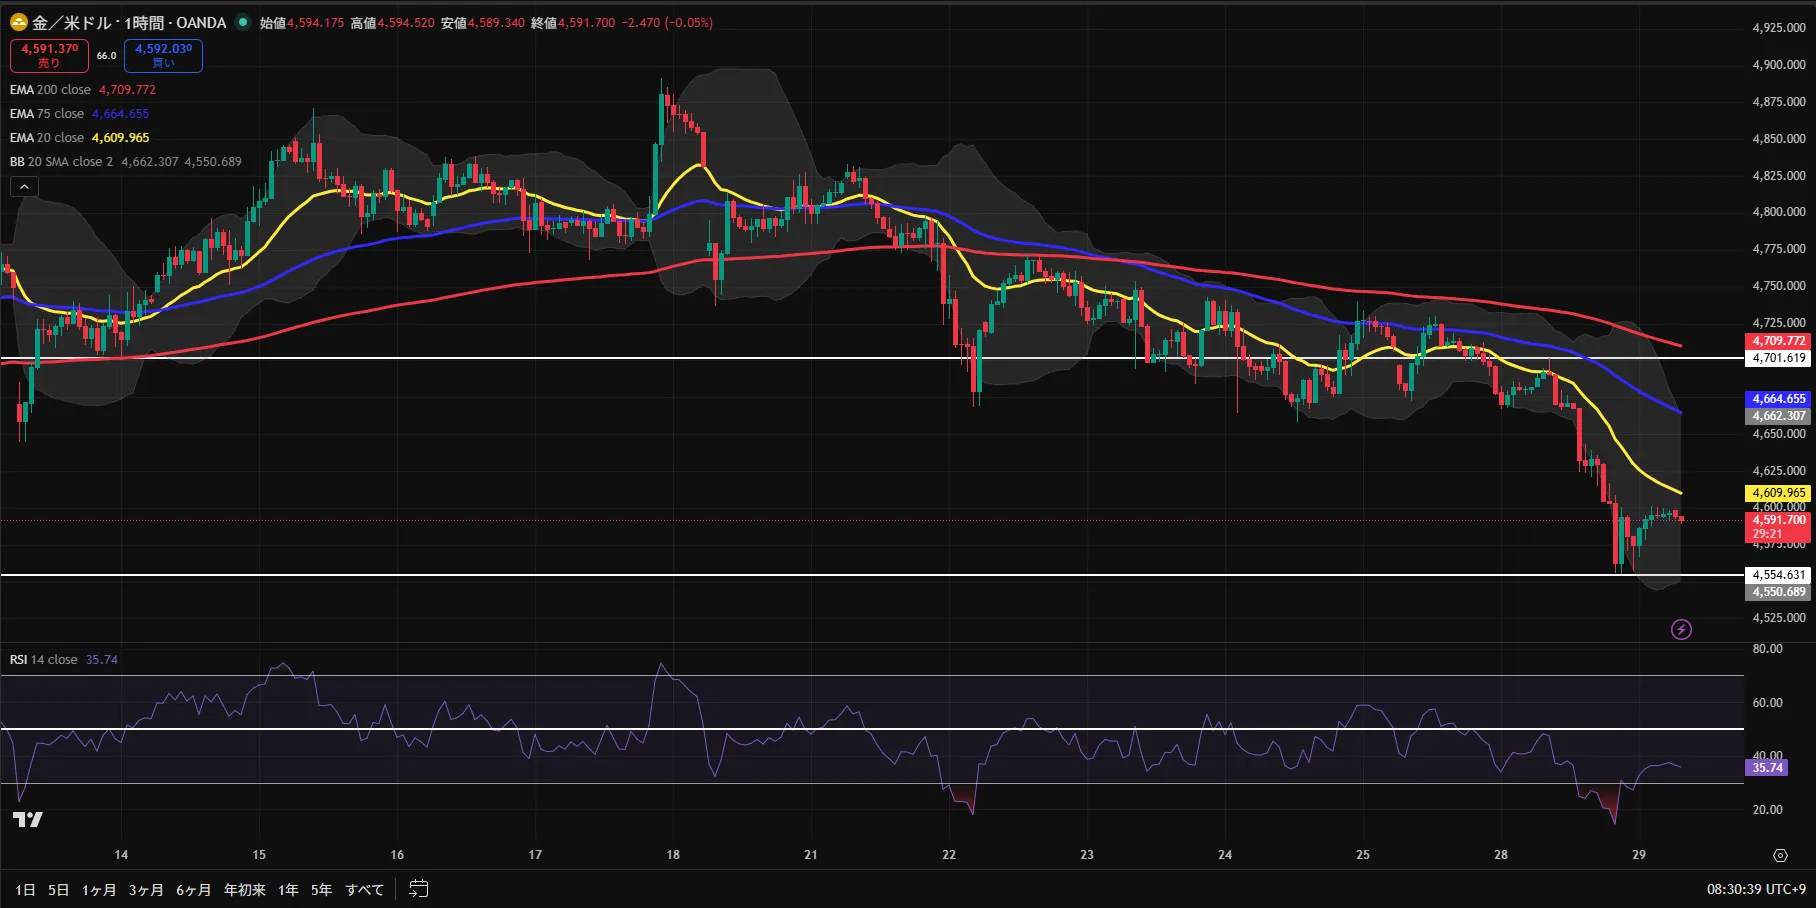
The current price is $4,591.875. Looking at recent price movements, it has fallen sharply over the past few days and has reached around $4,554. It has rebounded somewhat now, but the upside remains heavy.
In the 1-hour chart, the EMA20 (short-term moving average), EMA75, and EMA200 are all in a downtrend (20 < 75 < 200), and the RSI (an indicator showing overbought/oversold) is at a low level of 35.74. However, it is not oversold enough to drop below 30, and RSI has continued to fall slightly from 36.94 to 35.74 over the last three hours.
The 4-hour RSI has fallen to 29.84, around the 30 area, showing early signs of exhaustion in a major downtrend.
In short, technically the selling-biased structure continues, but we are approaching a level where a short-term rebound is likely to occur.
GoGo Tarou’s View
This article is a personal analysis and does not constitute investment advice or solicitation. Please make trading decisions at your own risk.
If the current price retraces to around EMA20 near $4,605–$4,615 and the selling-biased arrangement has not broken, we may be looking at a setup for a pullback selling opportunity. However, since RSI is at a low level on both the 4H and 1H, we should also be cautious of a sharp rebound when energy has accumulated.
On the other hand, if there is a move that clearly breaks below the previous day’s low of $4,554.631, there is potential for further accelerated decline. However, since I could not derive a clear take-profit justification for that break today, I will not provide a break-entry reference line.
For both scenarios, I think it is important to approach with a mindset of “decide when price reaches the line,” rather than jumping in on emotions.
Today’s Reference Lines
Today there are no points that satisfy RR1.5, so I will abstain from entering. Below is for reference only.
Short (pullback selling)
Reference Zone: $4,605–$4,615 (Reason: 1H EMA20)
Reference Take-Profit Line: $4,555 / Reference Stop-Loss Line: $4,670
Expected RR: 0.92 (below standard; personal judgment)
*These are educational reference values. Please make actual trading decisions yourself.
Breakout selling is omitted because a take-profit basis could not be calculated.
Important Lines
Resistance 1: $4,610 (Reason: 1H EMA20)
Resistance 2: $4,665 (Reason: 1H EMA75)
Resistance 3: $4,700 (Reason: previous day high)
Support 1: $4,555 (Reason: previous day low)
1H EMA200: $4,710 (If this line is surpassed, upward acceleration occurs)
Today's Phrase
“Only those who can wait can seize the next opportunity.”
This article is a personal analysis and does not constitute investment advice or solicitation. Please make trading decisions at your own risk.
If you found it helpful, a follow would be encouraging.
Feel free to leave questions or impressions in the comments.
× ![]()