

[Practical Use] Three Winning Gold Patterns + Two Patterns to Avoid When You Should Skip — Your Winning Rate Will Change Just by Knowing It
Trading gold, have you ever thought this?
“With the same method, there are times you win and times you lose.”
That isn’t because the method is bad.It’s just that you haven’t identified the pattern correctly.
There are patterns in gold that “almost always win” and patterns where you should pass even if a signal appears. Whether you know these can completely change your win rate with the same method.
This time, I’m sharing the “three winning patterns” and the “two patterns to skip” that I discovered during 12 years of trading gold.
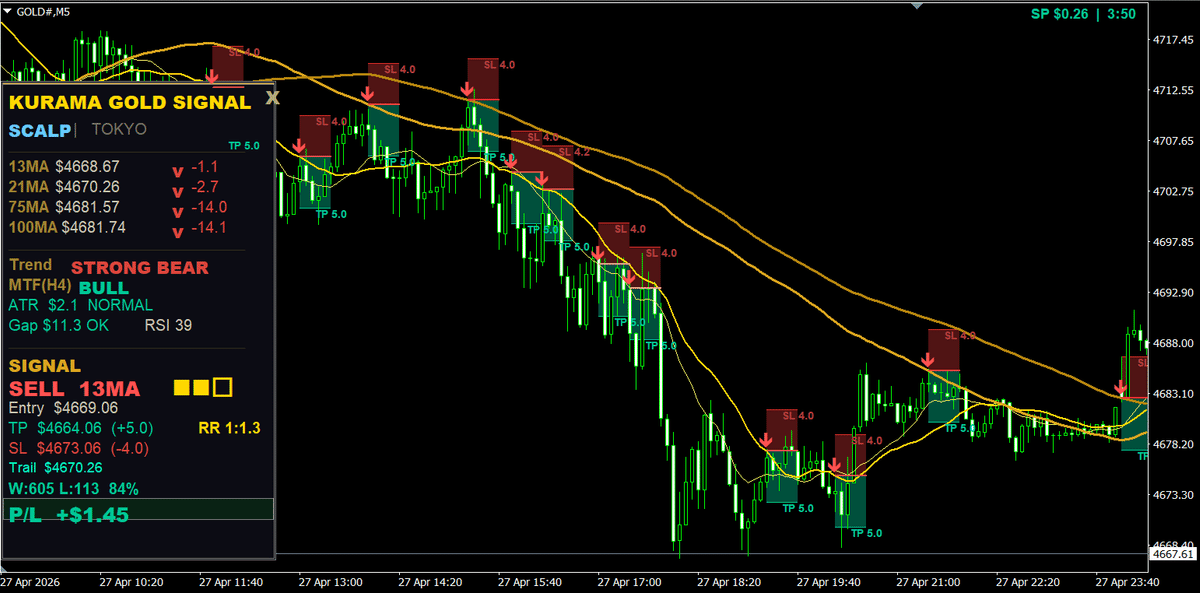
Winning Pattern ① Touching 75MA/100MA during a Trend
This has the highest win rate.
When a strong trend is in place, the price pulls back deeply to the 75MA or 100MA and then reverses. This is what you call a “deep pullback.”
Why is the win rate high?
75MA and 100MA are mid-to-long term moving averages that institutions and funds watch. If price returns this far, it means the short-term correction has progressed enough. Sellers have largely finished. Buying tends to come in from here.
Moreover, touches to 75MA/100MA don’t happen frequently.It's not a pattern that comes up many times a day, so when it does occur, it carries high credibility.
Judgment points:
・The MA slope should be sufficiently steep. A touch on a flat MA may indicate a ranging market
・Candlesticks should react after the touch. If there’s no reaction to the touch, downside pressure may continue
・Should align with the direction of the higher timeframe (H4) trend
When this pattern appears, enter without hesitation.
Winning Pattern ② Touching 21MA in a Perfect Order
Perfect Order means SMA 13/21/75/100 lined up from top to bottom (for a buy). It’s a clear sign of a clean trend.
In this state, price lightly pulls back to 21MA and rebounds. This is the “ironclad” pattern.
Although it’s a shallower pullback than the 75MA/100MA touch, as long as Perfect Order is maintained, the strength of the trend is high. A bounce at 21MA makes it likely the price will move again in the trend direction.
Judgment points:
・Perfect Order has not broken. If 13MA breaks below 21MA, beware
・21MA slope is steep. If it's gradual, the trend momentum is weakening ・No large volatility immediately prior (exception around data releases)
This pattern works particularly well on M5 scalping. Take 5–10 pips quickly and exit. Don’t chase.
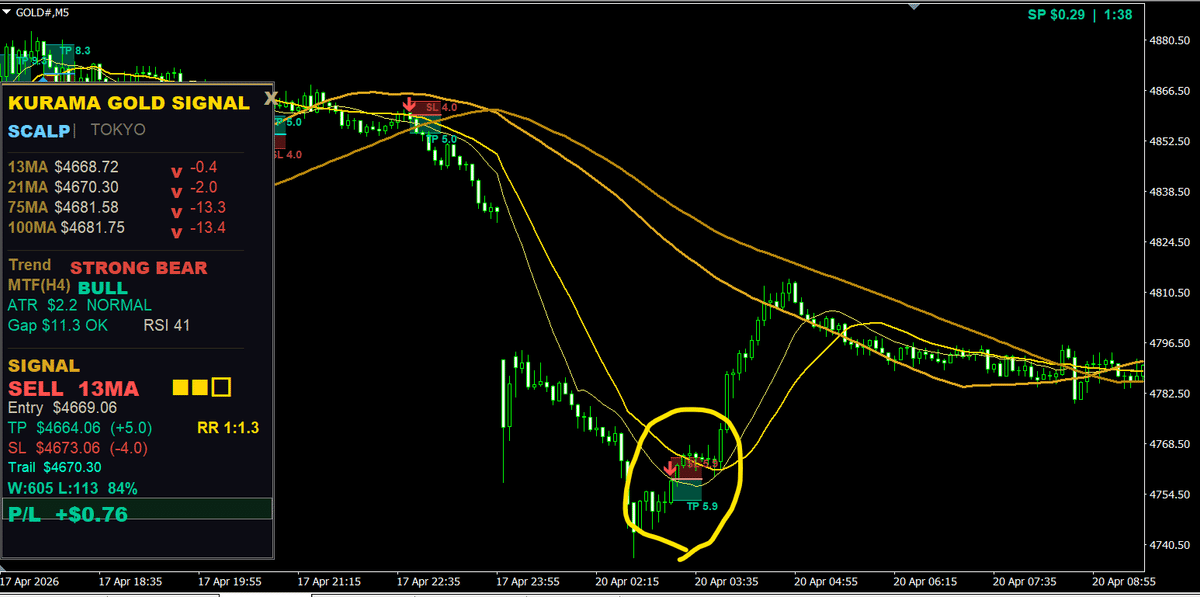
Winning Pattern ③ Trend after Session Change
A move where London breaks the Tokyo-time range. This is the third winning pattern.
Gold during Tokyo hours hardly moves. It often trades in a range of about $5–$10.
Around the time London opens, around 16:00 Japan time, this Tokyo range breaks up or down. A trend then forms in the breakout direction, sometimes moving $20–$30.
Judgment points:
・Wait for 15–30 minutes after London opens. Fake breaks are common ・When MA aligns with breakout direction, it’s real
・The narrower the Tokyo range, the larger the potential move after breakout
This pattern generates a range of moves, making it ideal for M15 day trading. TP/SL can be set wider.
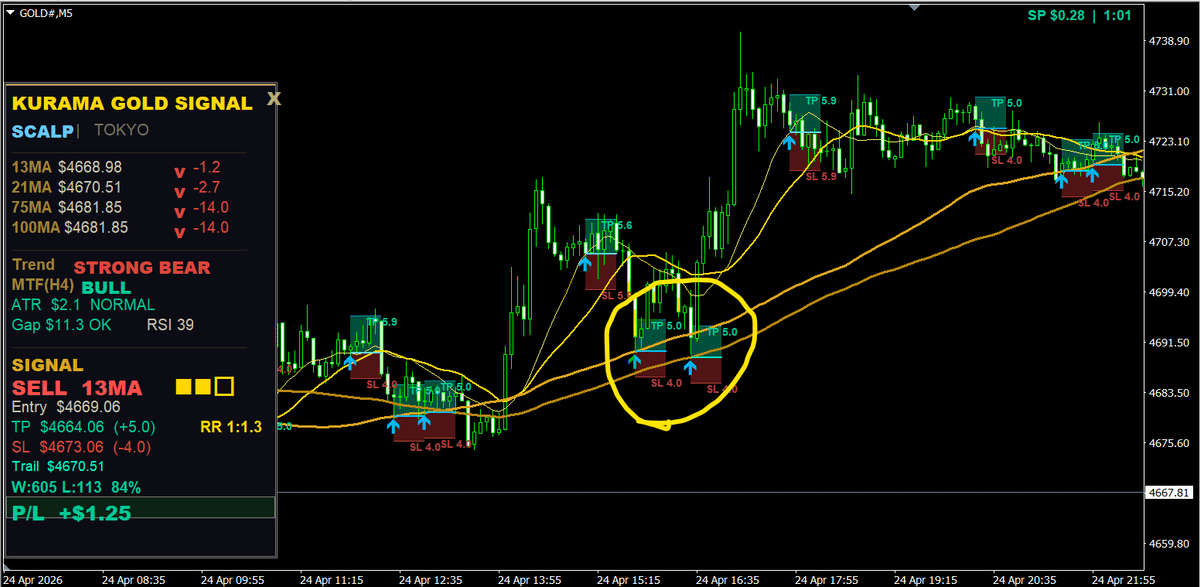
Pattern to Skip ① First Touch of 13MA at an Extreme RSI
This is where it gets crucial. Knowing “scenarios to skip even if a signal appears” can greatly change your win rate.
The most dangerous scenario is,an RSI at extremely overbought or oversold levels (below 30 or above 70) with a first touch to 13MA.
Why is it dangerous?
An extreme RSI implies price has recently moved very sharply in one direction. When it touches 13MA in this state, there is still momentum. It may reverse at the touch but then overshoot and break through the MA.
Gold is especially volatile, so the overshoot can be brutal. A 13MA touch entry can reverse by more than $10 in an instant.
Instead of “enter because a signal appeared,” think “if RSI is in an extreme position, skip the first touch.”
Being able to judge this alone can significantly reduce wasted losses.
Pattern to Skip ② Signal in a Range
MA is flat and price is moving up and down within a range. In other words, a range market.
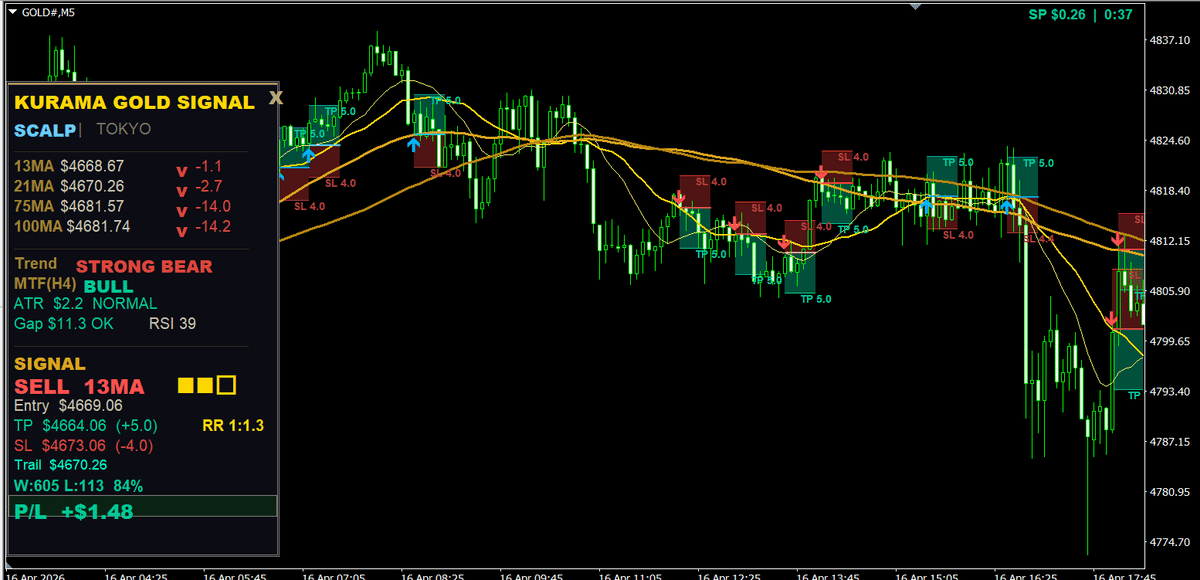
Even if a signal appears within the range, you’ll lose with high probability.
Why? MA-based touch methods work when a trend exists. If there’s no trend, MA is just a checkpoint. A touch occurs but there’s no rebound, and price breaks through.
Judgment criteria for a range:
・MA is near-horizontal → Range
・13MA and 21MA cross frequently → Range
・Price moves above and below MA repeatedly → Range
In such times, you can close the chart. There’s no need to force a trade. Enter after the range ends and a trend begins.
Can you distinguish Winning Patterns from Skipping Patterns?
If you’ve read this far, you might think, “I understand the logic. But can I judge it on actual charts?”
Honestly, it’s difficult.
Especially in real-time where the chart is moving, evaluating MA slope, RSI position, Perfect Order, session, and volatility simultaneously to decide “enter/skip” requires substantial experience.
And one more thing.Even if you can make a judgment, emotions will interfere.
Even when you know a pattern to skip, you might think, “This time it might be okay,” and enter. That’s human.
KURAMA GOLD SIGNAL PRO helps with “skipping” too
KURAMA GOLD SIGNAL PRO (KGS) that I developed doesn’t just signal winning patterns.
Seven independent filters scrutinize the market environment and greatly reduce signals in dangerous situations.
・RSI in extreme position → RSI filter blocks
・Range market → MA angle filter + trend direction filter block
・Volatility abnormal → ATR filter blocks
・Opposition to higher timeframe → H4 filter blocks
However, to be honest.Even after filtering, there are still subtle situations where signals appear.
Markets are alive. No filter can perfectly eliminate garbage signals 100%.
That’s why KGS has a quality score (★ to ★★★).
・★★★ → All conditions perfectly aligned. Enter without hesitation
・★★ → Conditions are met but somewhat marginal. Enter as usual OK
・★ → Conditions are lax. Reduce lot size or skip
In scenes close to the “patterns to skip,” the quality score often becomes ★. If you see a ★ signal, you can judge “this is skip.”
In short,KGS not only signals but also teaches you whether this signal is trustworthy.
Ultimately, your entry decision is yours. But KGS displays all the decision materials on the chart.
・Entry point → shown with arrows
・TP/SL → shown in green and red zones ・Signal reliability → shown as ★–★★★
・Trend direction → shown on a panel
・ATR, RSI, session → shown on a panel
What you need to do is simply decide to enter only signals with ★★ or higher. That alone drastically reduces garbage trades.
Summary
Three winning patterns:
① Touching 75MA/100MA during a trend → Deep pullback with high win rate
② Touching 21MA in Perfect Order → Iron-clad scalping
③ Trend after session switch → Generates a wider price move
Two patterns to skip:
① RSI extreme + first touch to 13MA → Danger of overshoot
② Signal within a ranging market → MA does not function
Even if you memorize winning patterns, if you don’t know the skipping patterns your win rate won’t improve. Understanding both together stabilizes trading.
And KGS handles winning pattern detection, skipping decision support, and TP/SL calculations all on the chart. Not perfect, but far more accurate than judging everything alone.
? Details of KURAMA GOLD SIGNAL PRO here

Is there a better deal if you get the set?
KGS (Gold-only) and KUS (USDJPY-only) are sold as a set at a discount.
KGS standalone ……… ¥24,800
KUS standalone ……… ¥19,800
Standalone total ……… ¥44,600 ★
Set price … ¥39,800 (¥4,800 OFF)
? Set products here →https://www.gogojungle.co.jp/tools/ebooks/77857?via=users_products
![]()
KGS (Gold-only) and KUS (USDJPY-only) are sold as a set at a discount.
KGS standalone ……… ¥24,800
KUS standalone ……… ¥19,800
Standalone total ……… ¥44,600 ★
Set price … ¥39,800 (¥4,800 OFF)
? Set products here →https://www.gogojungle.co.jp/tools/ebooks/77857?via=users_products