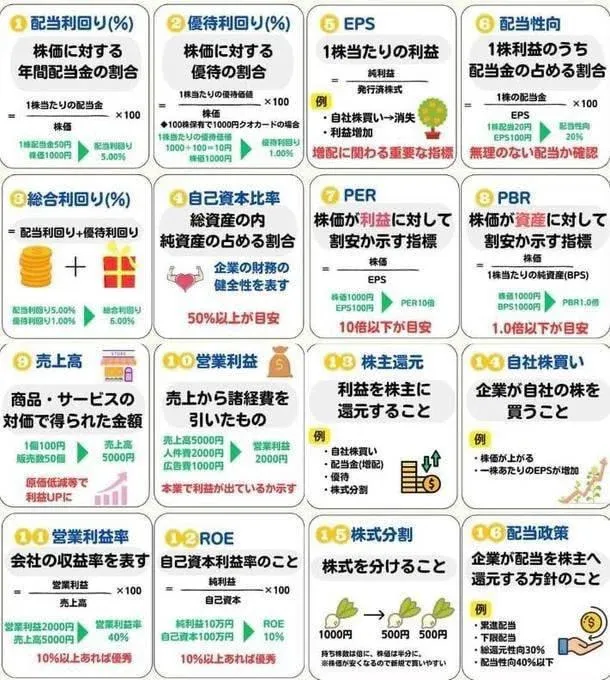

Japanese Stock Market 16 Major Core Financial Indicators Quick Reference Table (For Beginners)
By understanding this figure alone, you can determine whether a company's stock is sound and worth investing in.
I will explain each item in order one by one, so even beginners can understand it after seeing it a few times!
1. Dividend yield (%) — What is Dividend Yield: the percentage of yearly dividends a company pays after you buy its stock (an image similar to rent yield).
Formula: (Dividend per share ÷ Current stock price) × 100
Example: stock price 1,000 yen, dividend per share 50 yen → 5.0%
Things to look for: the higher, the better (for quality Japanese companies, 3-5% or more). However, if too high, be cautious.
Tip: suitable for long-term investors who want steady “pocket money.”
2. Shareholder benefit yield (%) — What is Shareholder Benefits Yield: the value of benefits provided to shareholders other than cash dividends (gift certificates or products).
Formula: (Benefit value ÷ Stock price) × 100
Example: stock price 1,000 yen, benefit 100 yen → 10%
Things to look for: many Japanese companies offer benefits, so the total yield increases when added to dividends.
Tip: like a members-only supermarket card for shareholders.
3. Total yield (%) — What is Total yield: the sum of dividend yield and shareholder benefit yield.
Example: dividend 5% + benefits 1% = 6%
Things to look for: the higher, the more attractive
Tip: a simplified version of the “total return rate.”
4. Equity ratio (%) — What is Equity ratio: the proportion of a company’s equity to its total assets (lower debt indicates healthier).
Formula: (Shareholders’ equity ÷ Total assets) × 100
Things to look for: 50% or more is healthy (the chart notes “aim for 50% or more”).
Tip: like an individual balance sheet, higher debt means higher risk of bankruptcy. Bank stocks can be lower, but generally higher is more stable.
5. EPS (Earnings Per Share) — What is Earnings Per Share: profit of the company divided by the number of shares.
Formula: Net income ÷ Outstanding shares
Example: company profit 10 billion yen, shares 1 billion → EPS = 100 yen per share
Things to look for: a consistent increase is good (indicates improved profitability).
Tip: earnings per share, a basis for PER calculation.
6. Payout ratio (%) — What is Payout Ratio: how much of a company’s profits are distributed to shareholders.
Formula: (Dividend per share ÷ EPS) × 100
Things to look for: 20-40% is appropriate (too high may constrain growth funds; too low means less to shareholders)
Tip: beware of unnecessarily high dividends.
7. PER (Price Earnings Ratio) — What is Price Earnings Ratio: how much the stock price costs to earn 1 yen of profit (lower is more “undervalued”).
Formula: Price ÷ EPS
Example: price 1,000 yen, EPS = 100 yen → PER = 10 times
Things to look for: 10x or lower is attractive (Japan market guideline)
Tip: growth stocks may have high PER and still be okay.
8. PBR (Price Book Ratio) — What is Price Book Ratio: how many times the stock price is of the company’s net assets on the books.
Formula: Price ÷ Book value per share (BPS)
Things to look for: 1.0x or lower is undervalued
Tip: in Japanese companies, PBR < 1 is common and draws attention as a “value stock.”
9. Sales — What is Sales/Revenue: the total income a company earns from goods or services
Things to look for: steadily increasing is good
Note: it is the trend, profitability margin matters
10. Operating profit — What is Operating Profit: profit after deducting costs, labor, advertising, and other daily expenses from sales
Things to look for: profitability of core business
Note: how much the core business is earning