
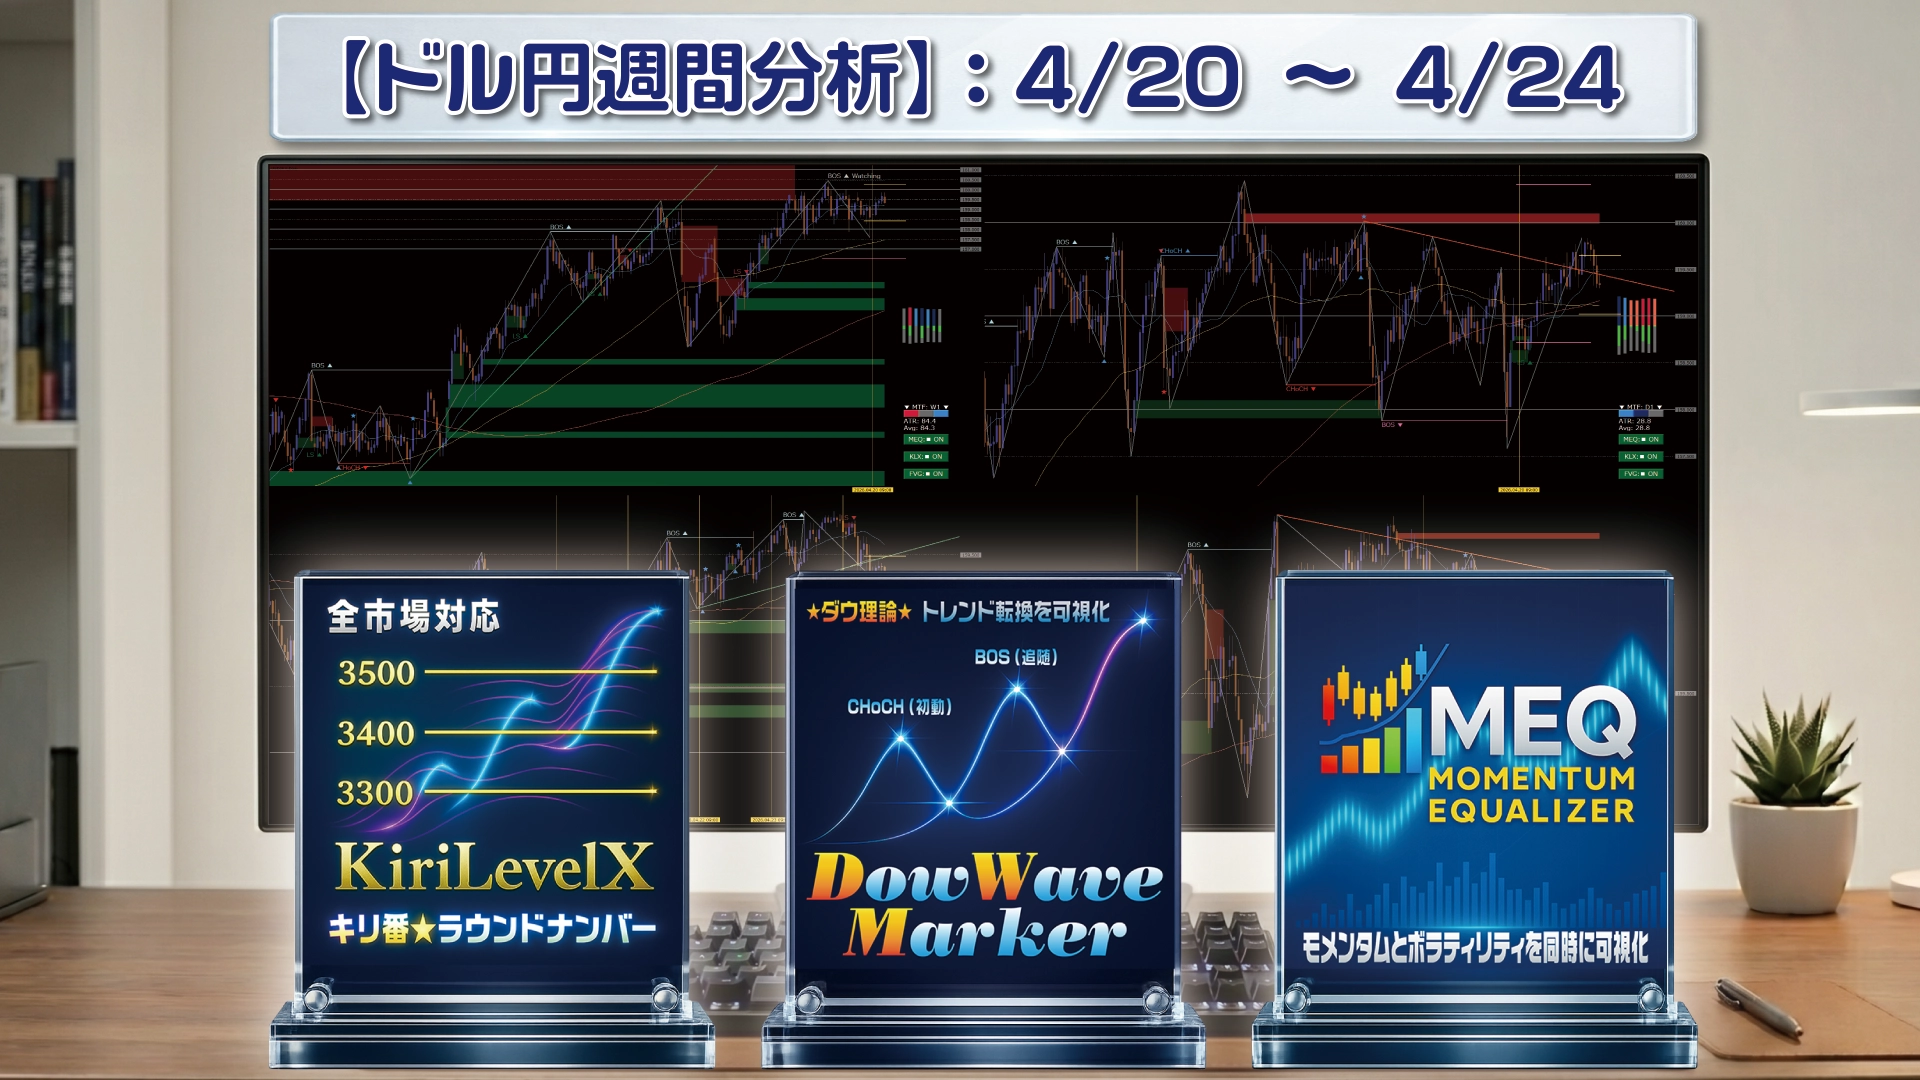
【Weekly Review】USD/JPY: Defense near 160 yen and outlook ahead (April 20–24, 2026)
Engineer's Weekly Reflection Notes
This week, we review the dollar-yen moves on a multi-timeframe basis. Let's整理 the strong momentum from the start of the week and the corrective movements seen toward the weekend.
【Daily Chart】Unwavering Uptrend and the 160 Yen Barrier
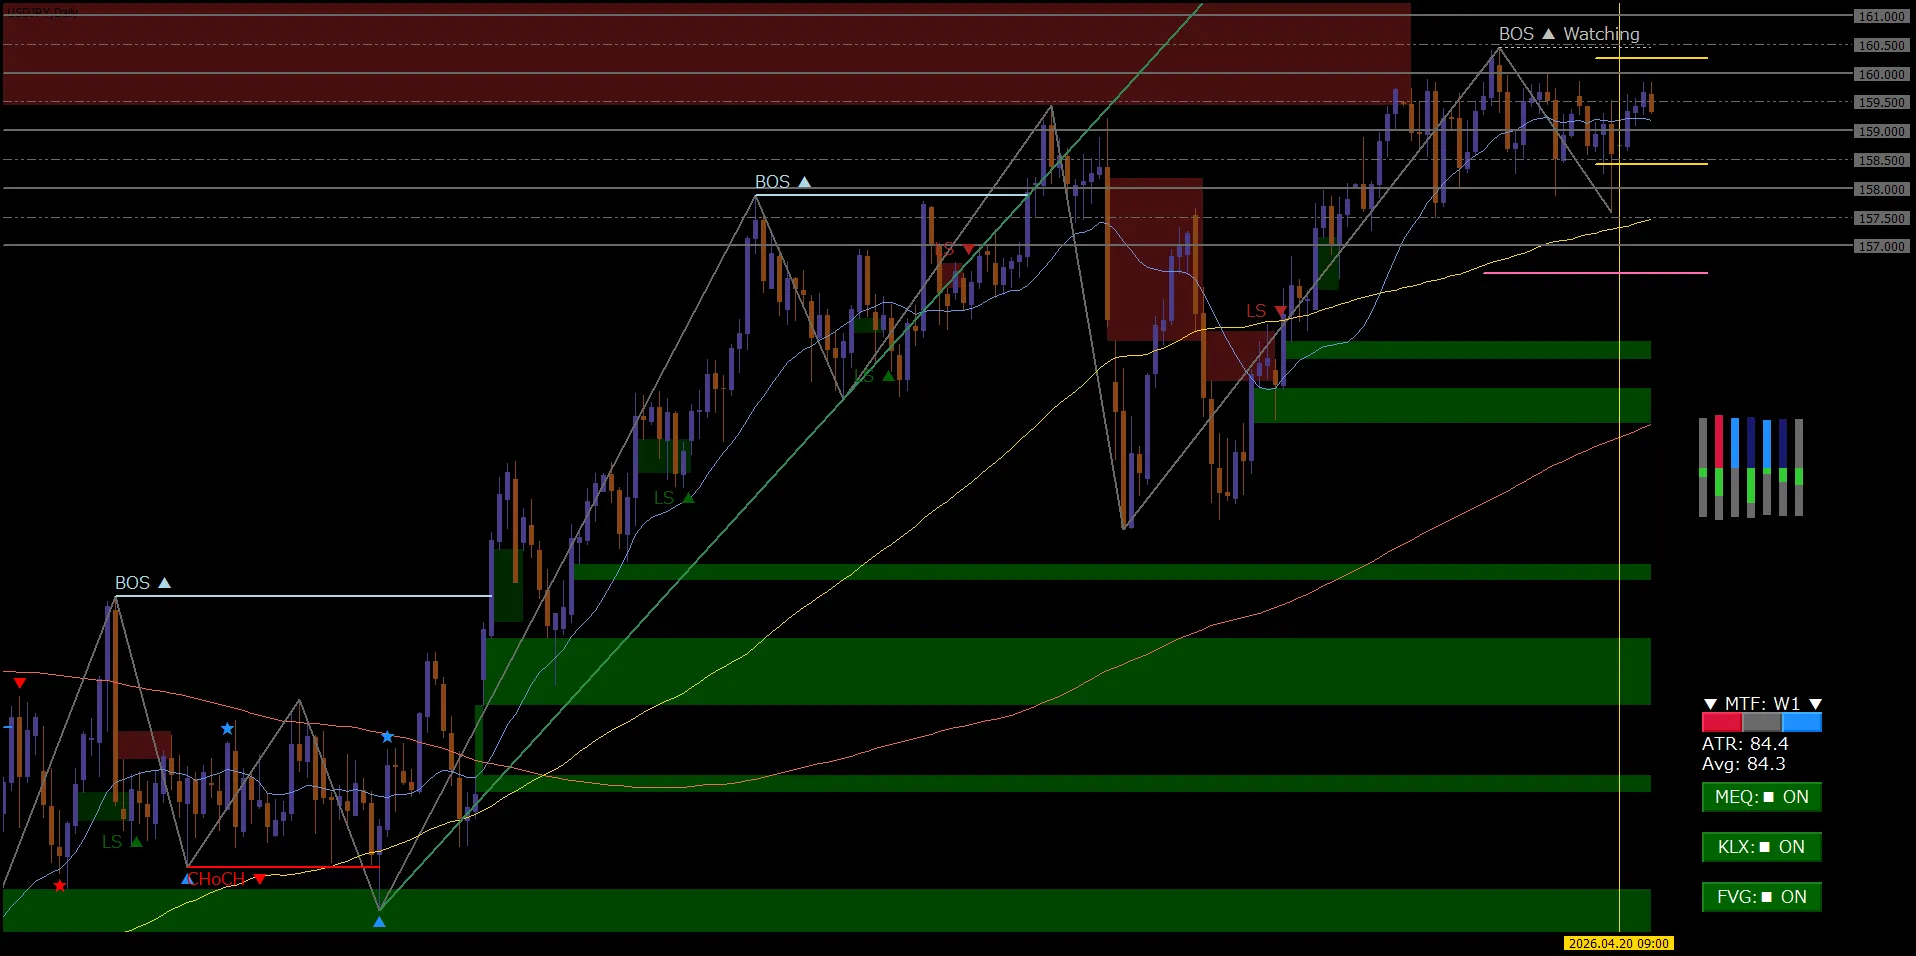
Looking at the daily chart, a clear uptrend continues.
After a Break of Structure (BOS) near 158.00, which had been a resistance, the price moved to a higher stage.
Currently, it is approaching the 160.00 milestone and entering a supply zone.
Moving averages remain in a perfect order, and the market remains favoring buying, but there is still a high-price“Watching” state continuing.
【4-hour / 1-hour】Range formation at high prices and signs of CHoCH
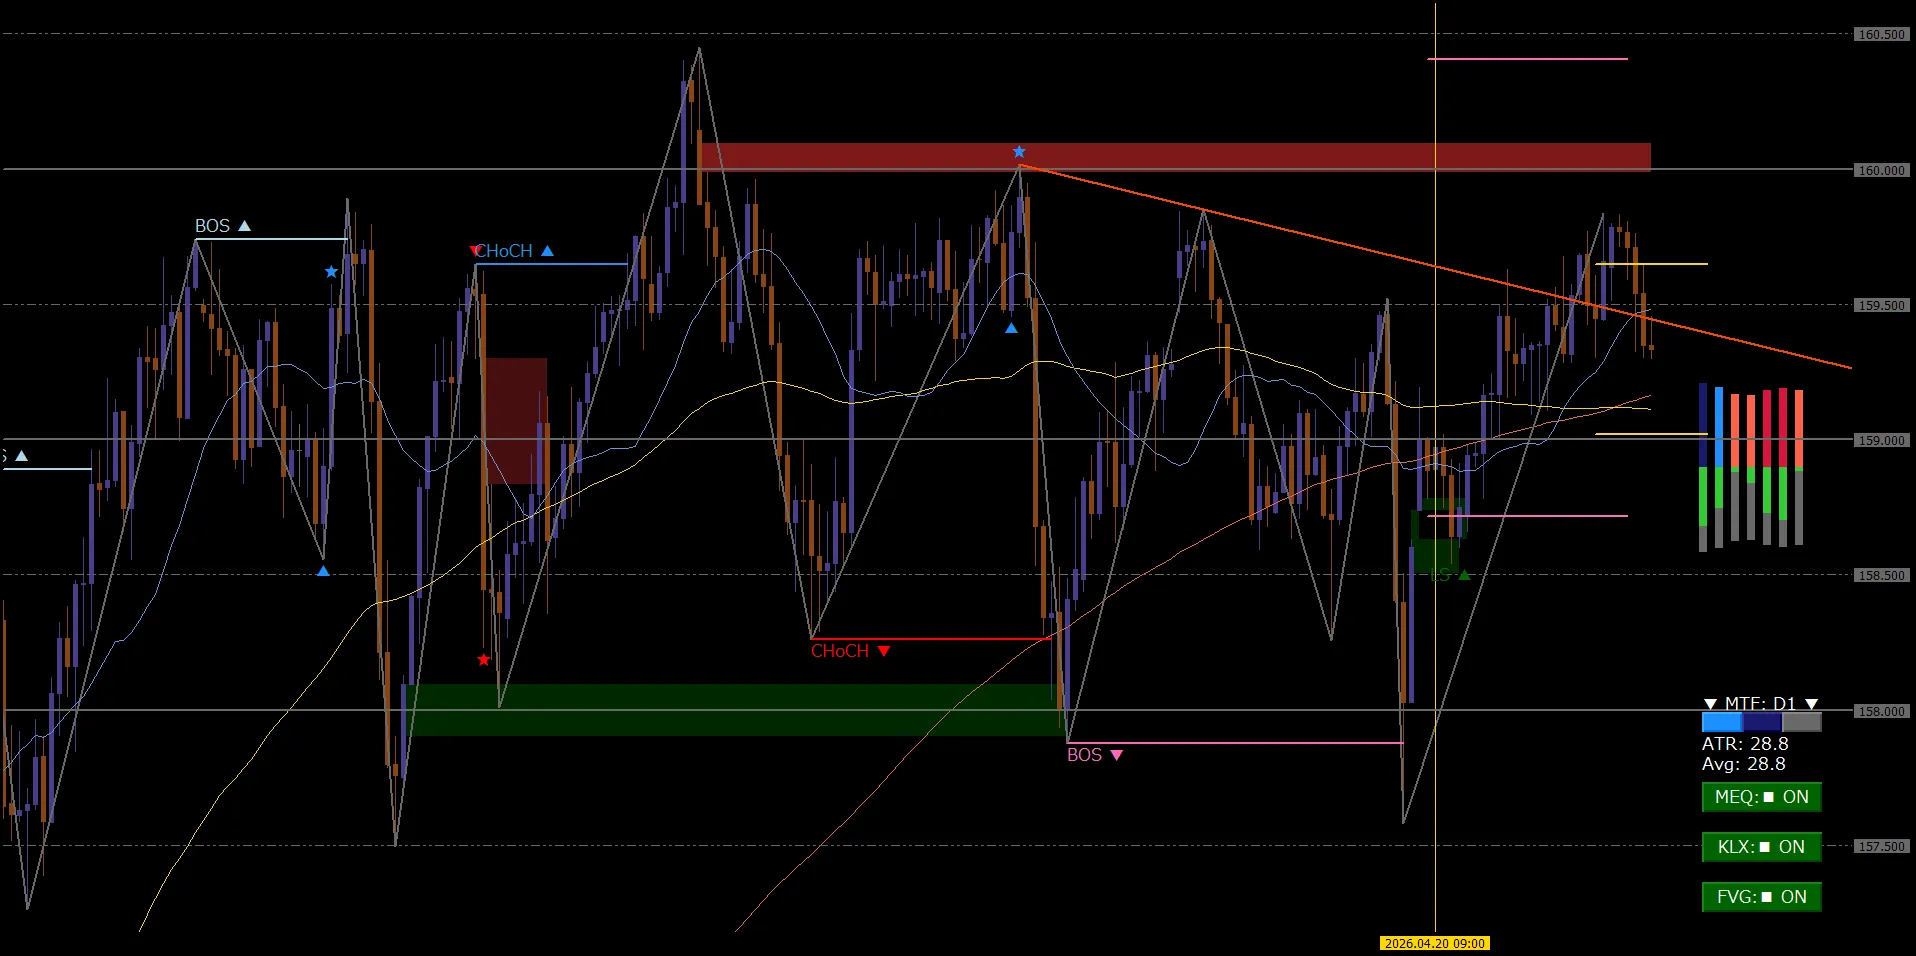
On the 4-hour chart, prices faced strong resistance near 160.00 and the upside was held.
Movements around 158.50–159.50 continue, showing a balance of short-term supply and demand.
On the 1-hour level, toward the weekend a localCHoCH(Change of Character) was observed.
There was a move that broke below a line that had been acting as a buying dip, suggesting that a deeper correction might occur at the start of next week.
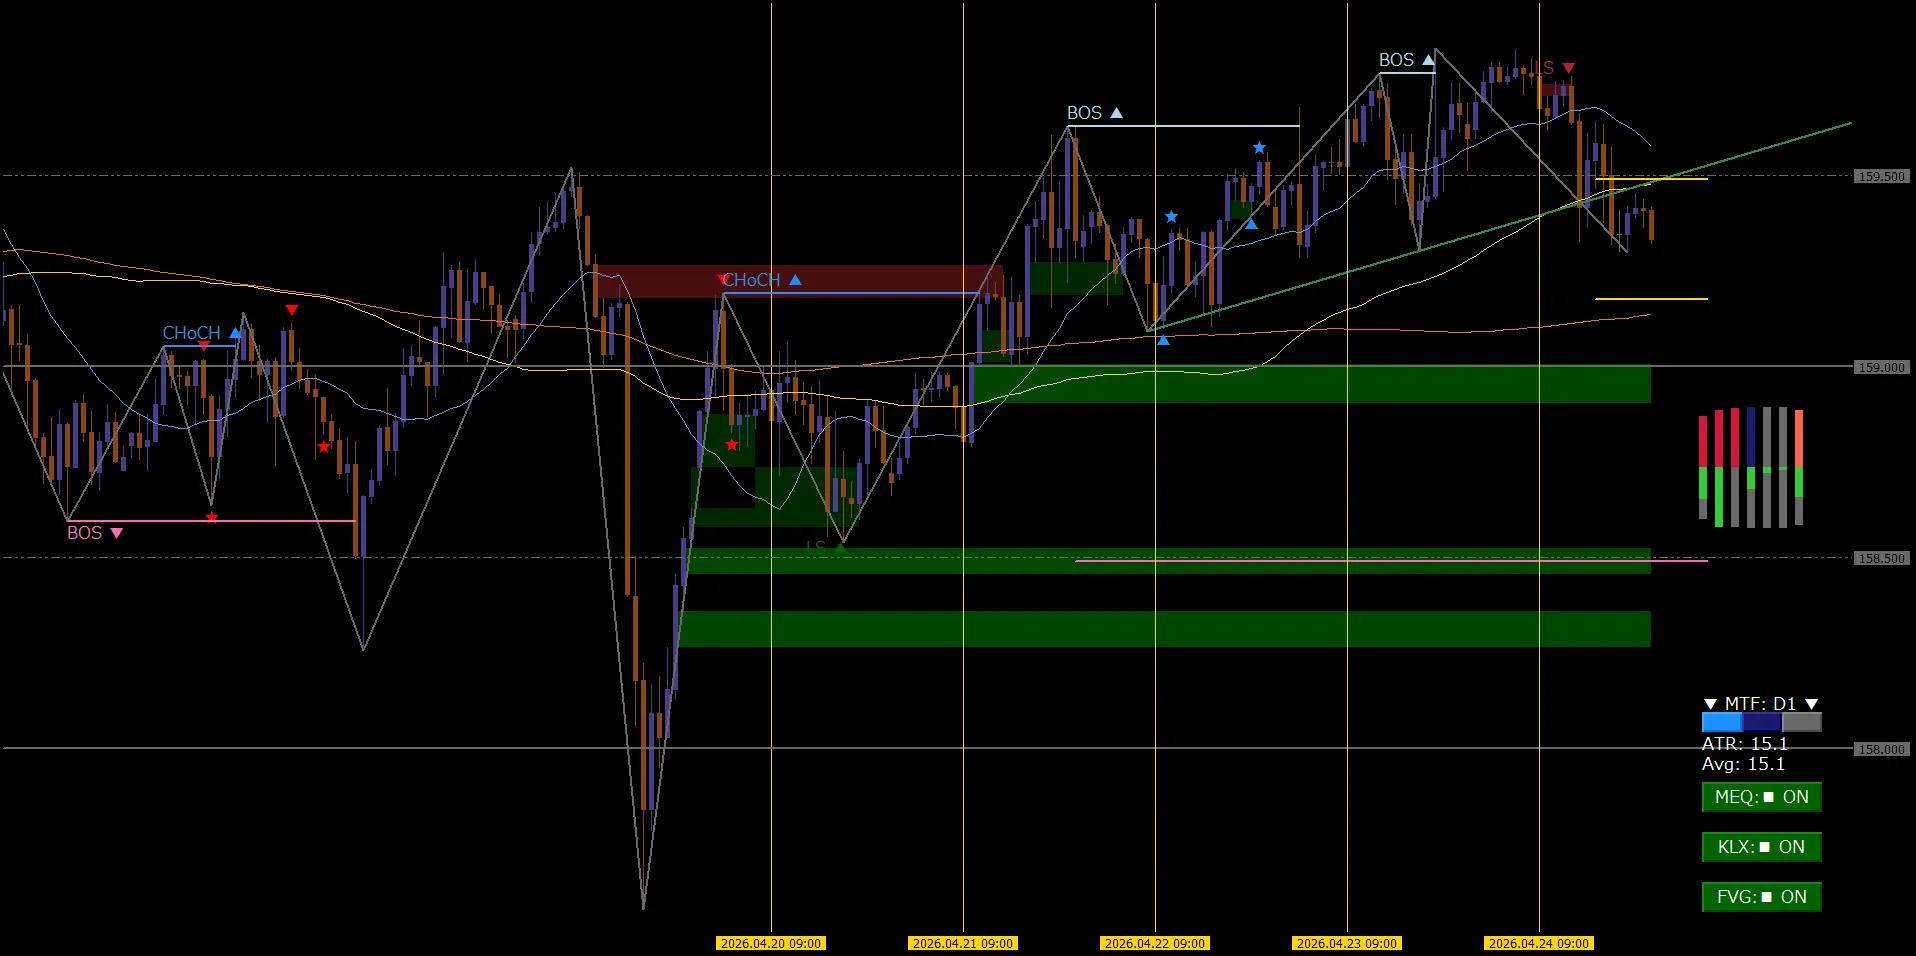
【15-minute】Shift toward a short-term Downtrend
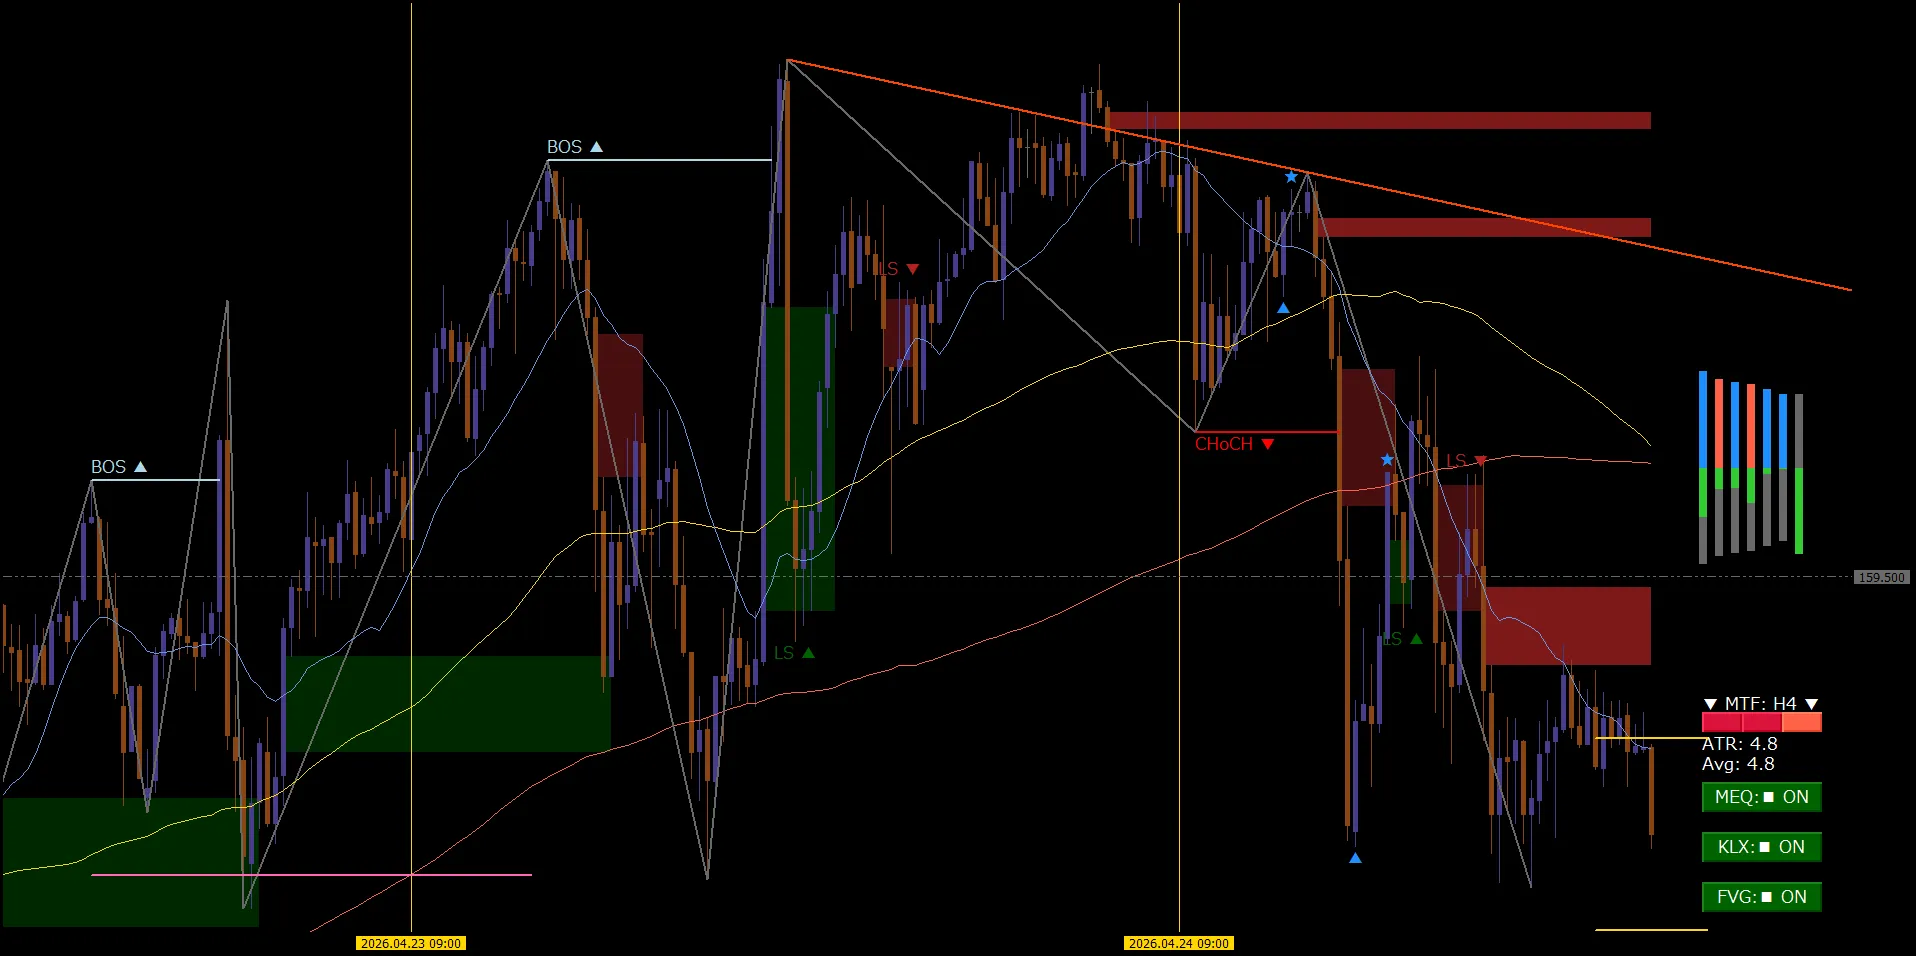
In the latter half of the week, the 15-minute chart showed a clear lower high.
A strong rebound from the supply zone caused consecutive short-term lower highs.
Currently, the downward momentum exists, but the larger daily and 4-hour trends are still pointing upward.
Therefore, whether this decline is“trend reversal” or a temporary pullback against a larger rise“temporary pullback”depends on interpretation,
and next week's scenario will diverge accordingly.
This Week's Summary and Next Week's Outlook
This week, ahead of the psychological and technical level of 160 yen, the market appeared cautious.
【Key Points for Next Week】
★Breakthrough of 160.00:Will it turn upward again and clearly break above this barrier?
★Depth of the Correction:Will there be a move to fill the support near 158.50 or the lower-timeframe FVG (Fair Value Gap)?
★DWM Indicator Reaction:Can we capture a dip buying point that aligns with the higher-timeframe trend using lower-timeframe CHoCH?
The bullish trend on the daily chart has not broken, but based on weekend movements, it is prudent to avoid chasing highs easily.
Wait until it pulls into the demand zone or confirms another break above structure before entering
“Wait-and-see” stance will be important.
Let's maintain calm analysis next week as well and face the market.
For Those Who Want to Learn More About the Tools
In this analysis, the basic ideas of DWM and how to visualize the market environment simply are explained in detail in the following YouTube video.
Please use it as a hint for daily situational awareness.

Introduction of Indicators Used
The tools I developed with the intention of“making trading easier and more logical in facing the market”are published on
thisGogoJungle product page.
◆ DowWave Marker (DWM) SMC Integrated Model
Automatically visualizes market structure to support decisive market awareness.
https://www.gogojungle.co.jp/tools/indicators/72037
◆ KiriLevelX (KLX)
Automatically renders the often-watched “milestone (key number)” to assist precise analysis.
https://www.gogojungle.co.jp/tools/indicators/65584
◆ MomentumEqualizer (MEQ)
Normalizes market momentum with its own logic to support visual judgments.