

[FX Trade Record] USD/JPY +40.4 pips, EUR/JPY +49.7 pips gained! Explain environmental recognition and entry basis
We have compiled the trade record from August 17, 2022.
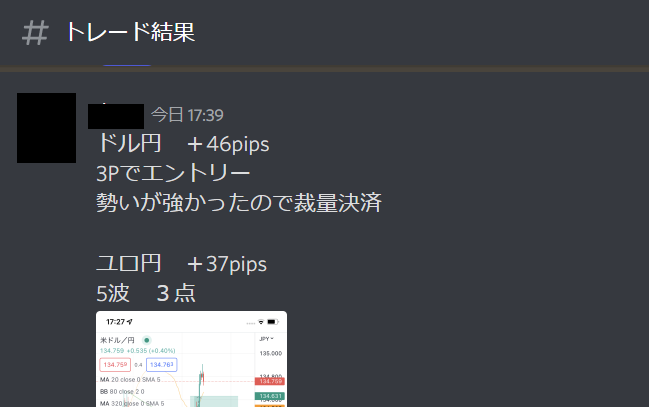
This time, with a short USD/JPY (bearish on pullbacks) and a long EUR/JPY (buying on dips), we achieved a total profit of about 90 pips.
Trade using channel lines and a composite trend
I will explain in detail, using chart images, what kind of market context was recognized for each currency pair and where the entry and exit rationale came from.
USD/JPY: +40.4 pips Bearish on Pullback Trade
First, I will explain the USD/JPY trade.
Market context (1-hour)
On the 1-hour chart, the price rose until the blue uptrend channel’s upper boundary overlapped with the red lower-high line from the previous day’s blue uptrend.
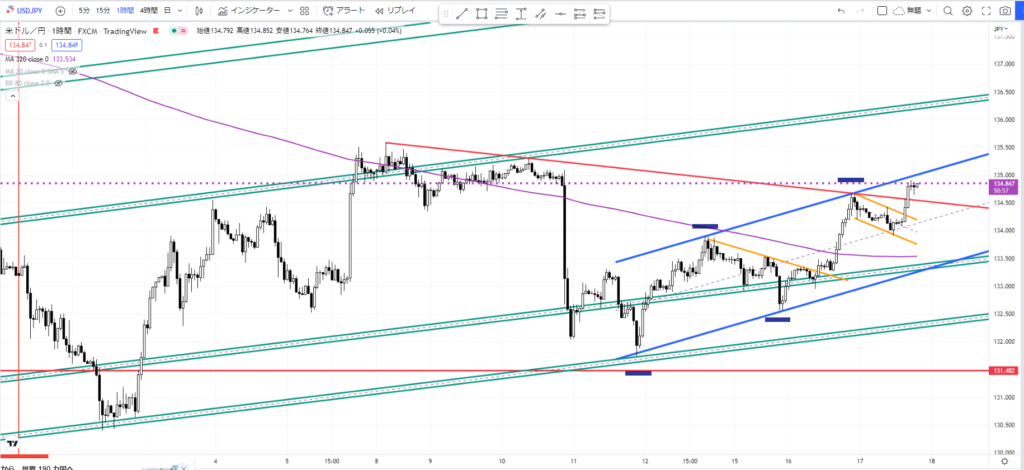
To confirm a pullback buy or a continuation with a higher timeframe trend, it is very important to observe the trend on a larger timeframe than the entry chart.
*At this time, I confirmed the blue rising trend (higher highs and higher lows). Usually this would be a long setup, but I targeted the mid-point pullback after the blue high was made, looking for a lower price on the 15-minute chart.
Entry and exit rationale (15-minute)
On the 15-minute chart, an orange lower-high downtrend line appeared, indicating a perfect pullback entry opportunity.
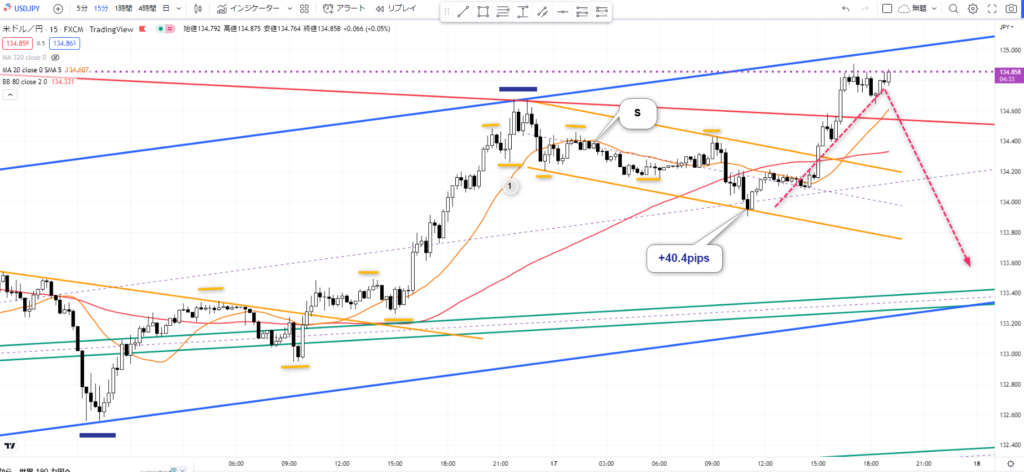
- Entry (S):At the "S" point in the image. After touching upward, it broke below the yellow rising trendline support and consolidated, then was enveloped by the 20 MA, so I went short.
- Exit (take profit):Exited below the downtrend channel formed by the yellow wave on the chart.
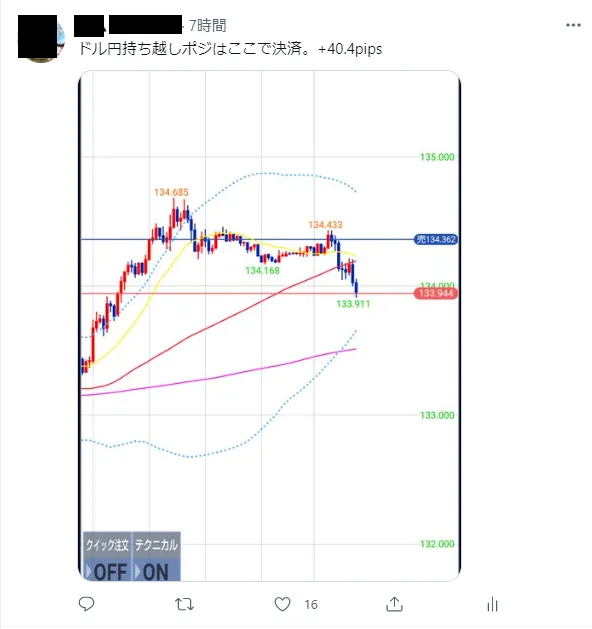
Trade result
It became a carryover position, but as expected it reached the lower bound of the channel and I could exit nicely.
EUR/JPY: +73.7 pips Total Long on Dips Trade
Next, the long trade on EUR/JPY. This was partially closed to extend profits.
Market context (1-hour)
On the 1-hour chart, after the lows were climbed, the price moved into an upward phase. I confirm the momentum on the higher timeframe.
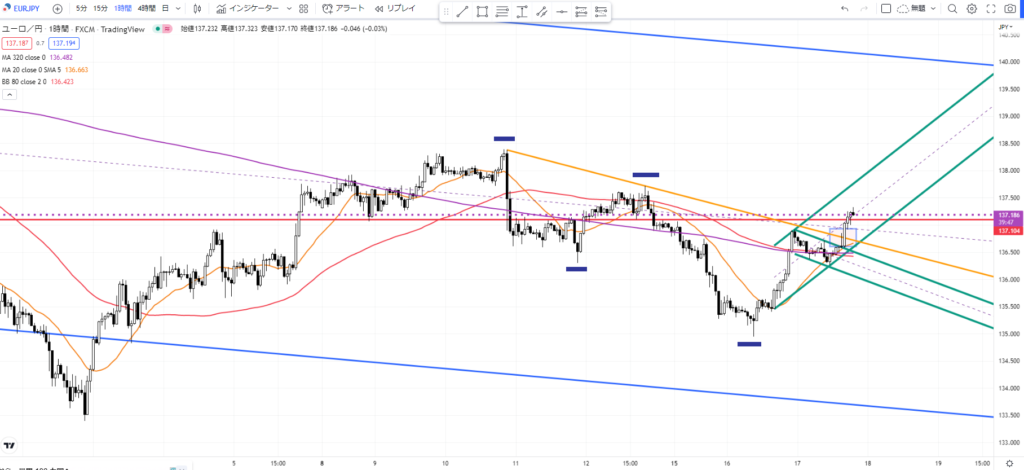
Ideally, trading in the blue trend direction is advantageous, but my entries are generally based on the 20 and 80 moving averages.
*I thought it might still pull back to the blue resistance high!?
Entry and exit rationale (15-minute)
On the 15-minute chart, the price is moving within the green channel line, and breaking above the orange line strengthened the upward momentum.
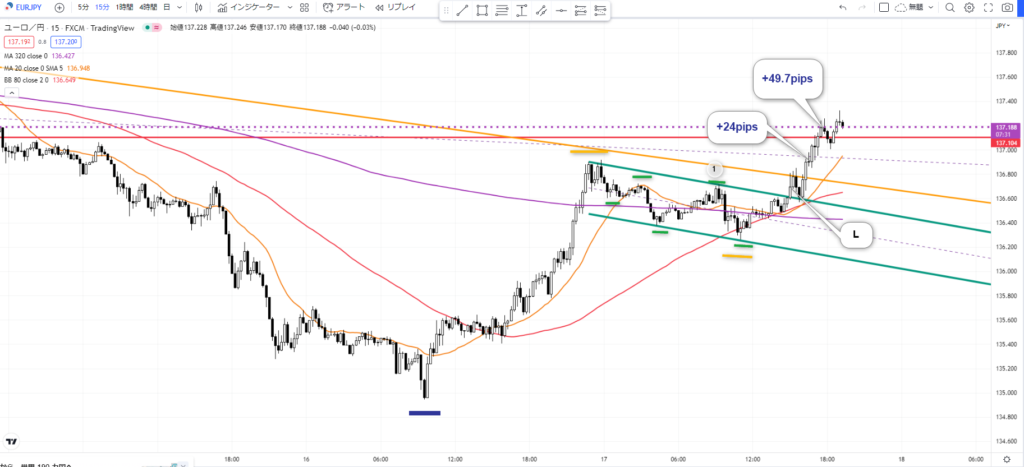
- Entry (L):At the "L" point in the image. After briefly breaking out above the green flag pullback high, I entered.
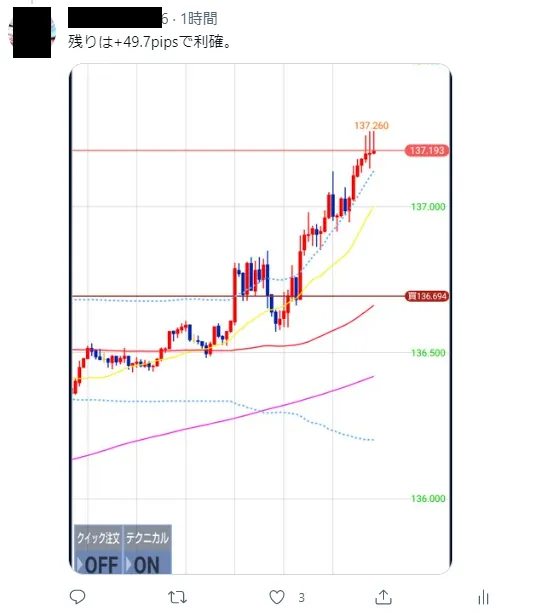
- Partial exit (first take):Take partial profit near the recent high (+24 pips). The remaining position exited at +49.7 pips.
Final settlement outcome
As the price extended further, I exited all at around the 137.20 resistance band. This yielded a large overall profit.
Summary: Stable trading by combining channel lines with horizontal lines
The winning factor in this trade was “catching the flow with the higher-timeframe channel line and narrowing the entry with the lower-timeframe lines.”
In FX, you don’t need overly complex indicators; as shown here, correctly drawing lines can reveal high-probability points.
The methods are available for sale on Gogojan in two formats ⇩
Yosan's Profile — A marketplace for global trading methods and tools - GogoJungle