
Episode 2: The Illusion of a "High Win Rate AI Tool"
Episode 2:
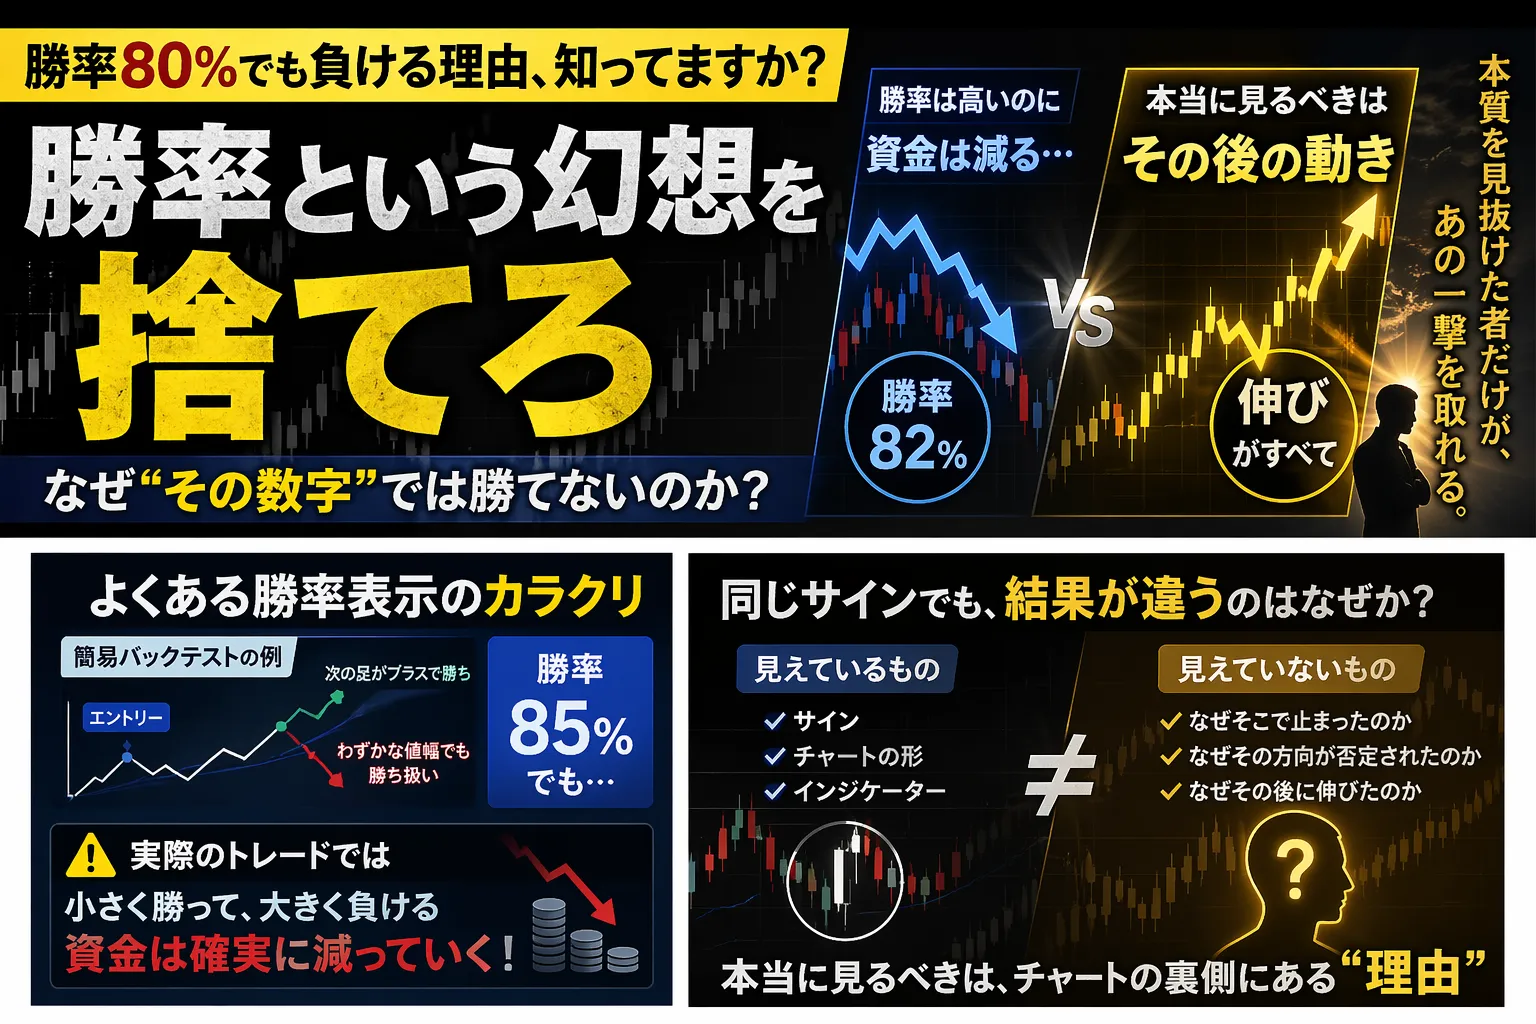
Reasons to discard the illusion of “win rate”
Why can’t we win even with “that number”?
Last time, under the theme of “learning AI vs non-learning AI,”
we explained why a logic that is strong for the future is necessary.
And this time is a continuation of that.
So, on what basis should we choose the logic?
Before getting to that answer, there is something we must break down first.
■ Does that “win rate” display really have meaning?
When you start trading, you will inevitably see it.
- Win rate 80%
- Win rate 90%
- High-precision signals
At first glance, it looks strong.
But, here’s a question.
Do you know how that win rate is calculated?
■ The true nature of a simple backtest
With common indicators or tools,
the “recent win rate”
is displayed, but
its content is surprisingly simple.
■ Common evaluation methods
- After entry, if the next bar’s open is positive, you win
- If the price after several bars is even slightly higher, it’s a win
With this,
even slight price moves are treated as wins
and you end up with a win rate that looks favorable.
What happens when you do this?
In Episode 1 I talked about
the win rate can be increased arbitrarily
= overfitting
in other words.
■ Why that still doesn’t win
This is the most important part.
The issue is,
we are not looking at risk-reward.
or rather, we are ignoring it.
That is the core.
For example,
- +1 still counts as a win
- -20 still counts as a loss
If you trade with this structure repeatedly,
even with an 80% win rate,
your capital will keep decreasing.
This is a numerical trick,
in fact, the win rate is
“the easiest metric to manipulate.”
It’s
■ Why is that?
- You can change the judging criteria midway
- You can change the time frame
- You can change the period you look at
In other words, with a small adjustment
it can always “look better.”
As an indicator, it’s malleable.
■ So, what should you look at?
Here we finally get to the main topic.
What is truly important in trading is
not whether the direction was correct but
“What happened after that.”
■ The real points to watch
- The initial reaction
- How far it extended
- Where it started to stall
Did it reach the set take profit or trailing trigger?
Or did it end up hitting break-even? Was it stopped out?
Was it stopped by a stop loss? Unfortunately?
Only by looking at these can you
determine whether it’s a usable logic.
■ Why outcomes change every time
Here’s a common unease people feel.
“It looks like the same signal, but the results differ each time.”
This isn’t a coincidence.
It’s because the unseen conditions are different.
■ What’s visible vs what’s not visible
Visible things
- Signal
- Chart patterns
- Indicators
Not visible
- Why it stopped there
- Why that direction was rejected
- Why it rose afterward
This is the part of trading that cannot be measured by win rate alone,
the core of trading.
■ The more you do it, the harder trading becomes
Let’s face reality here.
“The conditions under which you should trade are
not frequently coming by”
therefore.
■ So what tends to happen below
- You can’t wait for the right chance
- You end up touching it anyway
- Losing leads to emotional trading and overtrading
This just keeps repeating.
So, what should you choose?
Here, the answer seems to be coming into view.
■ What makes a good logic
✔ Simple for anyone
✔ Reproducible anytime
✔ Reduces unnecessary entries
And most importantly:
“Knowing when not to act.”
■ Next time teaser
“Then what are those unseen conditions?”
From here, we’ll get to the real core.