

2026/4/25 Dollar/Yen, Gold, SP500, and Nikkei 225 environment
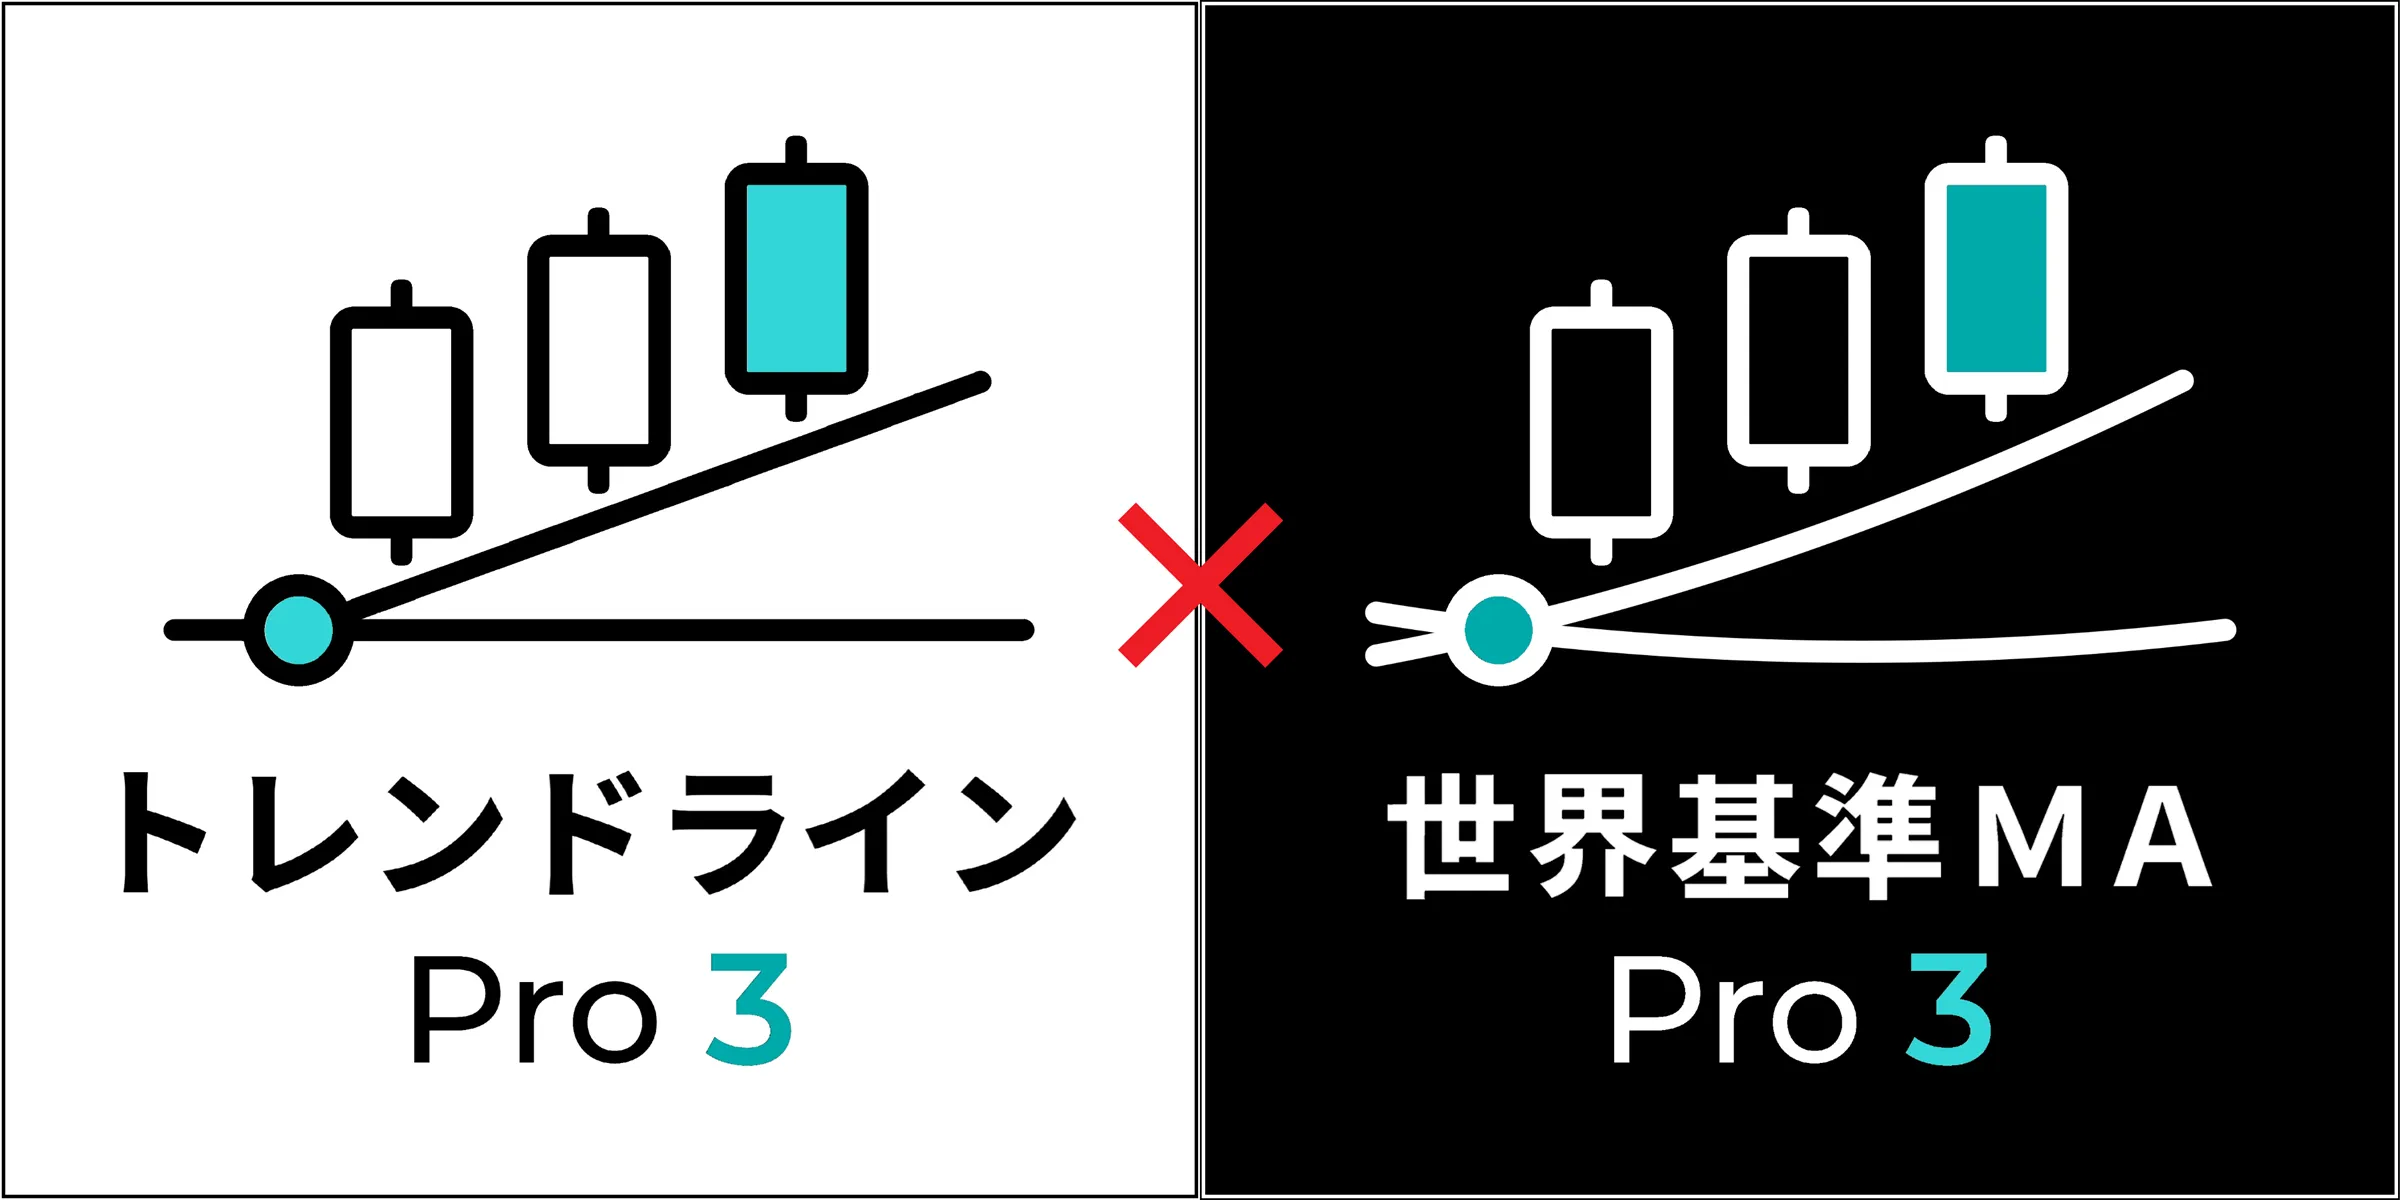
『Trendline Pro3』Test release
『World Standard MA Pro3』Test release
The attached indicator uses the above indicators.
※ The product page has not been created yet.
※ The product itself is complete and has been uploaded.
As a recent update, a manually movable trendline was overlaid on the alert trendline.
By moving this up and down, it becomes a channel line that triggers alerts.
Please check how the lines and MAs function as supports/resistance.
For verification, we prepare a weekly video of the USD/JPY price movement.
USD/JPY
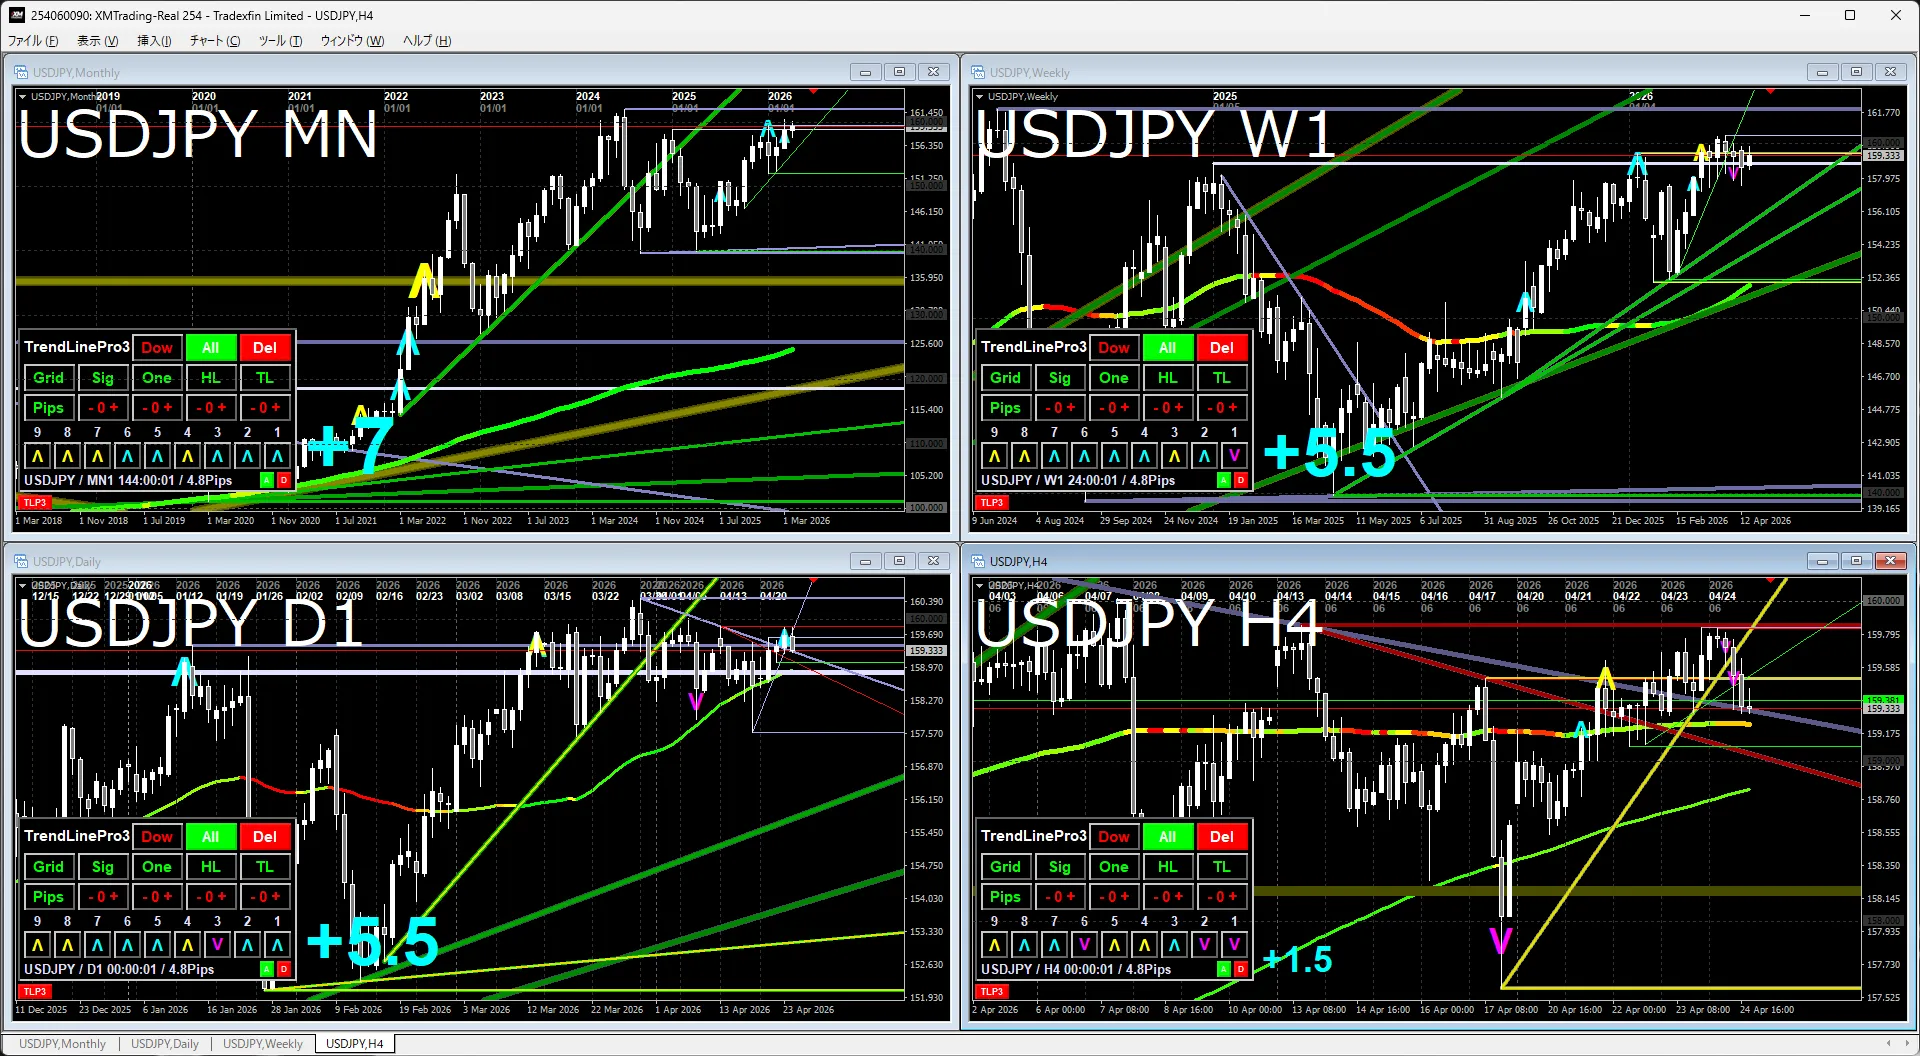
Monthly and WeeklyThe recent sideways trend clearly shows a continued rise. Next, it seems it will test the monthly high.
Daily and 4-hourAre flat. There is a possibility of a slight retracement downward, but a flag-like upward move is often anticipated.
Gold
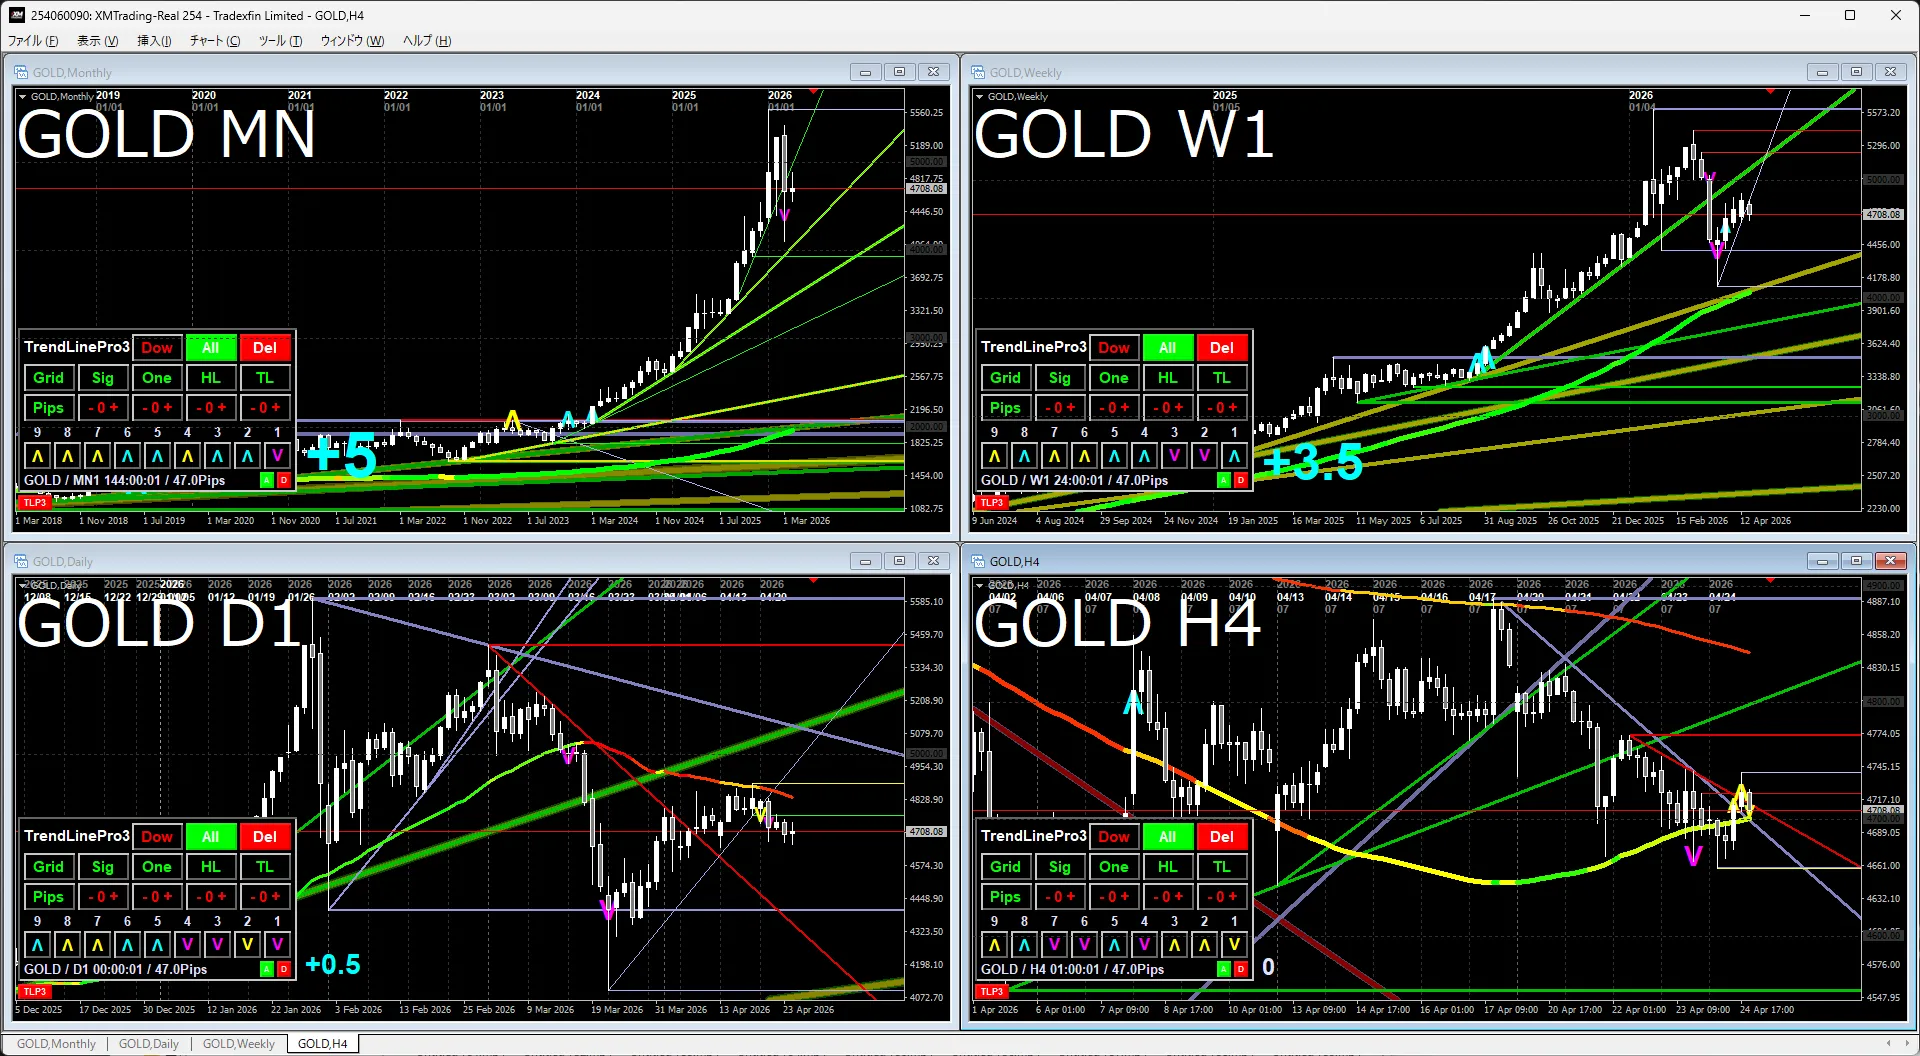
Monthly and WeeklyAttention is focused on currency depreciation, and gold remains a clear buy, though in a correction phase.
Daily and 4-hourLow and high are both descending, recently with a strong lower wick, and dropped by the MA, so the direction is still unclear. It may continue for a bit longer.
S&P 500
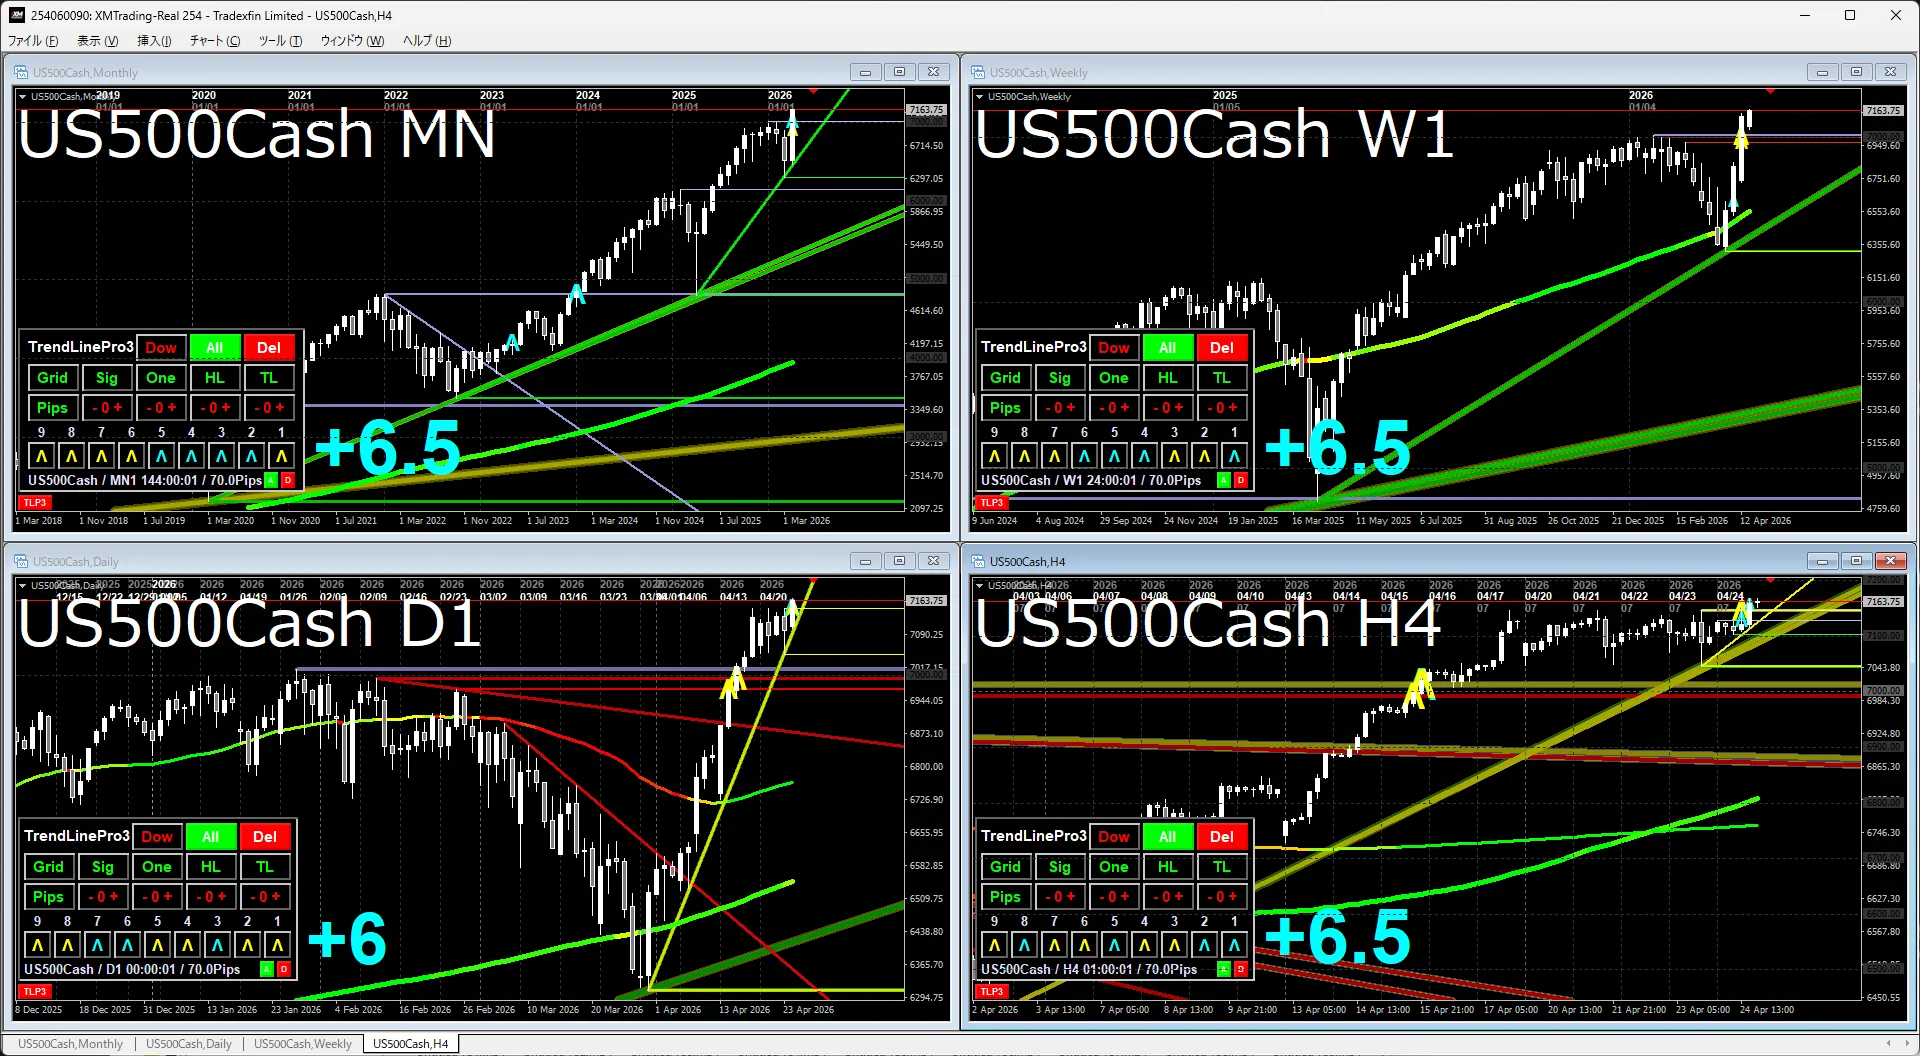
Monthly and WeeklyHas surpassed the recent highs, confirming continued rise. By cultural preference, buying tends to occur.
Daily and 4-hourThe deviation from the MA is a concern, but the uptrend environment remains conducive to gains.
Nikkei 225
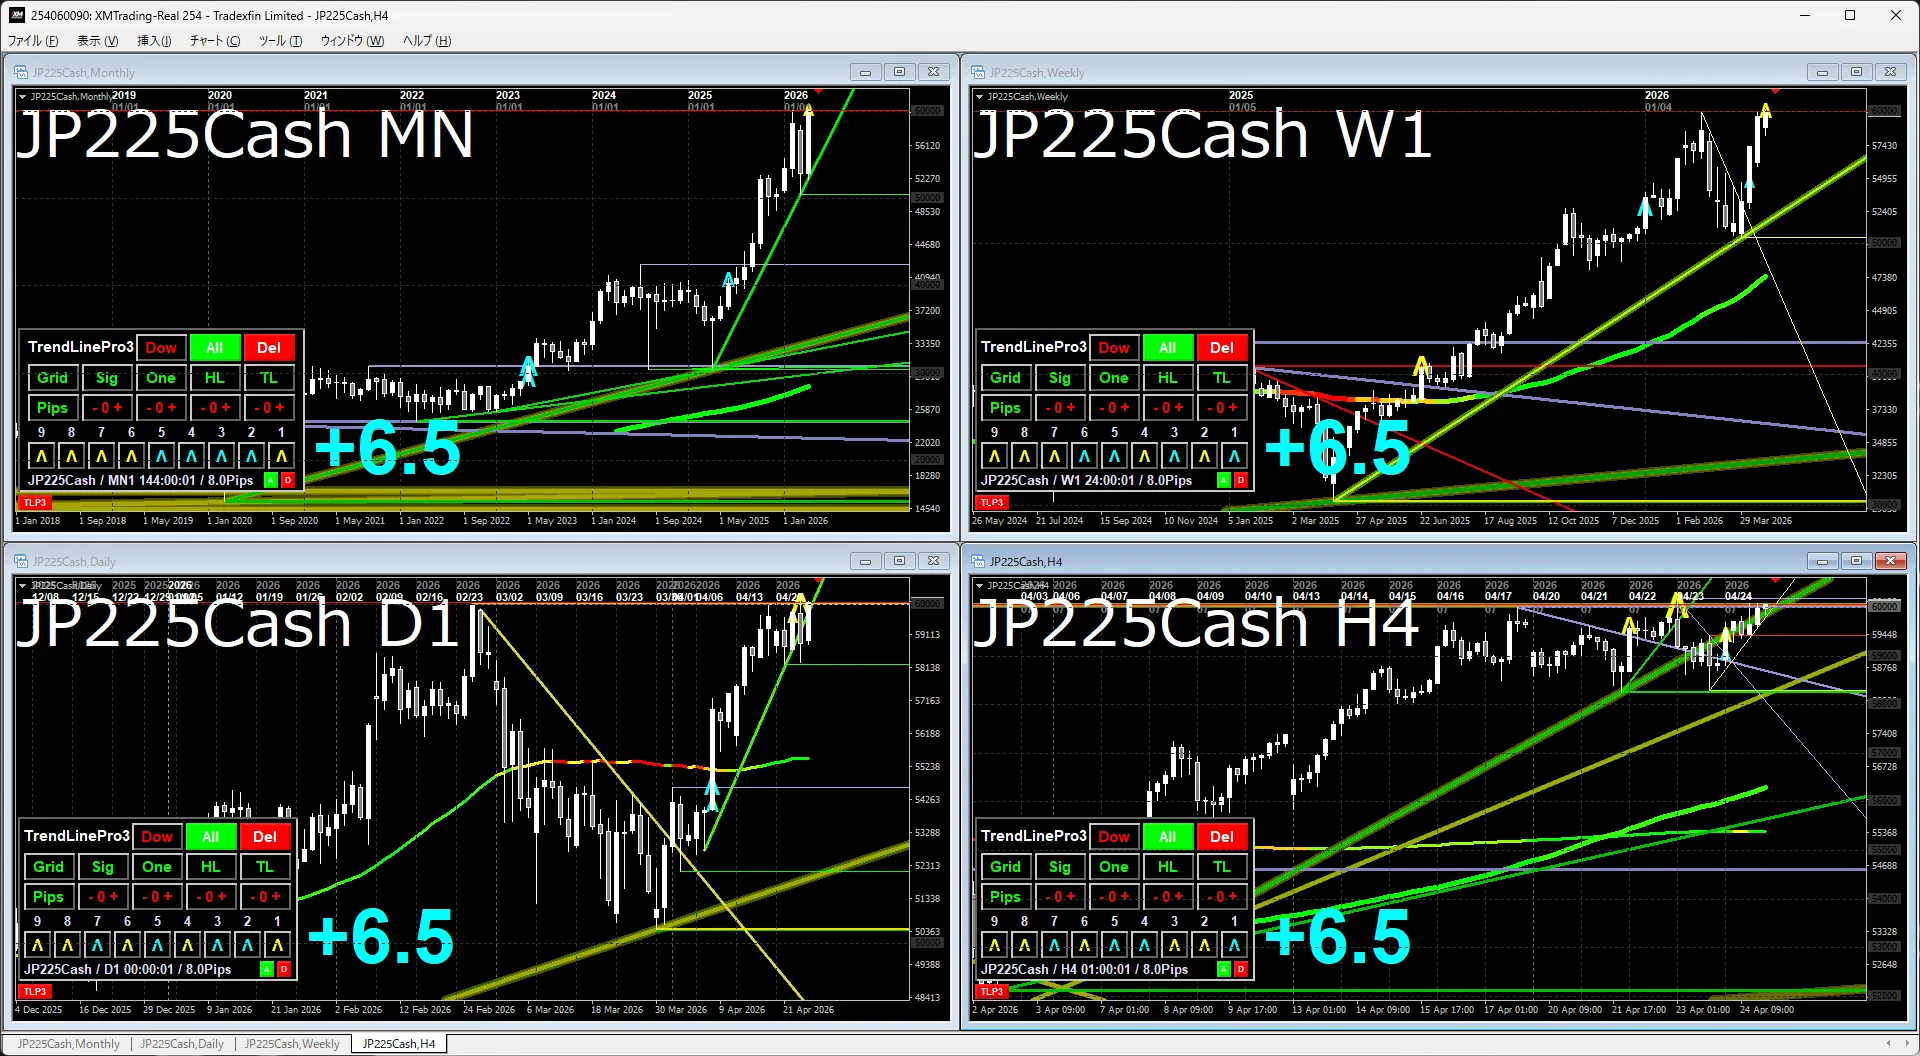
Monthly and WeeklyNew highs and trendlines have been redrawn, but this line drawn with two points is not yet strong. We are watching to see if this angle of trend is maintained.
Daily and 4-hourRecently updated to break the 60,000 level. In past breakouts of 20k, 30k, 40k, and 50k, moves were sluggish, so I’m curious how this time will unfold.
The attached indicator uses the following indicators.
If you’re interested, please take a look.
『Trendline Pro3』Test release
『World Standard MA Pro3』Test release
I’ve shown a down-arrow button, but there is no continuation.
I’ll add a brief aside here.