
Episode 2: The Illusion of "High-win-rate AI Tools"
Episode 2:
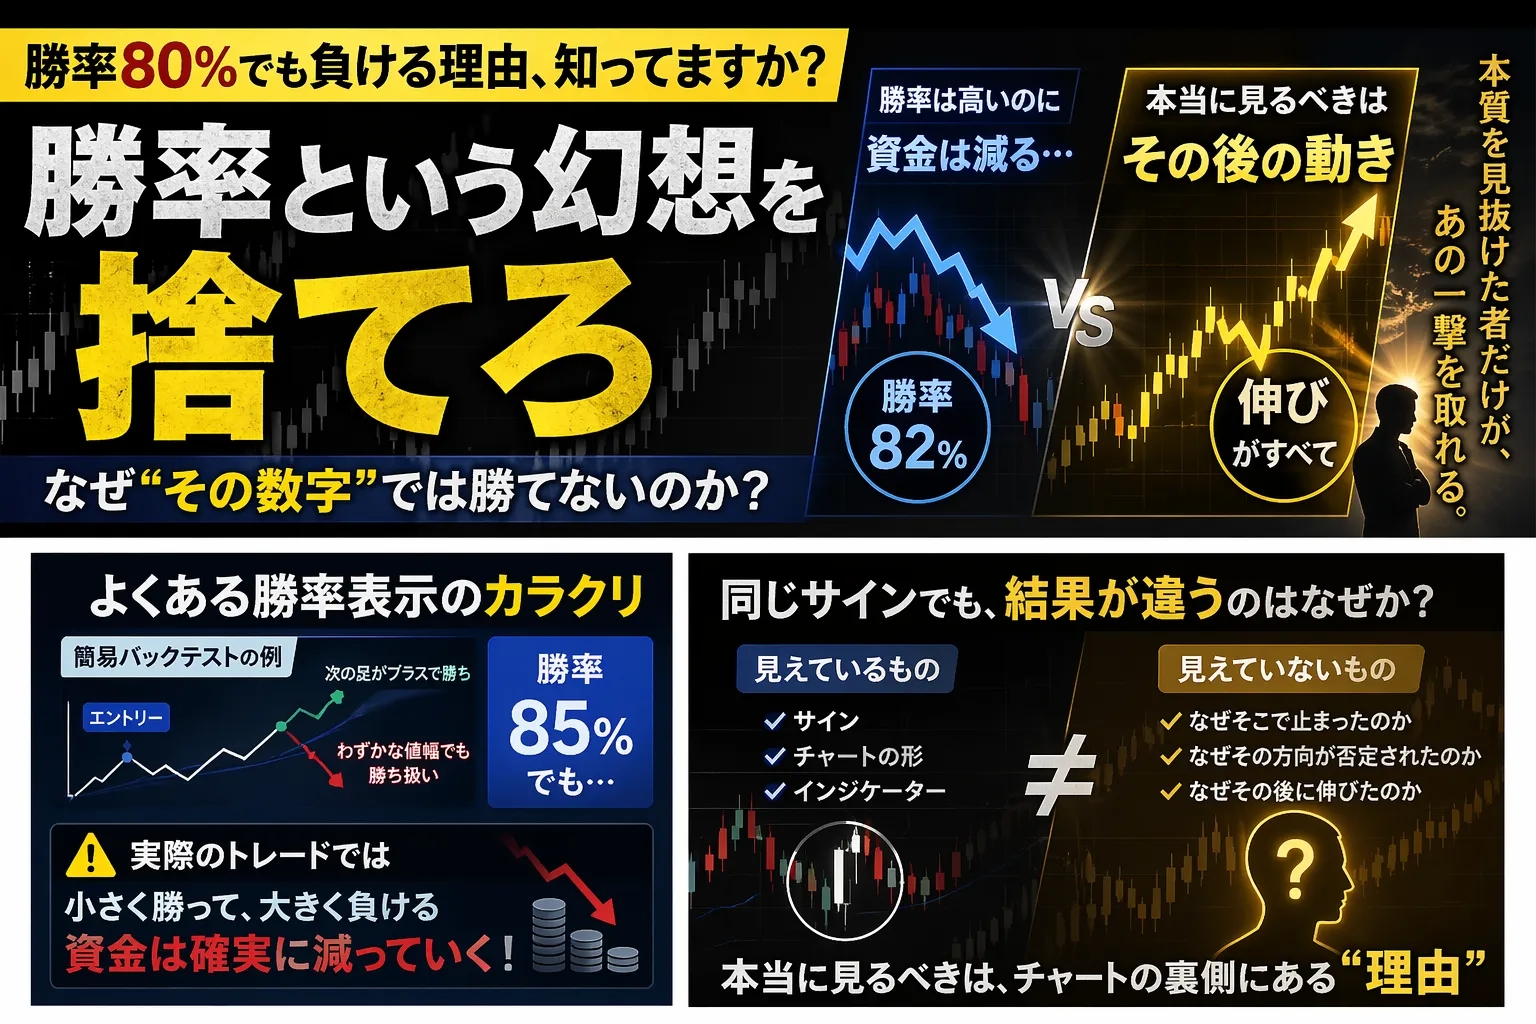
Reasons to Reject the Illusion of a “Win Rate”
Why can you win with that number, yet still not?
Last time, under the theme of “Learning AI vs Non-learning AI,”
we explained why a future-proof logic is necessary.
And this time is the continuation of that.
So, what criteria should you use to choose a logic?
Before getting into the answer, there is something you must break first.
■ Does that “win rate” display really have meaning?
When you start trading, you inevitably see it.
- Win rate 80%
- Win rate 90%
- Highly accurate signals
At first glance, it looks strong.
But, here is one question.
Do you know how that win rate is calculated?
■ The true nature of simplified backtesting
Many indicators or tools display
“recent win rate”
but
the content inside is surprisingly simple.
■ Common evaluation methods
- After entry, if the next bar’s open is positive, it’s a win
- If the price rises even slightly a few bars later, it’s a win
With this,
even a small price movement counts as a win
in the win rate.
What happens with this?
As I discussed in Episode 1
Win rate can be increased arbitrarily
=Overfitting
Thus, the conclusion is.
■ Why that still doesn’t lead to winning
This is the most important part.
The problem is that you are not looking at the
“risk-reward.”
Or rather, you are ignoring it.
That is the core issue.
For example,
- +1 still counts as a win
- -20 still counts as a loss
If you trade in this structure repeatedly,
Even with an 80% win rate,
your capital will keep shrinking.
This is a trick of numbers
In reality, the win rate is
“the easiest indicator to tweak”
it is.
■ Why is that?
- You can change the decision criteria midway
- You can change the time frame
- You can change the viewing period itself
In other words, with a slight tweak
you can make it look “better” you want
as a metric.
■ So, what should you look at?
Here, for the first time, we reach the main topic.
What is truly important in trading is
not whether the direction was correct, butthese are:
“What happened after that?”
■ Key points to actually look at
- Reactions from the initial move
- How far it extended
- Where it stalled
Did it reach the set take profit or trailing trigger?
Or was it a BE (break-even) exit?
Was it hit by a stop loss?
Only by looking at this can you determine
whether it’s a usable logic.
■ Why does the outcome change every time
Here is the sensation many people feel.
“It looks like the same signal, but the result varies every time.”
This is not a coincidence.
Because the unseen conditions are different.
■ What’s visible vs what’s invisible
What’s visible
- Signals
- Chart patterns
- Indicators
What’s not visible
- Why it stopped there
- Why that direction was negated
- Why it extended afterward
This is the part of trading that cannot be gauged by win rate alone,
the essence of trading.
■ The more you do it, the harder trading becomes
Let’s return to reality here.
“The conditions that should be traded are
not that frequent.”
Because of that.
■ Therefore, what tends to happen is ↓
- You can’t wait for a chance
- You end up making a trade anyway
- Losing leads to emotional, reckless trading
This is simply repeated.
So, what should you choose?
Here, the answer seems within reach.
■ What makes for a good logic
✔ It is simple for everyone
✔ It can be reproduced anytime
✔ It reduces unnecessary entries
And most importantly, this:
“Knowing when not to act”
■ Preview of next time
“So, what are those ‘unseen conditions’?”
This is where the real core begins.