

Why reducing the FX indicator reveals the "opportunity to win": the fastest technique to read crowd psychology with candlesticks
“Buy because this indicator has formed a golden cross”
“Sell because RSI is oversold, so counter-trend”
If you’re chasing such “numbers” or “signs” and not winning, try clearing your chart to white once.
I, too, once flooded my charts with indicators from anxiety.
But the conclusion I arrived at from nine years of experience was astonishingly simple.
The main actors in the market are not the “indicators,” but the “human psychology” that gathers around them.
What most quickly and accurately reflects that psychology is not processed data, but the actual moving “candles of price action itself.
In this article, I’ll explain why reducing indicators helps you win, and share a thinking method to read the essence of the market with price action (candlesticks), including my personal experience.
Why are candlesticks the fastest?
Indicators are lagging indicators that calculate past prices and display them afterward. No matter how excellent an indicator is, because it passes through a formula, it lags one step behind market moves.
On the other hand, every single move of a candlestick encapsulates real-time the expectations, fear, and hesitation of traders around the world.
- Long wick:A strong rejection: “I won’t let it go further from here.”
- Body is large:A strong consensus to push in one direction.
If you can read this “crowd psychology,” you can anticipate the next market move before the indicator signals appear.
“Chart patterns (shapes)” are clusters of psychology
The value range trading I prioritize is judged by the shapes created by these candlesticks.
Flags, tops, double bottoms….
These shapes are not mere coincidences.
They are “patterns of crowd psychology” formed when many people respond in the same way at specific price levels.
When you can see these “shapes,” you can discern where the market energy is heading (i.e., the potential price range).
Focusing on this “shape” is far more accurate for predicting the goal than worrying about indicator values.
For example, the Three White Soldiers
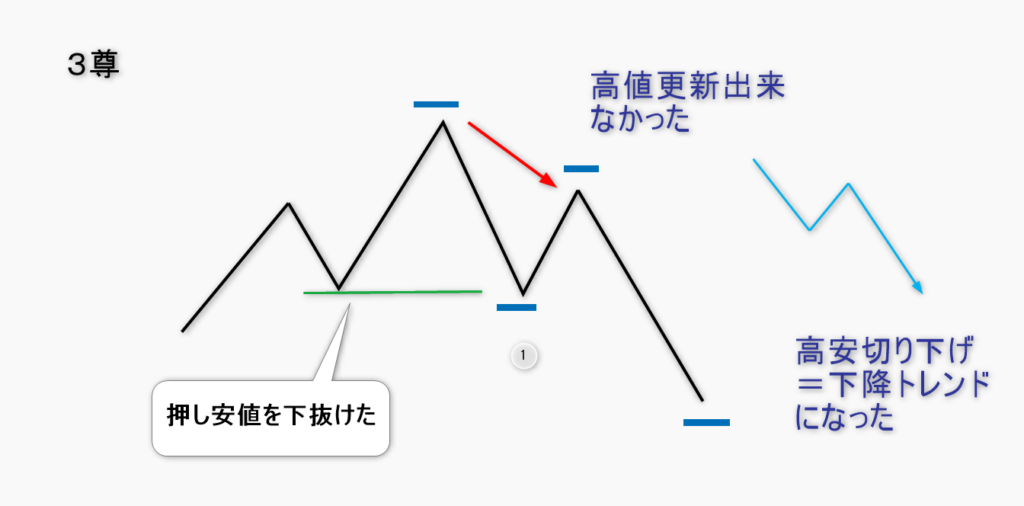
①, if it doesn’t break the swing low and the high is not updated, the uptrend remains and buying is favored;
If it fails to make a new high and breaks below the swing low, the low of ① is broken, then it can turn into a downtrend;
Each of these shows a psychology turning bearish.
Smart way to deal with indicators
“So, should I get rid of indicators entirely?” That isn’t correct.
What matters is not confusing the hierarchy.
- The lead (80%): CandlesShape of the candle and price action (psychology)
- The support (20%):To confirm the trend direction, such as moving averages
Limit indicators to one or two that you are good at.
More than that becomes noise that confuses your judgment.
Rather than being ruled by tools, use tools to see the essence of price movement more clearly. Once you have this sense, trading becomes surprisingly easy.
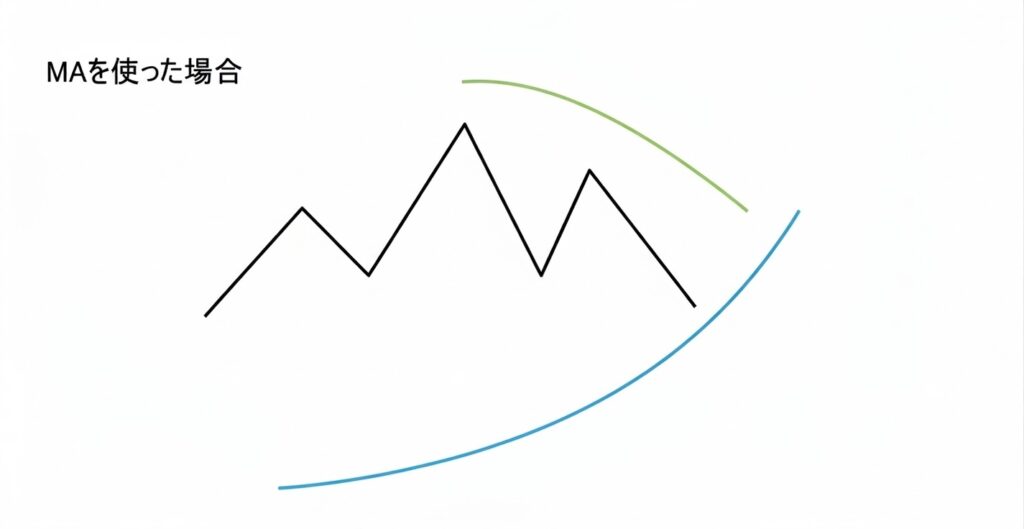
Even with the Three Soldiers, the edge changes greatly whether the 20MA comes from below in blue or is suppressed from above in green, making false signals less likely.
Chart patterns are not 100% certain, so using indicators as support helps make more robust judgments.
But if you overdo it, you’ll increase confusion and be more easily deceived.
When I was a beginner and not winning, I tried adding many indicators and tweaking numbers, but confusion increased
and reproducibility dropped, and entry frequency became extremely low,
so reducing them made visuals and judgments much clearer.
Summary: Simple charts are the fastest route to becoming a winner
Shrinking indicators may be scary at first. Yet that courage is the first step to cultivating genuine market sense.
First, start clearing your chart from today and listen to the psychology your candles speak.
There are two methods available on GoGoJungle ⇩
Yo-san’s profile -- A marketplace of trading methods and tools from around the world - GogoJungle