[Understanding FOMC through FX videos: Session 2] Koichiro Amaya provides a careful explanation of how to read dot plot charts
Market storyteller, Koichiro Ameya, kindly explains FOMC in an incredibly approachable way in this three-part video series. The second installment is “How to Read Dot Plot Charts.” (Interviewed by FX攻略.com editorial staff, Kanae)
※ Purchasers can also download the lecture materials (PDF files) used in the videos.
What you can learn from this video
This video covers the following topics.
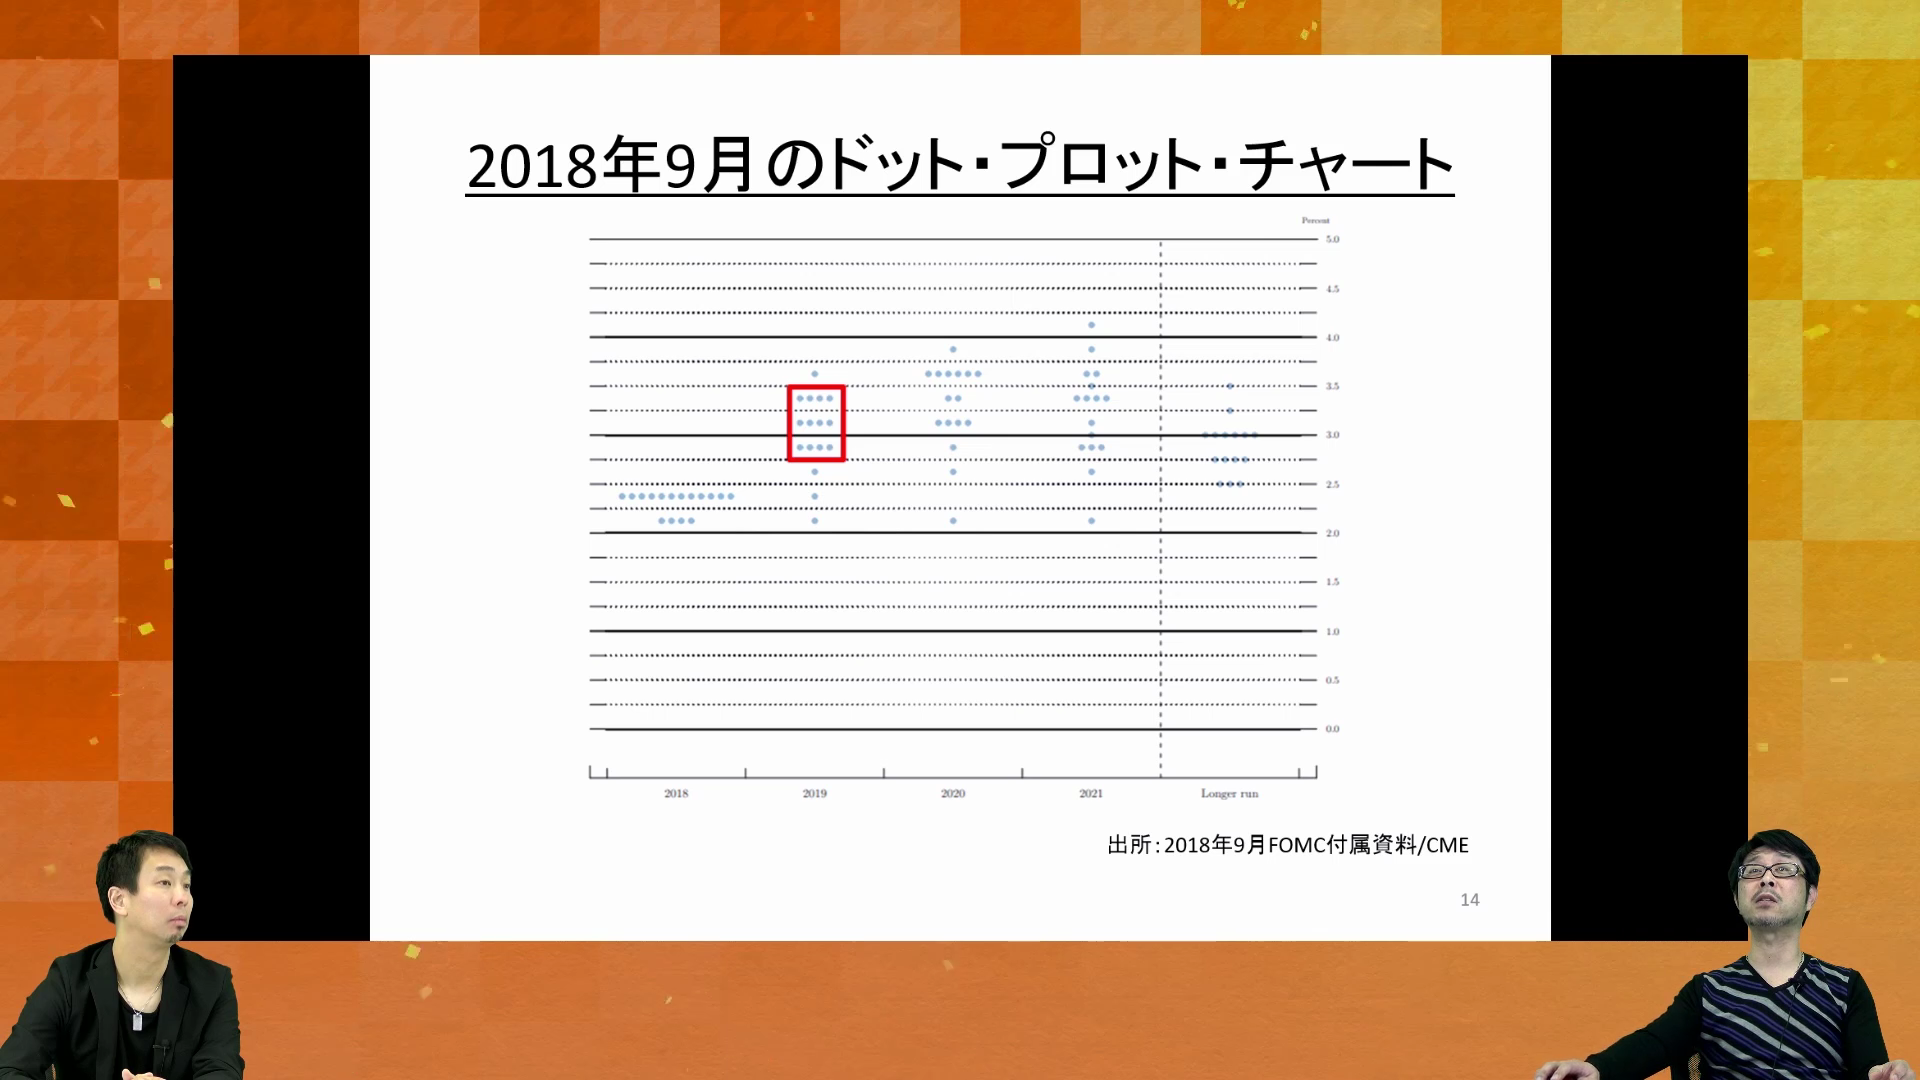
- Where can you view the dot plot chart?
- How to download important files
- The changes that occurred in September 2018 and December 2018
- Forecasts for GDP and inflation
- From the dot plot chart, you can glean quite a lot about current and future interest rates
● Video: 11 minutes 54 seconds
Koichiro Ameya profile

Over more than 20 years, he has held senior foreign exchange positions at major foreign banks such as UBS, JP Morgan, and BNP Paribas. He has a history of ranking highly in the Tokyo Foreign Exchange Market Popular Dealer Rankings in the financial trade magazine “EuroMoney.” In 2006, he became a freelance financial analyst, providing FX market information to FX companies and portal sites from his sharp, independent perspective.
Official Twitter:https://twitter.com/geh02066
A word from the editor in charge, Kanae

To those who have always found fundamentals analysis mysterious, please watch this video. You may think, “Huh, it’s actually quite simple.”
In fact, there is a lot of information and precision that tell us how future interest rates will move. It comes from overseas media, but you don’t need to read English to understand it.
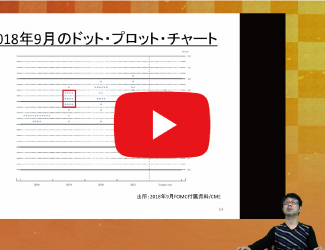
How to view the FX method videos
The portion that you can view after purchasing the article (at the bottom of this article) embeds FX method videos. Click the play button to start the video.
You can also download the lecture materials.