

Gold Analysis 2026/04/21
This is a rebound from a gap, but since it failed to close above the 60 MA where the bearish candle started, it is interpreted as a V-reversal failure (in the morning).
【4-hour chart】
From the open, it dropped after gapping down, but the MA remains in a GC state.
As for the short-term direction, it looks downward, but be mindful that the price is squeezed between the daily 60 MA in DC and the 4-hour 60 MA in GC.
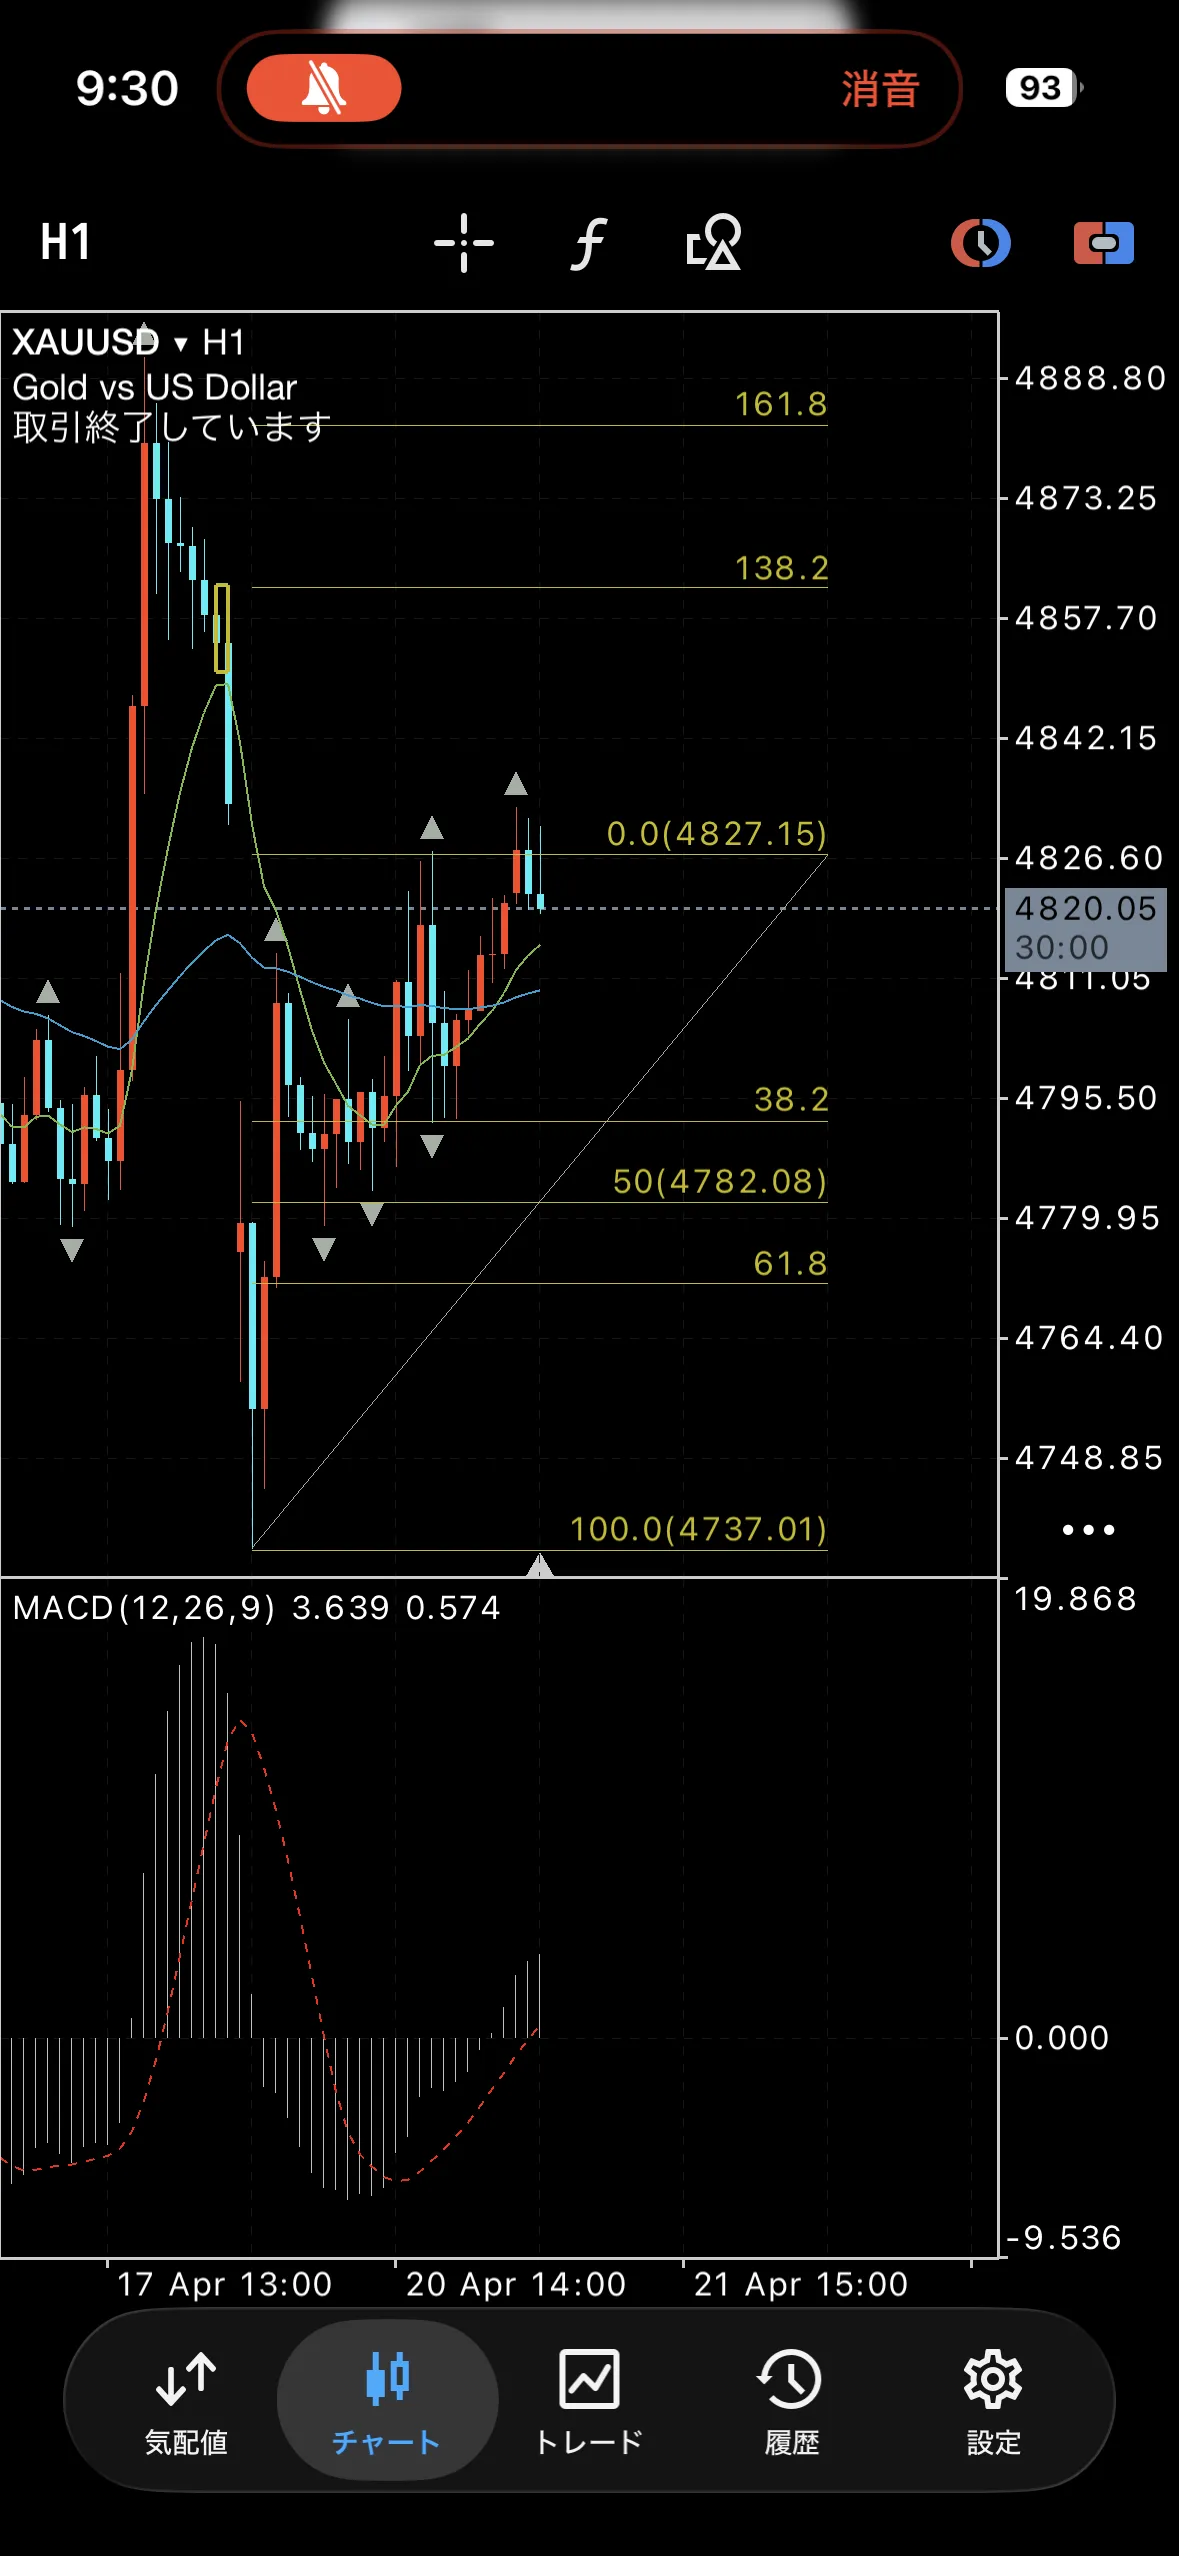
【1-hour chart】
This one has just crossed, but it could move up and down within a range as well.
There is a fact that the recent low was updated, so until the high is updated, the bias is bearish or range-bound.
【Defensive line for selling】
4882
4861
4827
【Defensive line for buying】
4792
4782
4771
4737