
Simple design indicator OMEGA that only waits for the signs determined by MT4 (with video)

① Simple design that waits for a predetermined signal
② Visually visualize market direction in a simple way. Suitable for beginners to advanced
③ Intuitive design that only displays up and down, catering to a wide range of traders
Currently, market signal status is normal.
(New videos)


① High win-rate buy/sell signal indicator
Trade history10+ years of experience, 整理 and testing of numerous oscillator-based methods, and improved over about5 years. This is an indicator.
Displays multiple indicators at the same time, and judges matching conditions by eye, but this method can cause missed opportunities and visual strain that leads to misjudgments.
This tool internally combines multiple indicators,and only displays arrows (⬆︎⬇︎) at points where conditions are met, in a simple way.Also, to avoid missing opportunities,trade signals are available as alerts on smartphones.The appearance is very simple, butinternally the program processes multiple conditions precisely,and is designed to suppress unnecessary signals.Regarding actual behavior,we publish verification videos recorded on long-term charts without cuts,so you can confirm it in a form different from資料 that only capture favorable conditions.⬇︎With a simple chart structure, reduce uncertainty in judgmentSupport stable trading② How to useA simple trading method: enter on the next bar when an arrow appears✅ STEP01:Set chart timeframe (5-minute chart recommended)✅ STEP02:An alert sounds at the entry point (smartphone notification available)✅ STEP03:Arrows (⬆︎⬇︎) appear on the chart at the same time as the alert✅ STEP04:Enter after the candle confirming the arrow③ About win-rate displayUpper left win-rate display (judgment result) is the win rate within a specified number of candles (default 3000).This means, on a 5-minute chart, a win rate for 10 days assuming 288 candles per day. Since markets are closed on weekends, this is the past two weeks of win rate from Monday to Friday.Long-term, the default display can show the best oscillator settings to minimize losing judgments. As you can see, the display is simple and there is no difficult interpretation!④ Specifications✅ Arrow appears ⟶ enter on the next bar✅ Signal filter specialized for contrarian signals✅ No repaint✅ Win-rate judged by a specified range of candles✅ One signal resolves within two entries✅ Recommended timeframe: 5-minute chart(Other timeframes can also display)✅ Alert sound on signal✅ Push notifications to smartphone (iPhone / Android⑤ Product contents✅ OMEGA Sign Tool Indicator✅ Bid_Line v2 (Indicator) to make price lines thicker and easier to see✅ Templates (Insert OMEGA Indicator and Bid Line v2 from Navigator)✅ Manual (PDF)
and only displays arrows (⬆︎⬇︎) at points where conditions are met, in a simple way.
Also, to avoid missing opportunities,
trade signals are available as alerts on smartphones.
The appearance is very simple, but
internally the program processes multiple conditions precisely,
and is designed to suppress unnecessary signals.
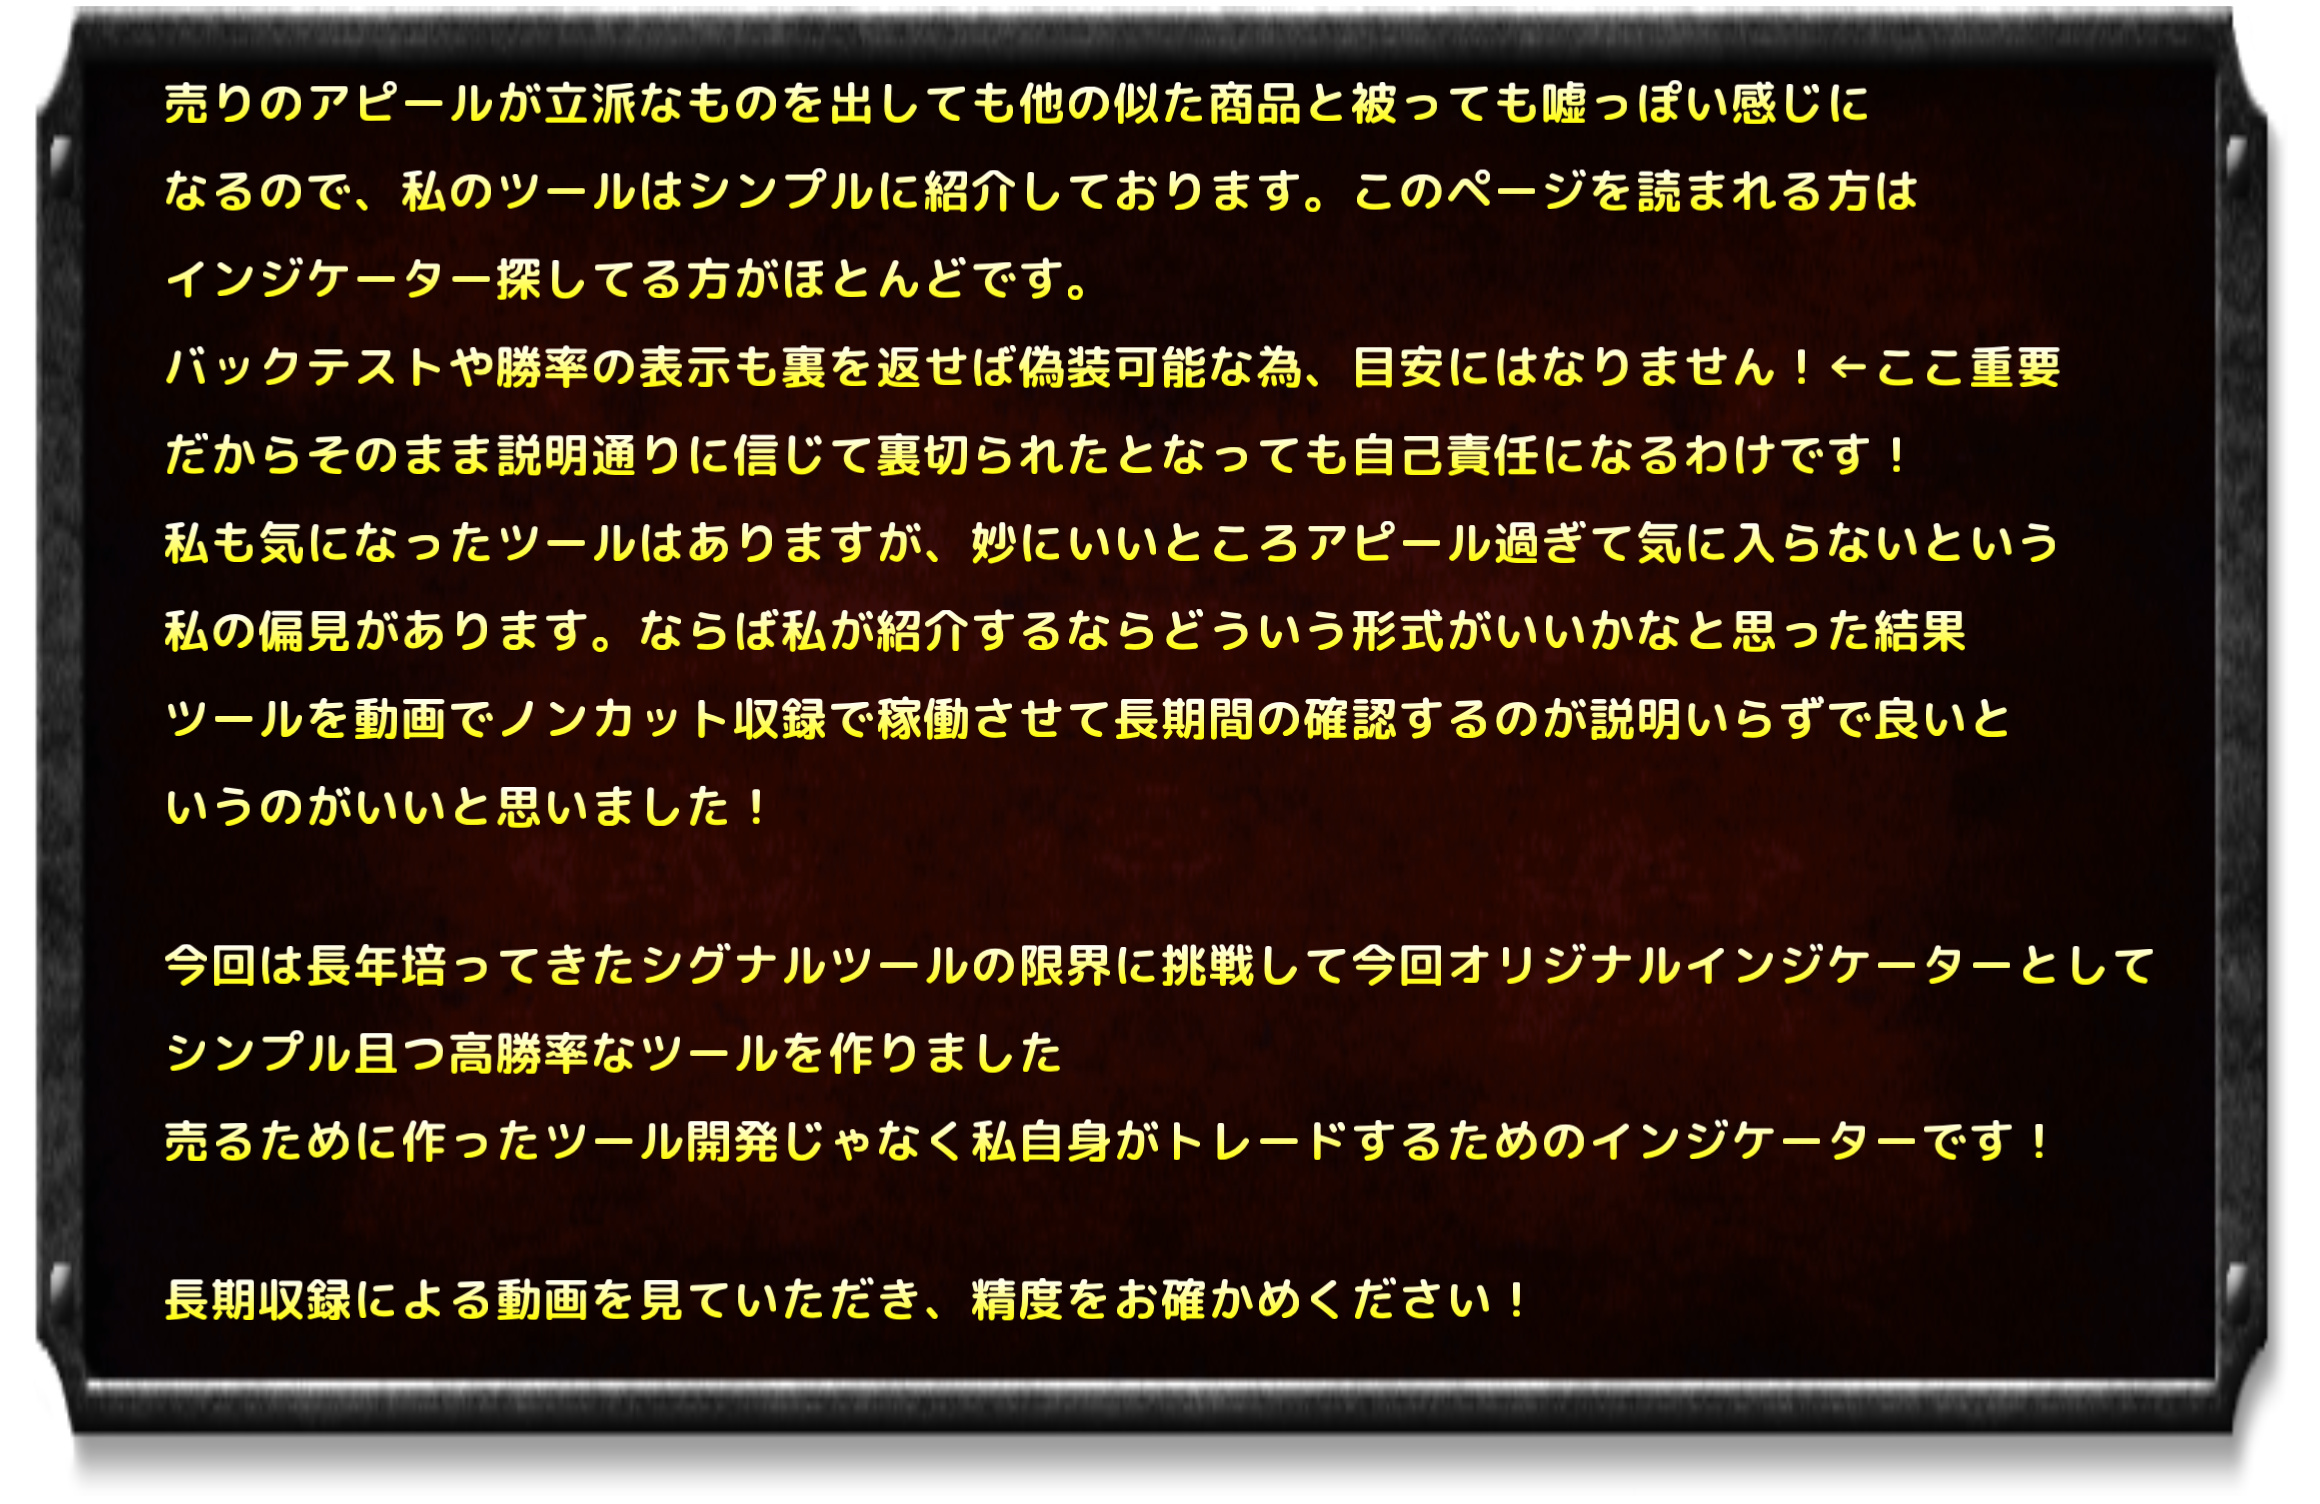
Regarding actual behavior,
we publish verification videos recorded on long-term charts without cuts,
so you can confirm it in a form different from資料 that only capture favorable conditions.
⬇︎
With a simple chart structure, reduce uncertainty in judgment
Support stable trading
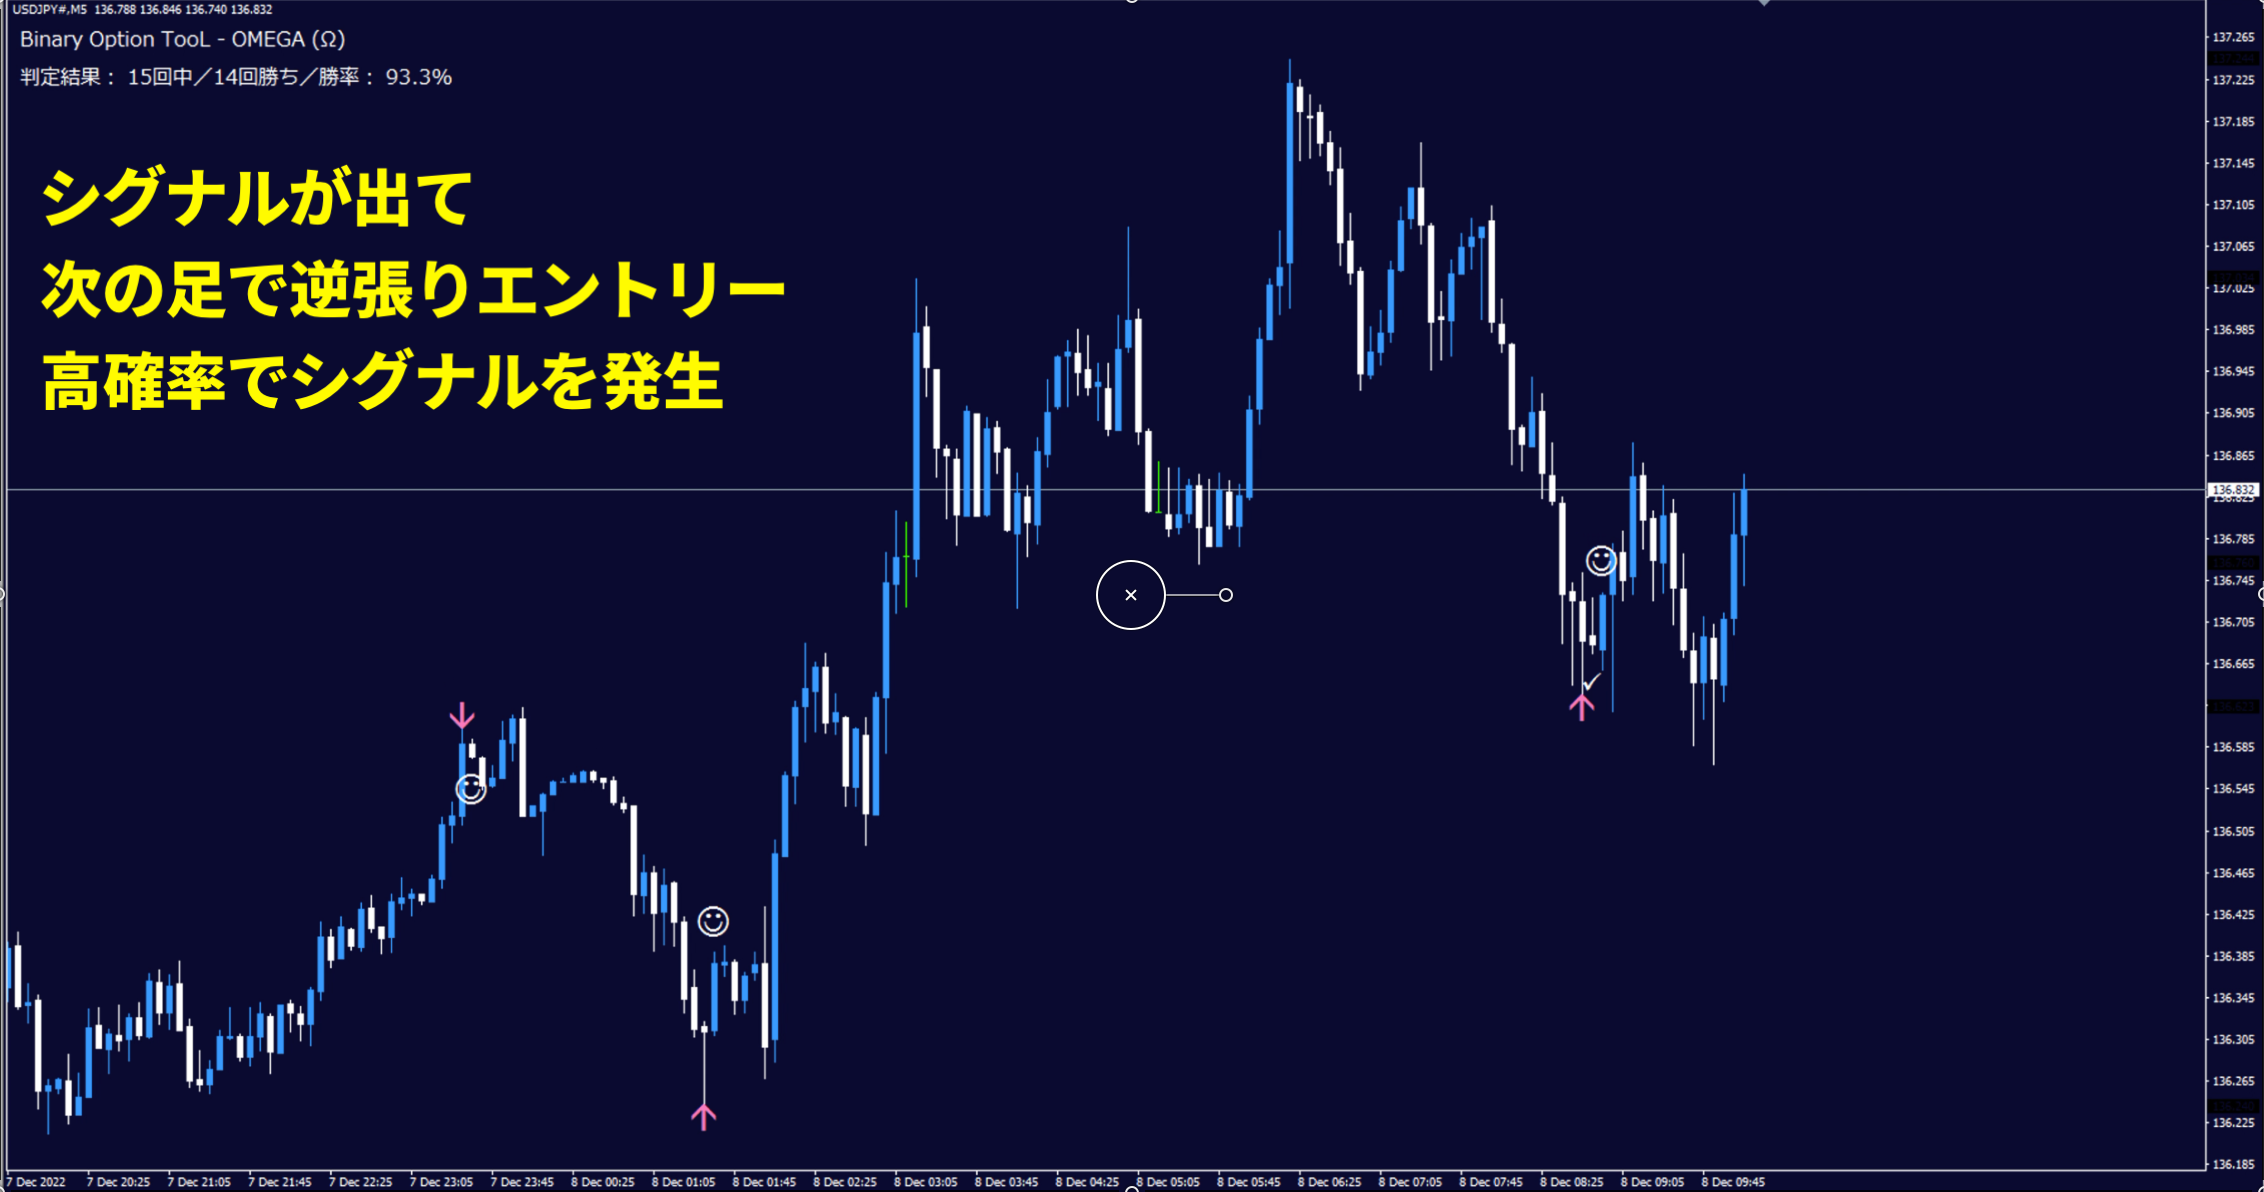
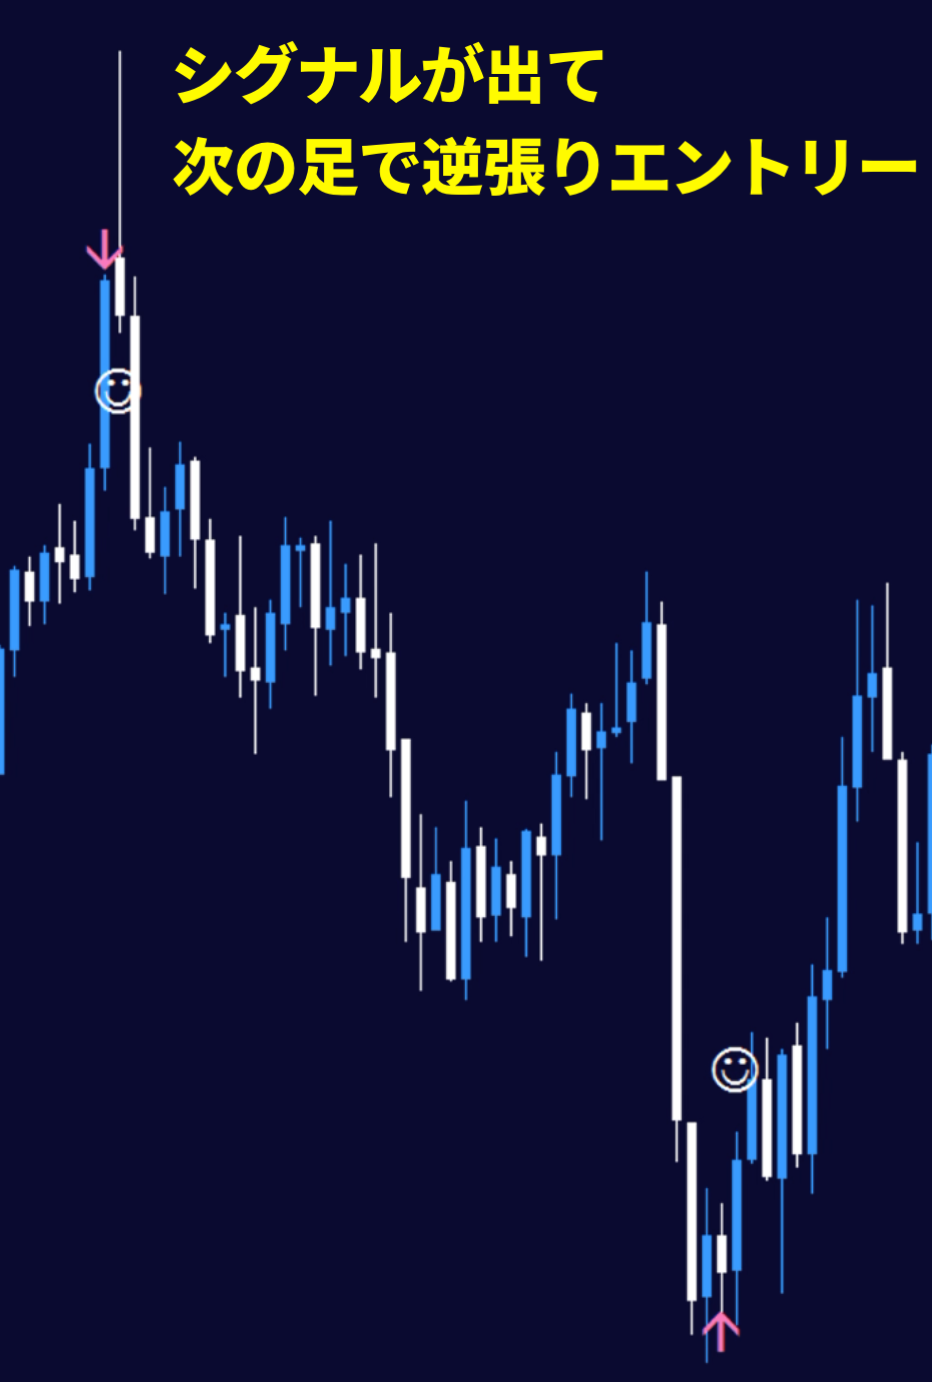
② How to use
A simple trading method: enter on the next bar when an arrow appears
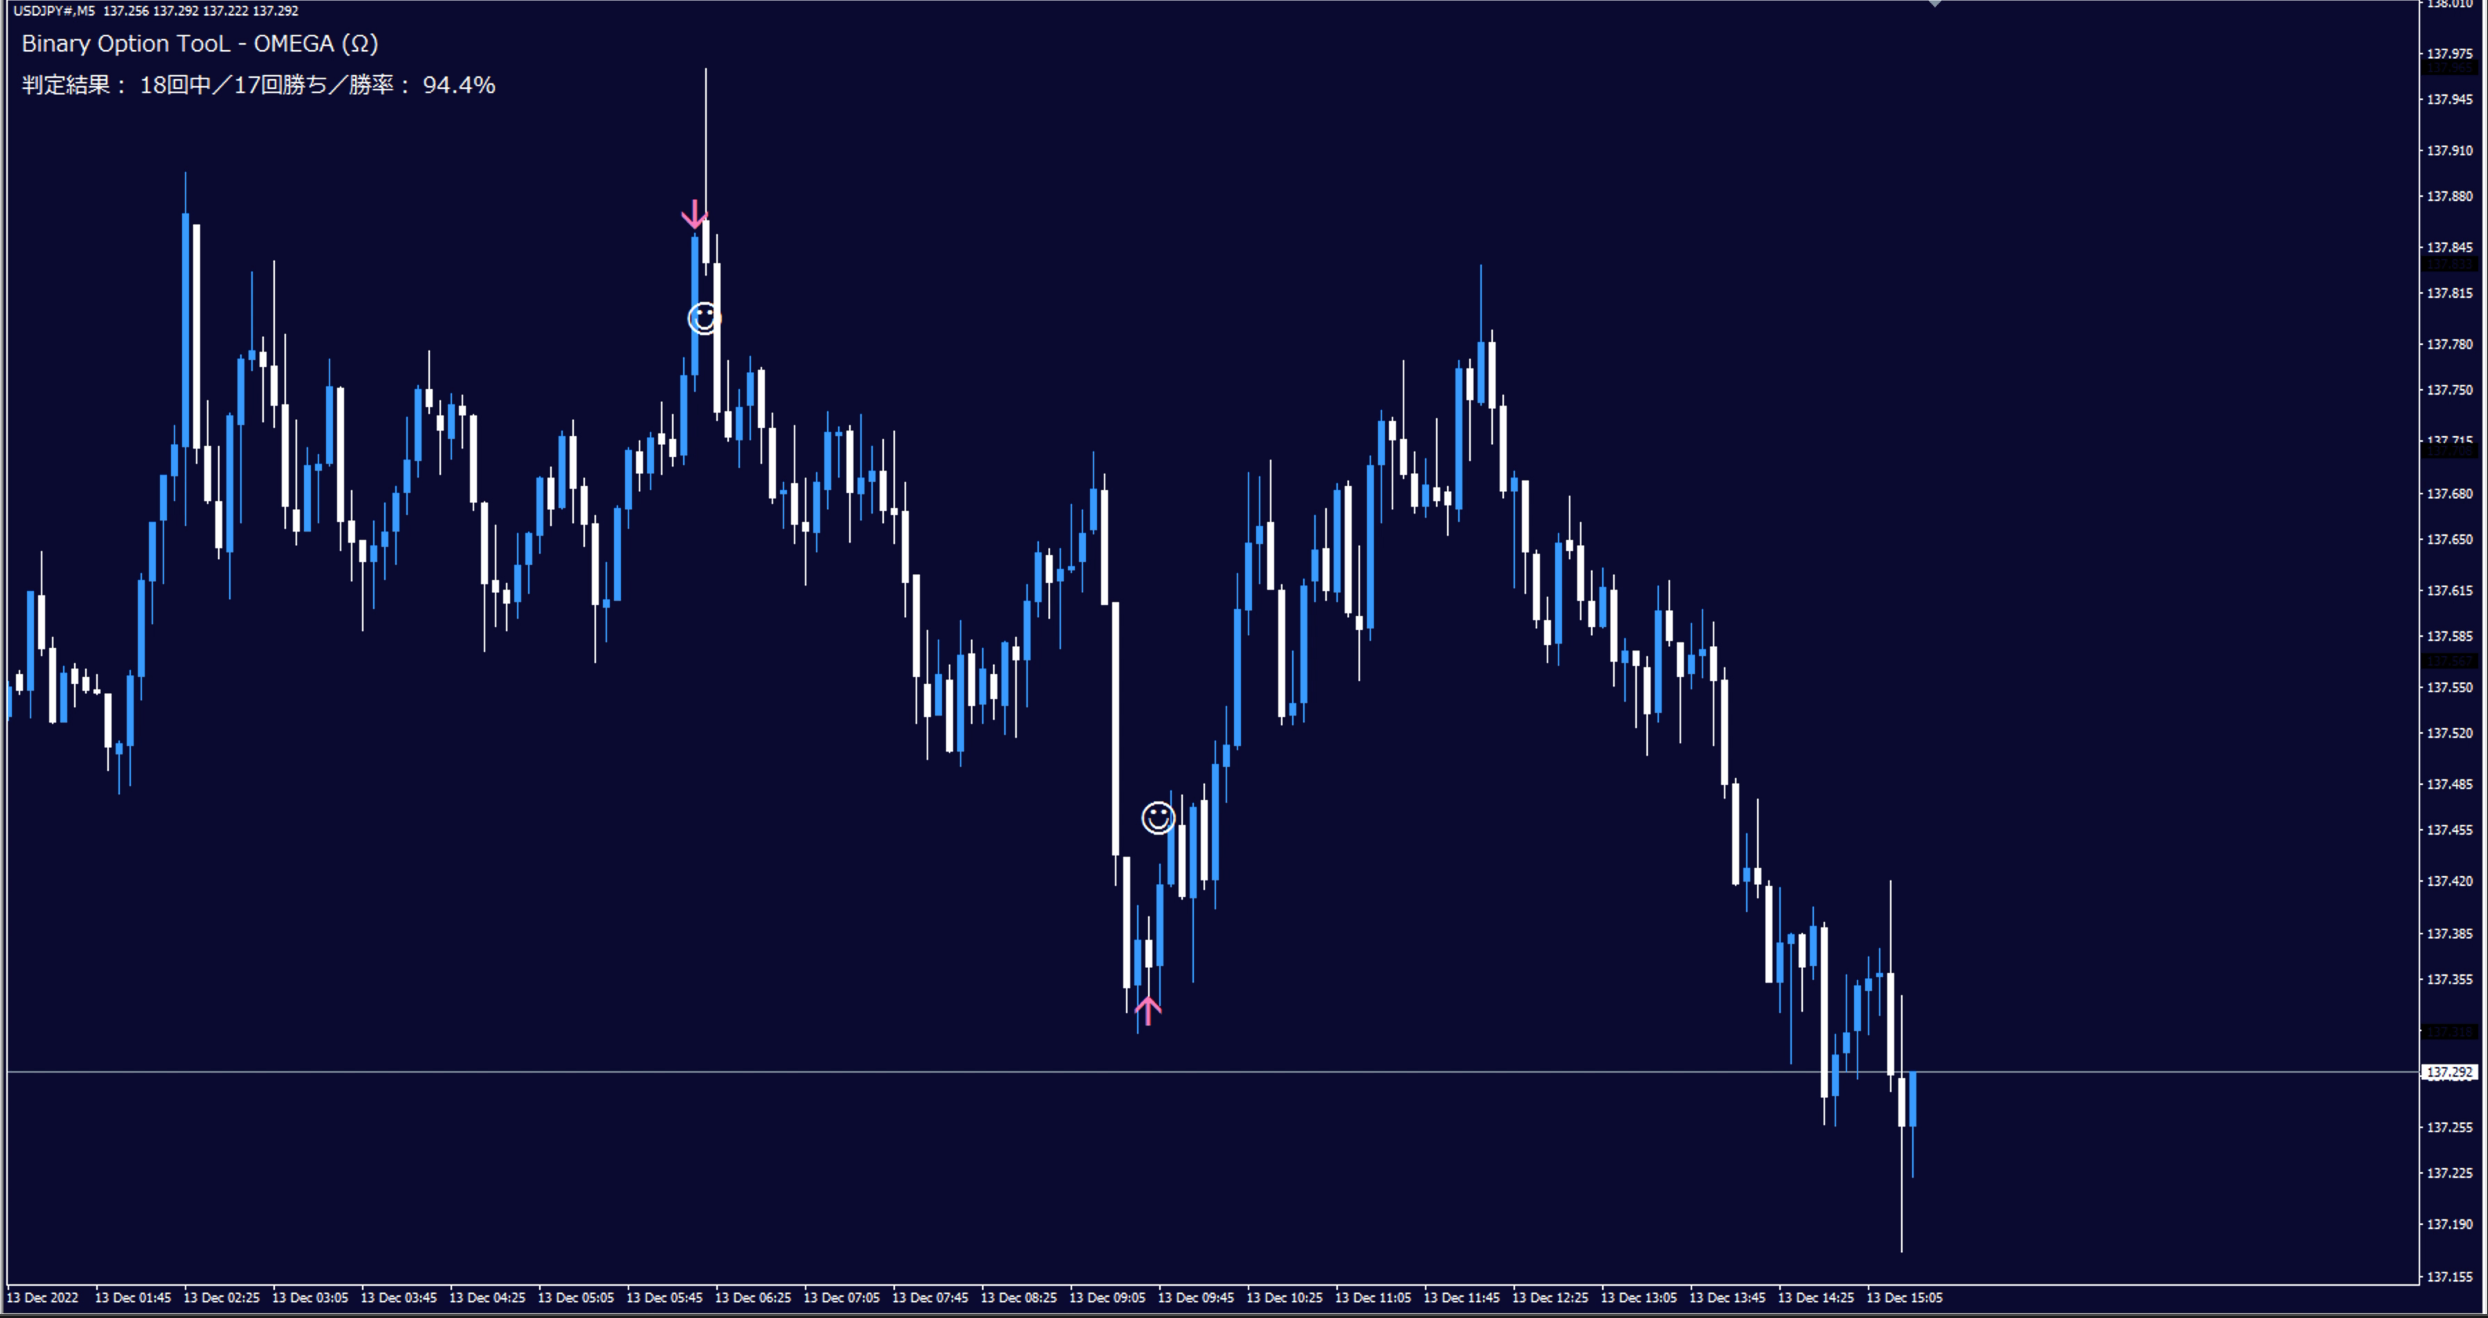
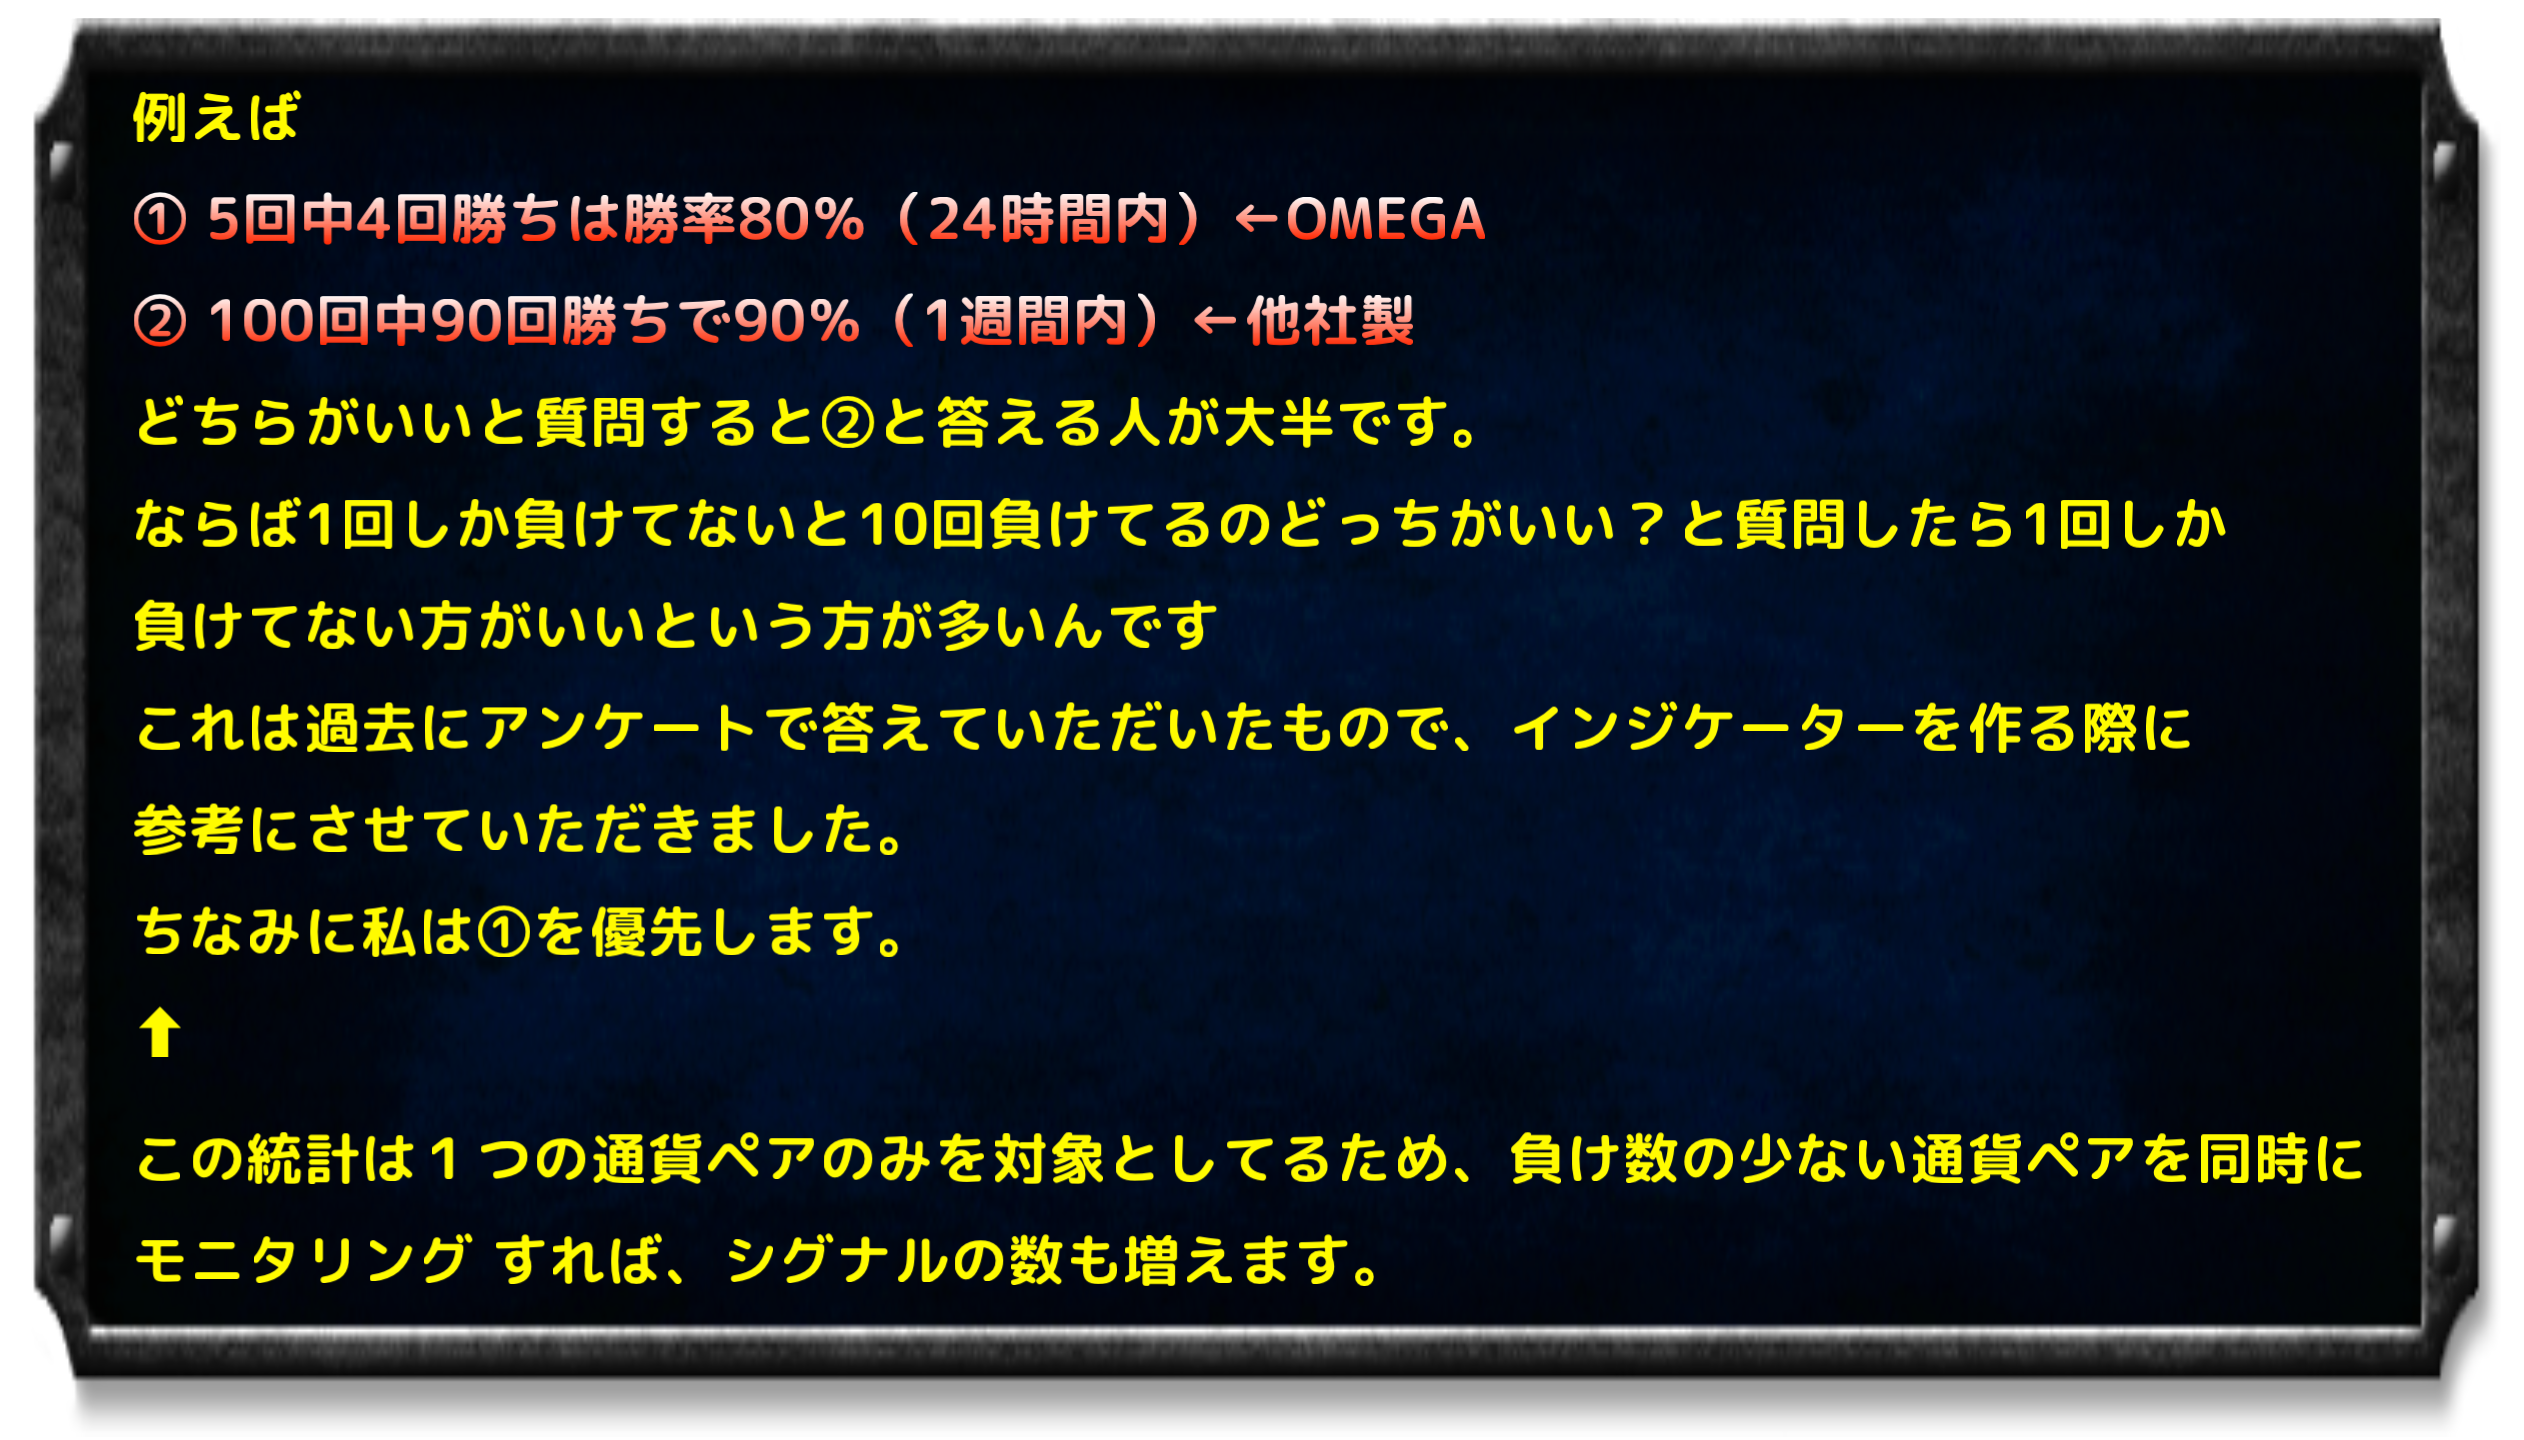
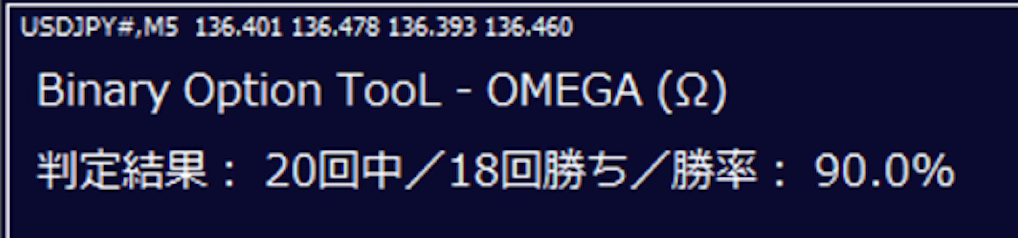
③ About win-rate display
Upper left win-rate display (judgment result) is the win rate within a specified number of candles (default 3000).This means, on a 5-minute chart, a win rate for 10 days assuming 288 candles per day. Since markets are closed on weekends, this is the past two weeks of win rate from Monday to Friday.Long-term, the default display can show the best oscillator settings to minimize losing judgments. As you can see, the display is simple and there is no difficult interpretation!④ Specifications✅ Arrow appears ⟶ enter on the next bar✅ Signal filter specialized for contrarian signals✅ No repaint✅ Win-rate judged by a specified range of candles✅ One signal resolves within two entries✅ Recommended timeframe: 5-minute chart(Other timeframes can also display)✅ Alert sound on signal✅ Push notifications to smartphone (iPhone / Android⑤ Product contents✅ OMEGA Sign Tool Indicator✅ Bid_Line v2 (Indicator) to make price lines thicker and easier to see✅ Templates (Insert OMEGA Indicator and Bid Line v2 from Navigator)✅ Manual (PDF)
This means, on a 5-minute chart, a win rate for 10 days assuming 288 candles per day. Since markets are closed on weekends, this is the past two weeks of win rate from Monday to Friday.
Long-term, the default display can show the best oscillator settings to minimize losing judgments. As you can see, the display is simple and there is no difficult interpretation!
④ Specifications✅ Arrow appears ⟶ enter on the next bar
✅ Signal filter specialized for contrarian signals✅ No repaint✅ Win-rate judged by a specified range of candles
✅ One signal resolves within two entries
✅ Recommended timeframe: 5-minute chart(Other timeframes can also display)
✅ Alert sound on signal✅ Push notifications to smartphone (iPhone / Android
✅ One signal resolves within two entries
✅ Recommended timeframe: 5-minute chart(Other timeframes can also display)
✅ Alert sound on signal