
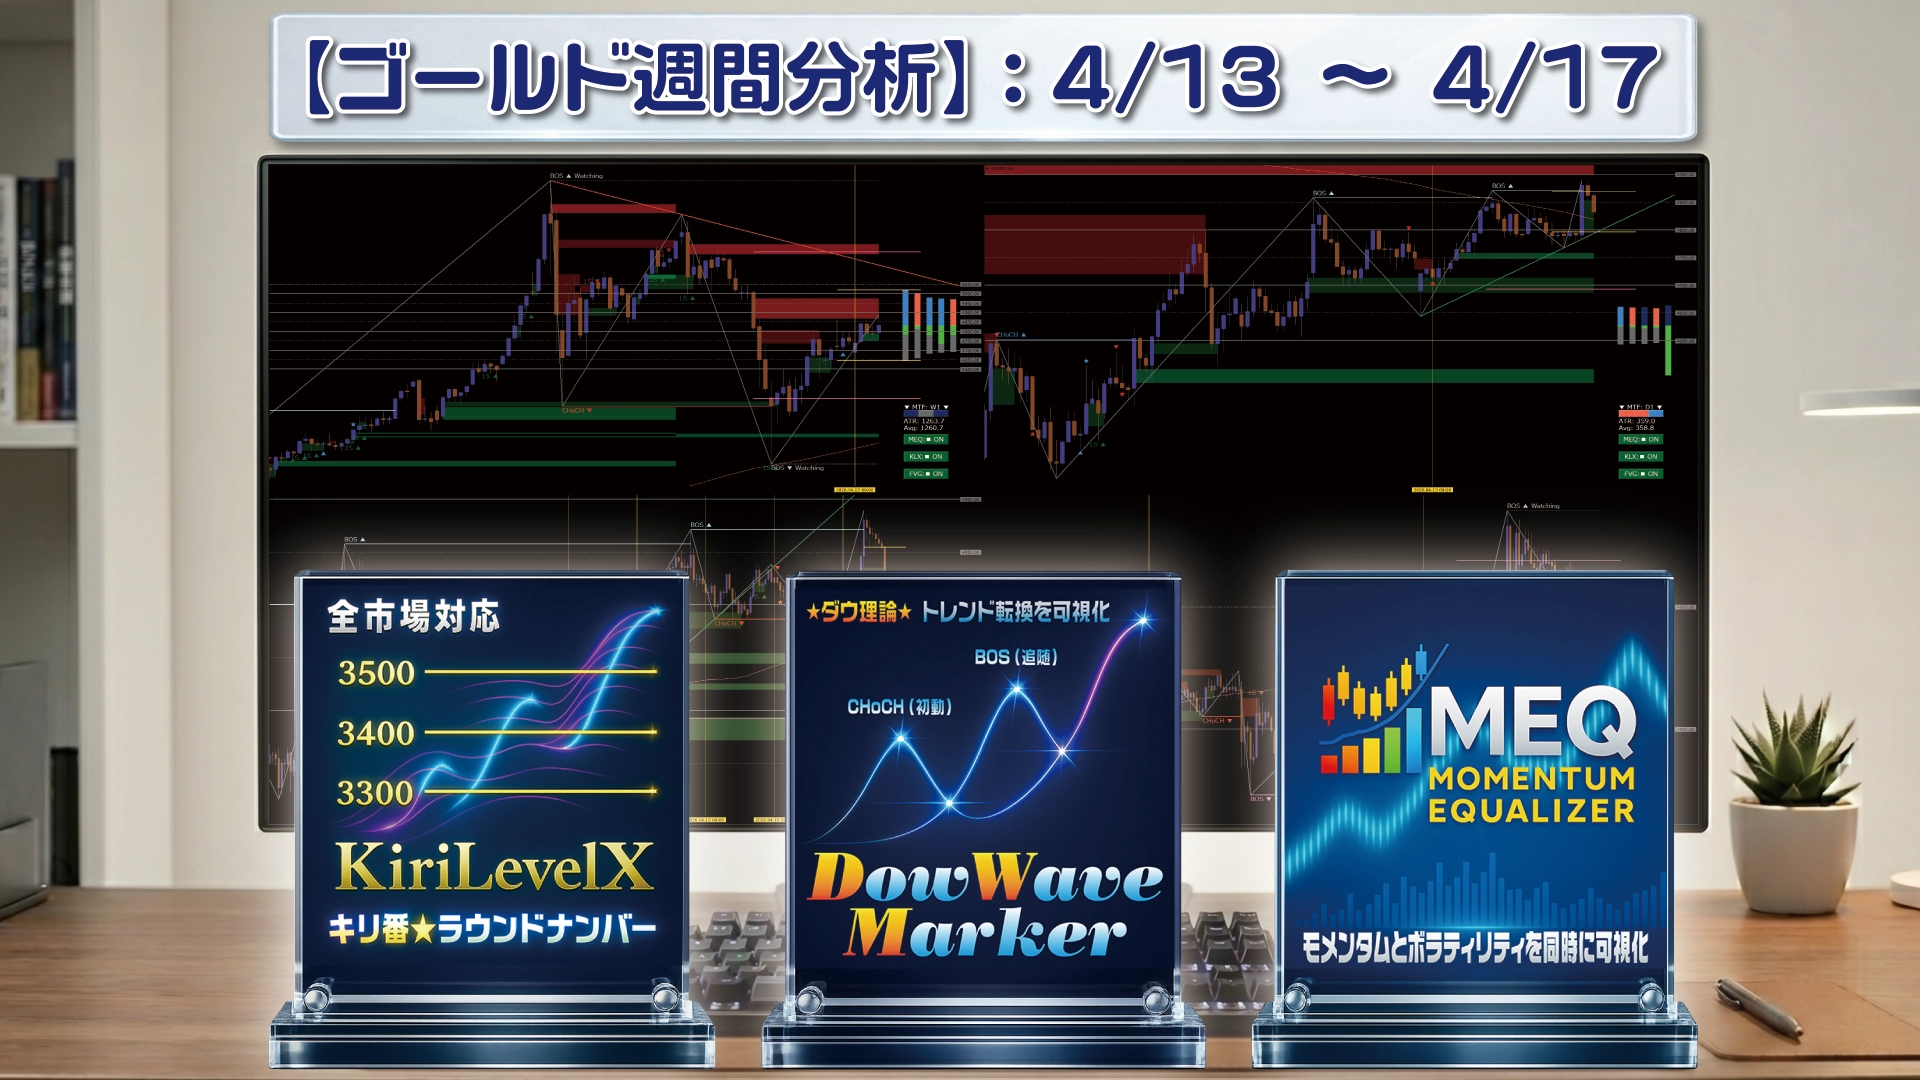
Gold (XAU/USD) Weekly Analysis: Momentum of the rise waning and reaction at key levels (4/13–4/17)
The Engineer's Weekly Reflection Notes
This week's Gold showed strong movements within the high-price range, but gradually“weight on the upside”became a consideration in the outlook.
From the engineer's perspective, I reflect on how the tools developed were able to organize this sharp price movement, as if compiling notes.
Also, to visually indicate the scope of this week (4/13–4/17) on each chart, a yellow vertical line is drawn.
Please focus on the behavior of the indicators within this range.
【Daily】Long-term view: Steady movement in the high-price range
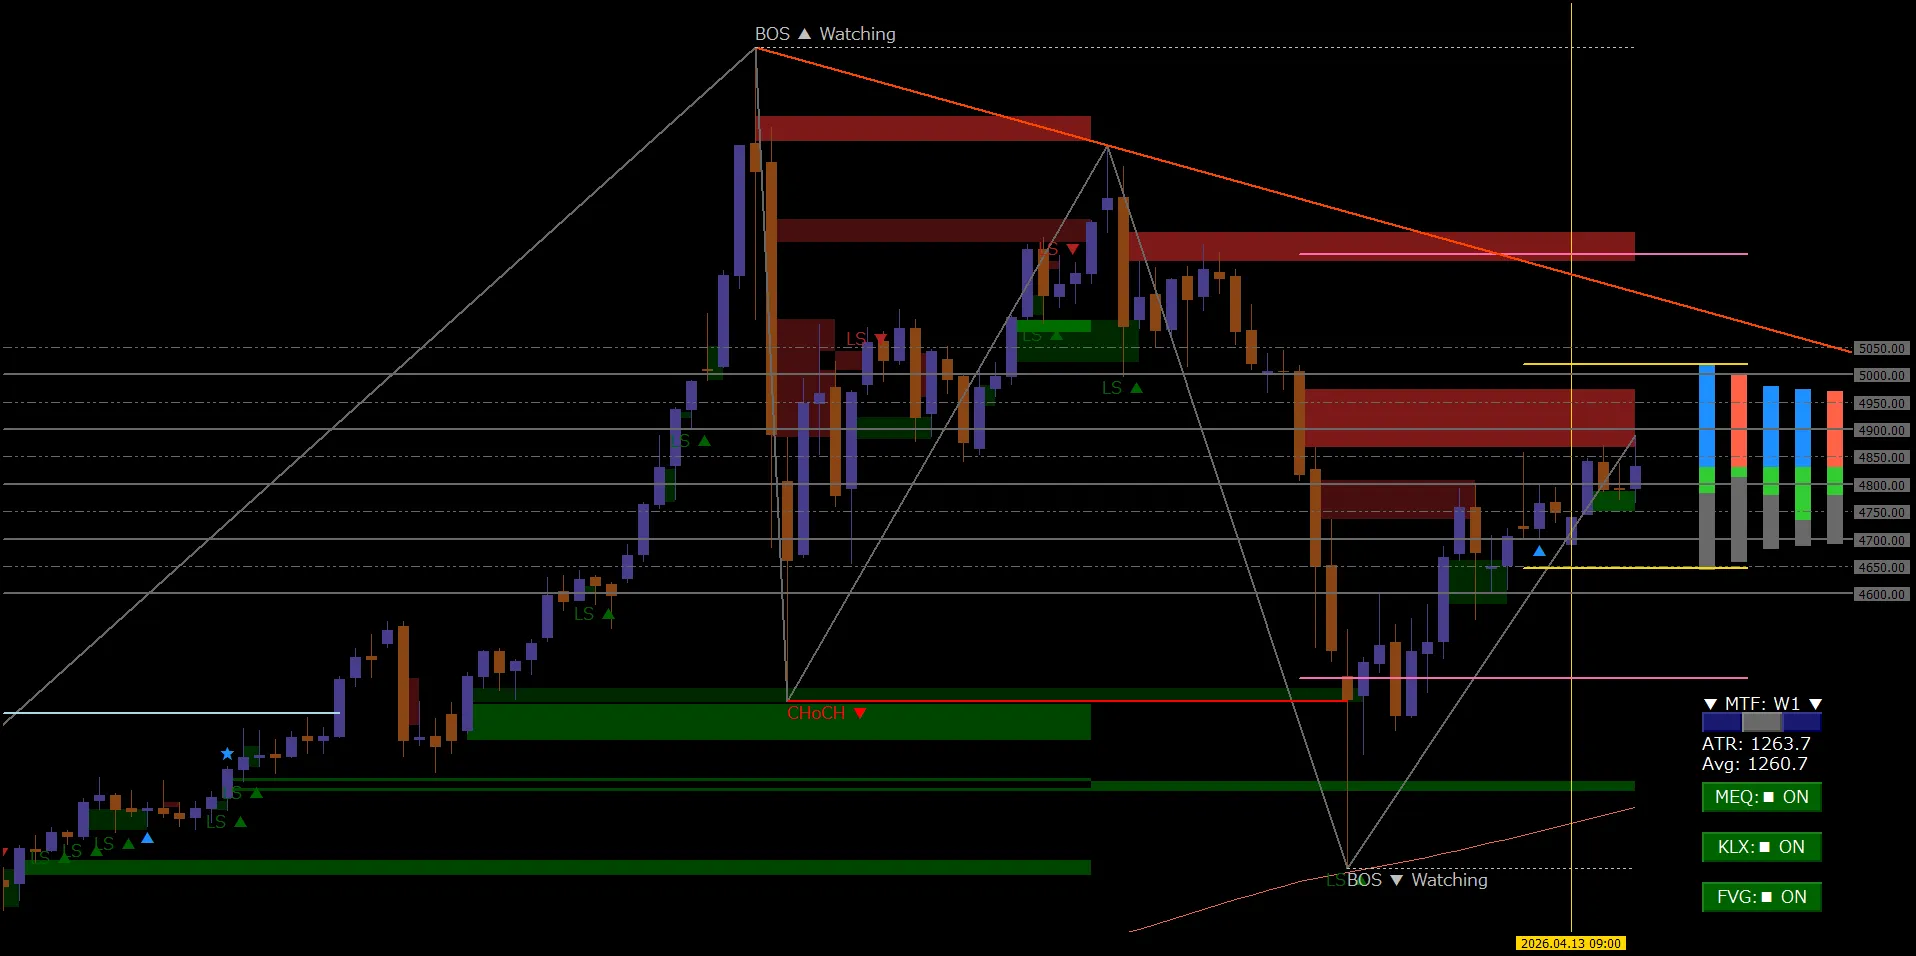
On the daily chart, we are still within a long-term upward trend.
★Price Gap (FVG):The green band beneath continues to function as a long-term support.
★Momentum persistence:The major trend has not broken, and even after a pullback, the chart structure shows a solid base where buyers quickly come back in.
【4-hour】Mid-term structure: Upside pressure and shrinking update range
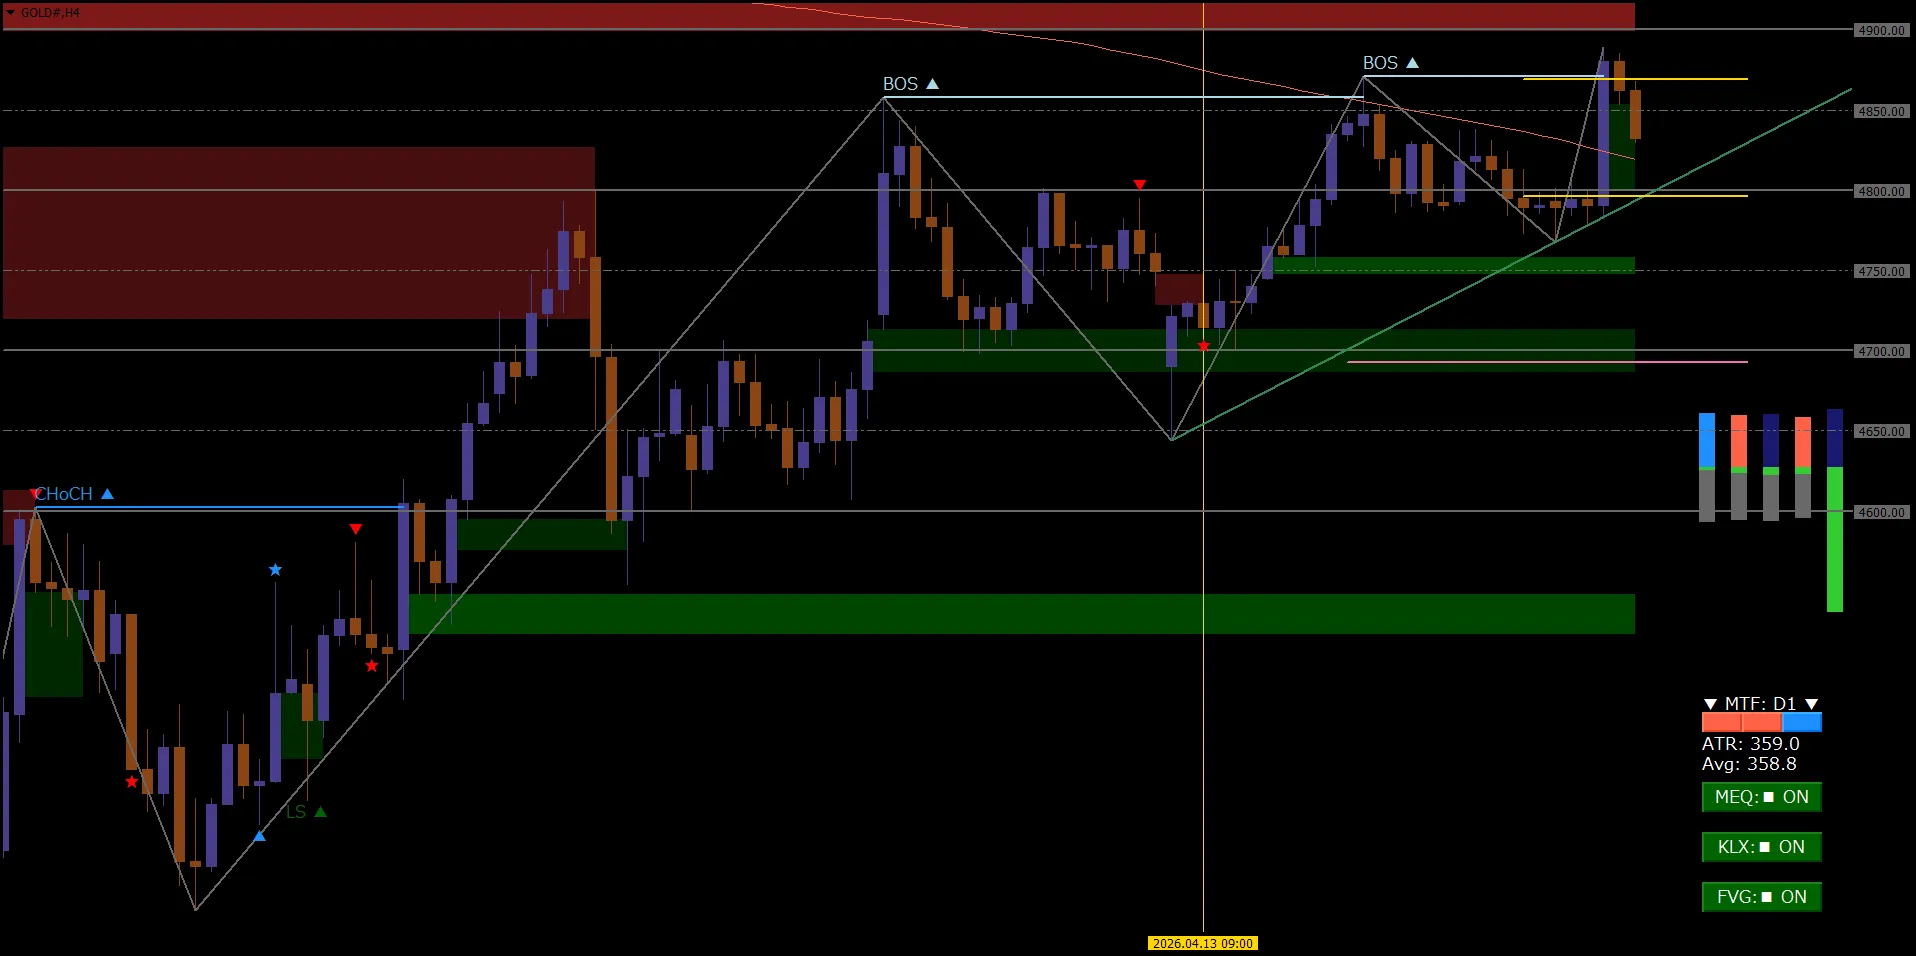
In the 4-hour chart, there is a noticeable change in the prior momentum.
★Narrowing update range:Prices continue to make new highs, but the increments of those updates are gradually narrowing.
★Dulling upward pressure:Not a sudden breakout momentum, but a movement that confirms upside weight as observed in the indicator behavior.
【1-hour】Short-term structure: Detection of a change in nature (ChoCH)
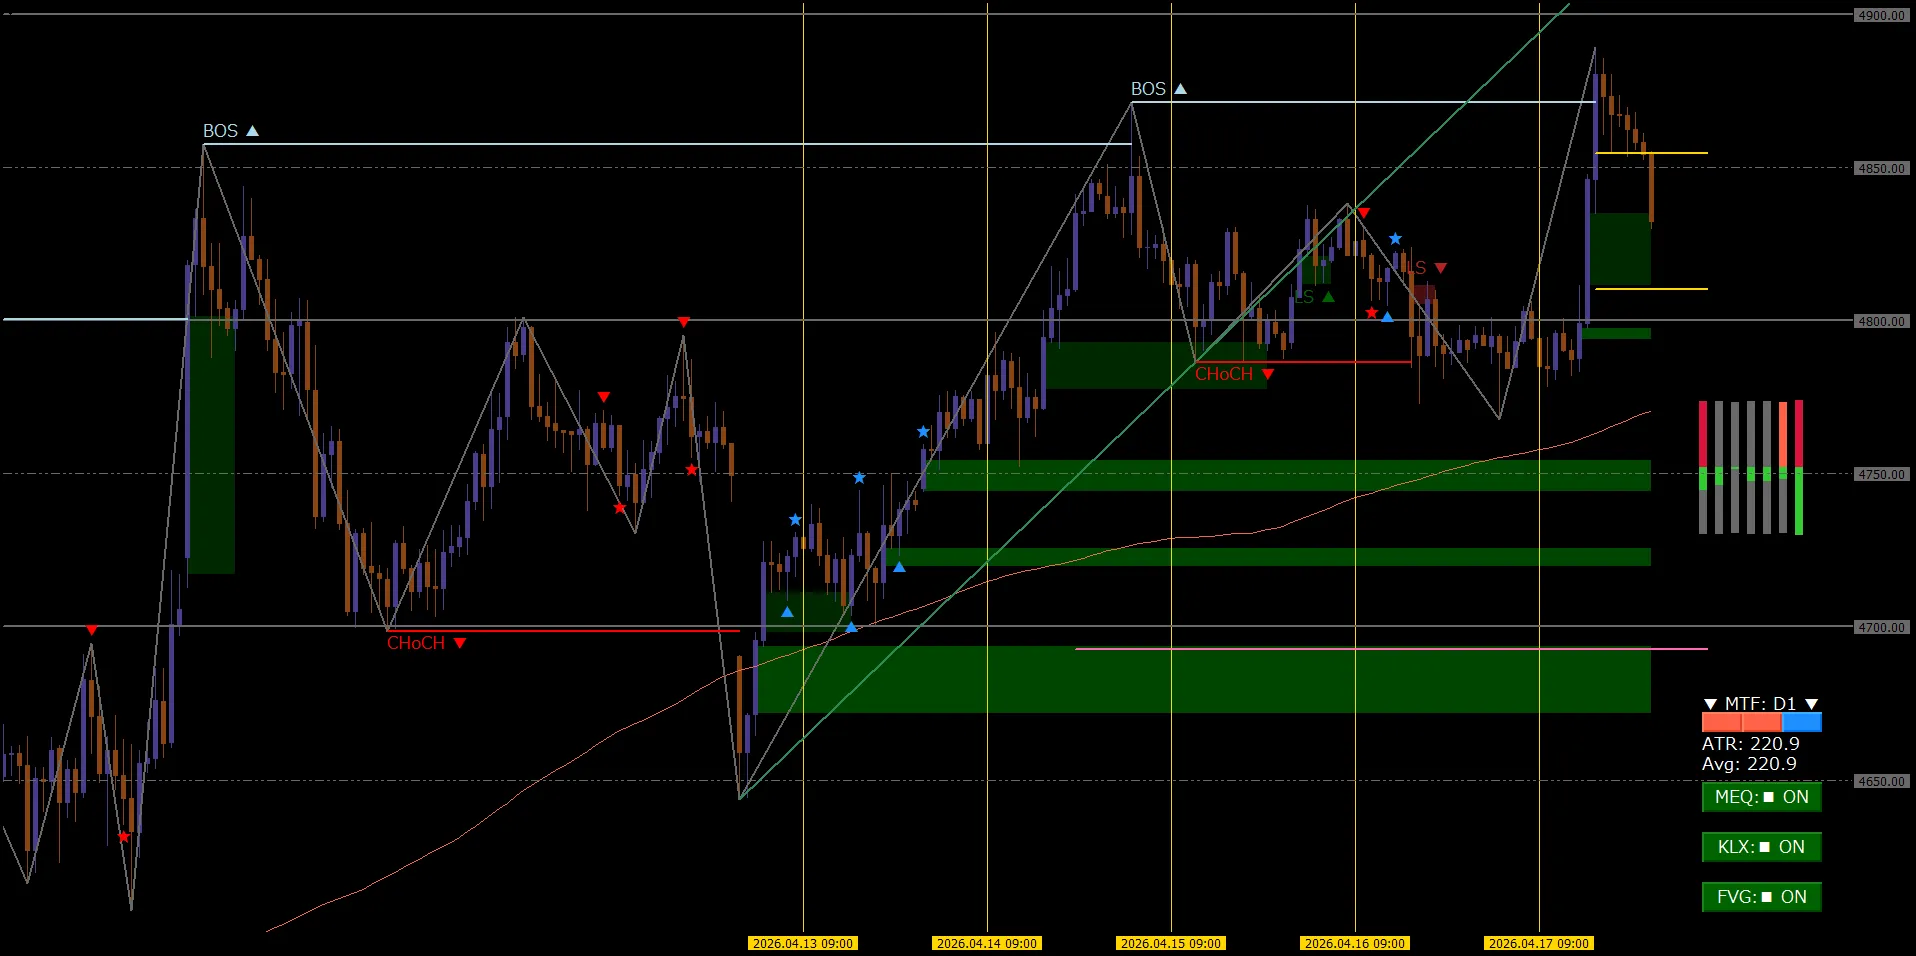
On the 1-hour chart, a short-term shift in momentum is depicted within the week.
★Structural turning point (ChoCH):The upward momentum temporarily settles, and the tool accurately captures the point where the short-term nature changes.
★Observable environmental awareness:Rather than moving blindly, by watching price reactions at the milestones and regions indicated by the indicators, one can calmly grasp the current market“now”.
【15-minute】Detailed analysis: Fine-grained understanding via indicators
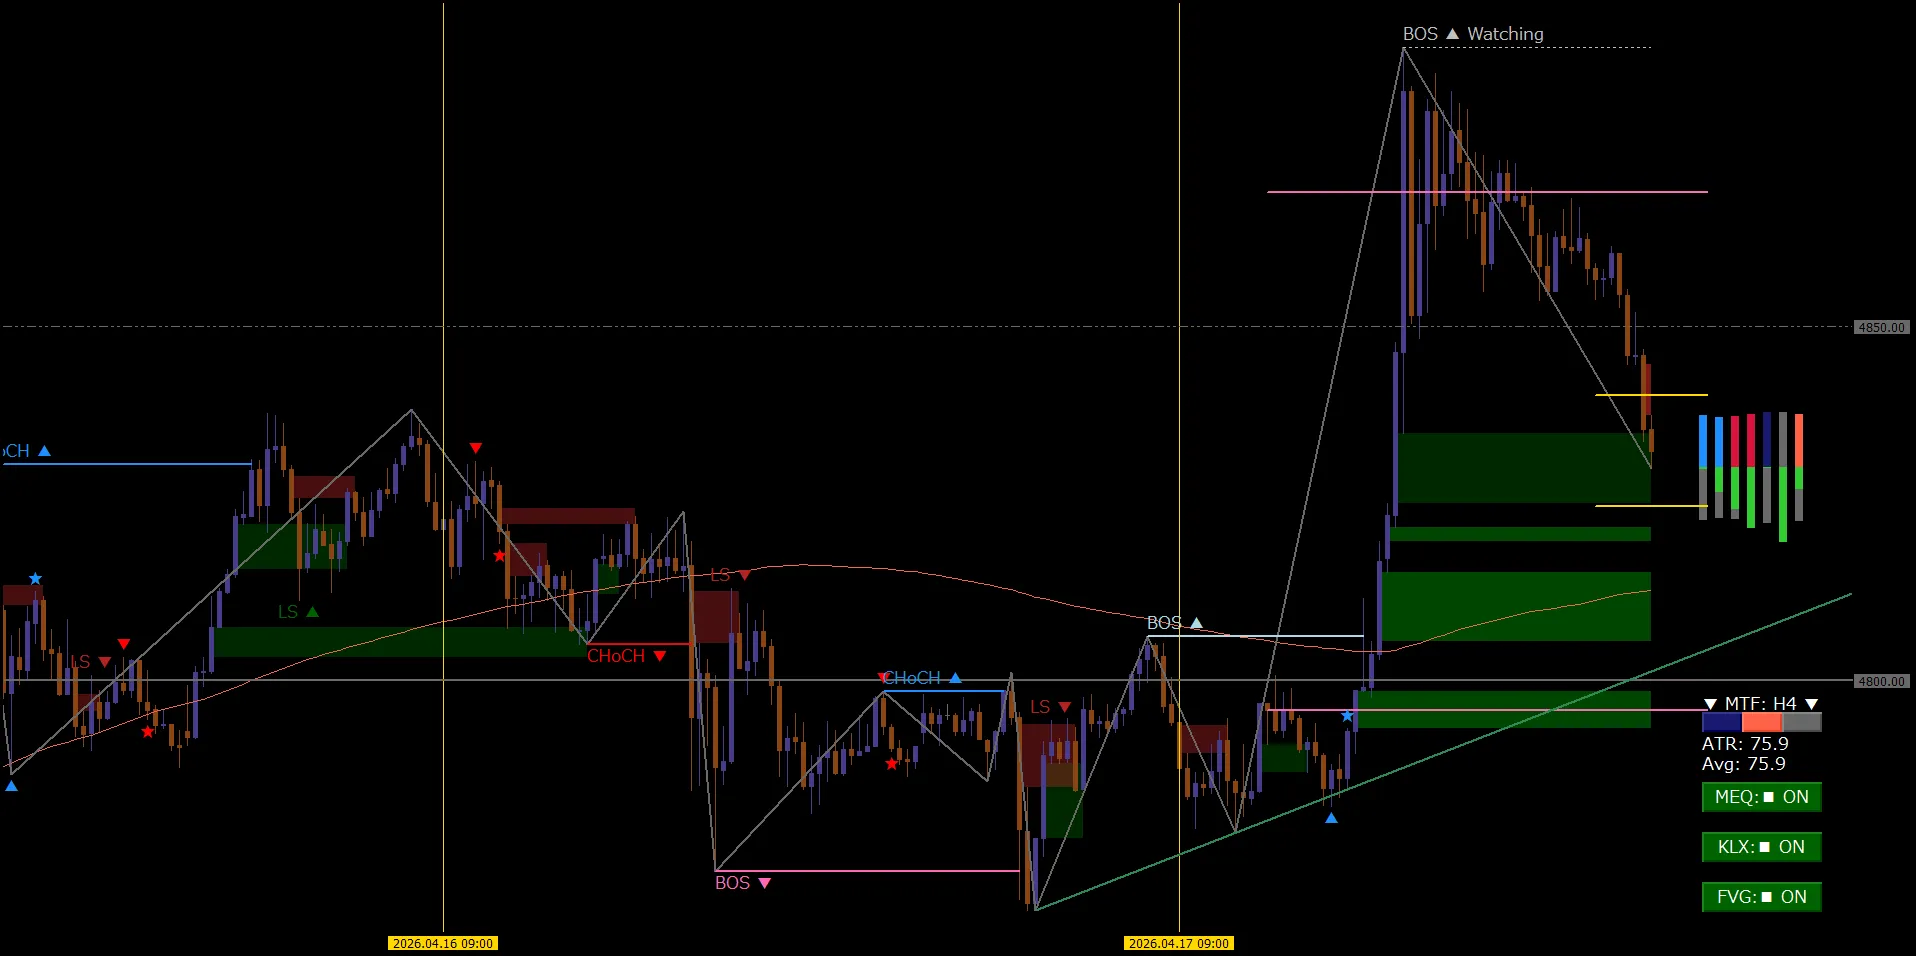
In the 15-minute timeframe, close to execution time, we organize and verify large volatility movements with logic.
★Awareness of milestones (KiriLevelX):The convergence of reactions at specific price ranges with the regions drawn by the tool is a key to understanding the market environment.
★Logical grasp:Rather than being swayed by price action,“DowWave Marker (DWM)”and“MomentumEqualizer (MEQ)”provide structural and momentum cues as objective decision aids.
Summary: Developer's perspective
How did you view this week's Gold movements?
For me,“I want to approach charts with more conviction”as an engineer, I developed these tools and continue to refine them daily.
Simplifying and organizing a complex market in a logical way has become a big support for my own trading.
I hope my notes provide some hints or insights for everyone's daily environmental awareness.
Next week, let's continue facing the market at our own pace in a way that is convincing to us.
For those who want to know more about the tools
The basic concepts of DWM used in this analysis and how to visualize the market environment simply are explained in detail in the following YouTube video.
Please find it useful for daily market awareness.

Introduction to the indicators used
The tools I developed with the aim of“making trading easier for myself and facing the market more logically”have been published on
this pageGogoJungle product page.
◆DowWave Marker (DWM) SMC Integrated Model
Automatically visualizes market structure to support confident environmental recognition.
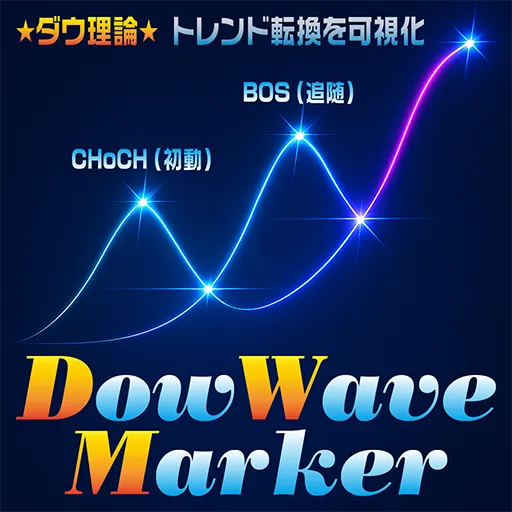
https://www.gogojungle.co.jp/tools/indicators/72037
◆KiriLevelX (KLX)
Automatically draws the frequently noticed “milestone” (Kiri-number) to aid precise analysis.
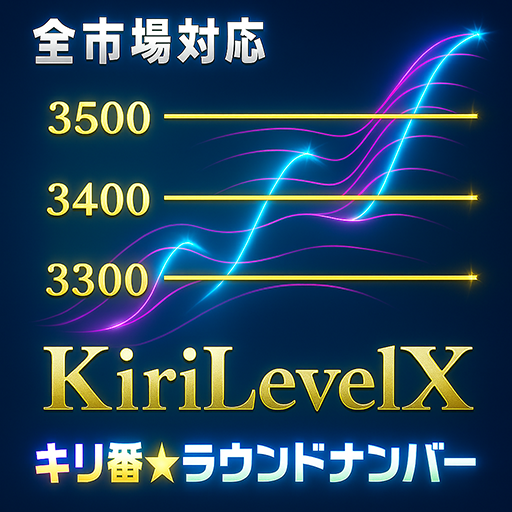
https://www.gogojungle.co.jp/tools/indicators/65584
◆MomentumEqualizer (MEQ)
Speeds up market momentum visualization using its own logic, supporting visual judgment.