
Dollar/Yen Weekly Analysis: The Battle Near 160 and Changing Market Environment (4/13–4/17)
Engineering Notes: This Week's Reflections
This week's USD/JPY movement was very tense, with a heightened awareness of the 160 yen milestone.
As a developer of the tools I use, I want to calmly reflect on how the market was interpreted.
Also, to visually indicate the range of this week (4/13–4/17) on each chart, a yellow vertical line has been drawn.
Please focus on the indicator behavior within this range.
[Daily] Long-Term View: Support from Long-Term Price Gaps (FVG)
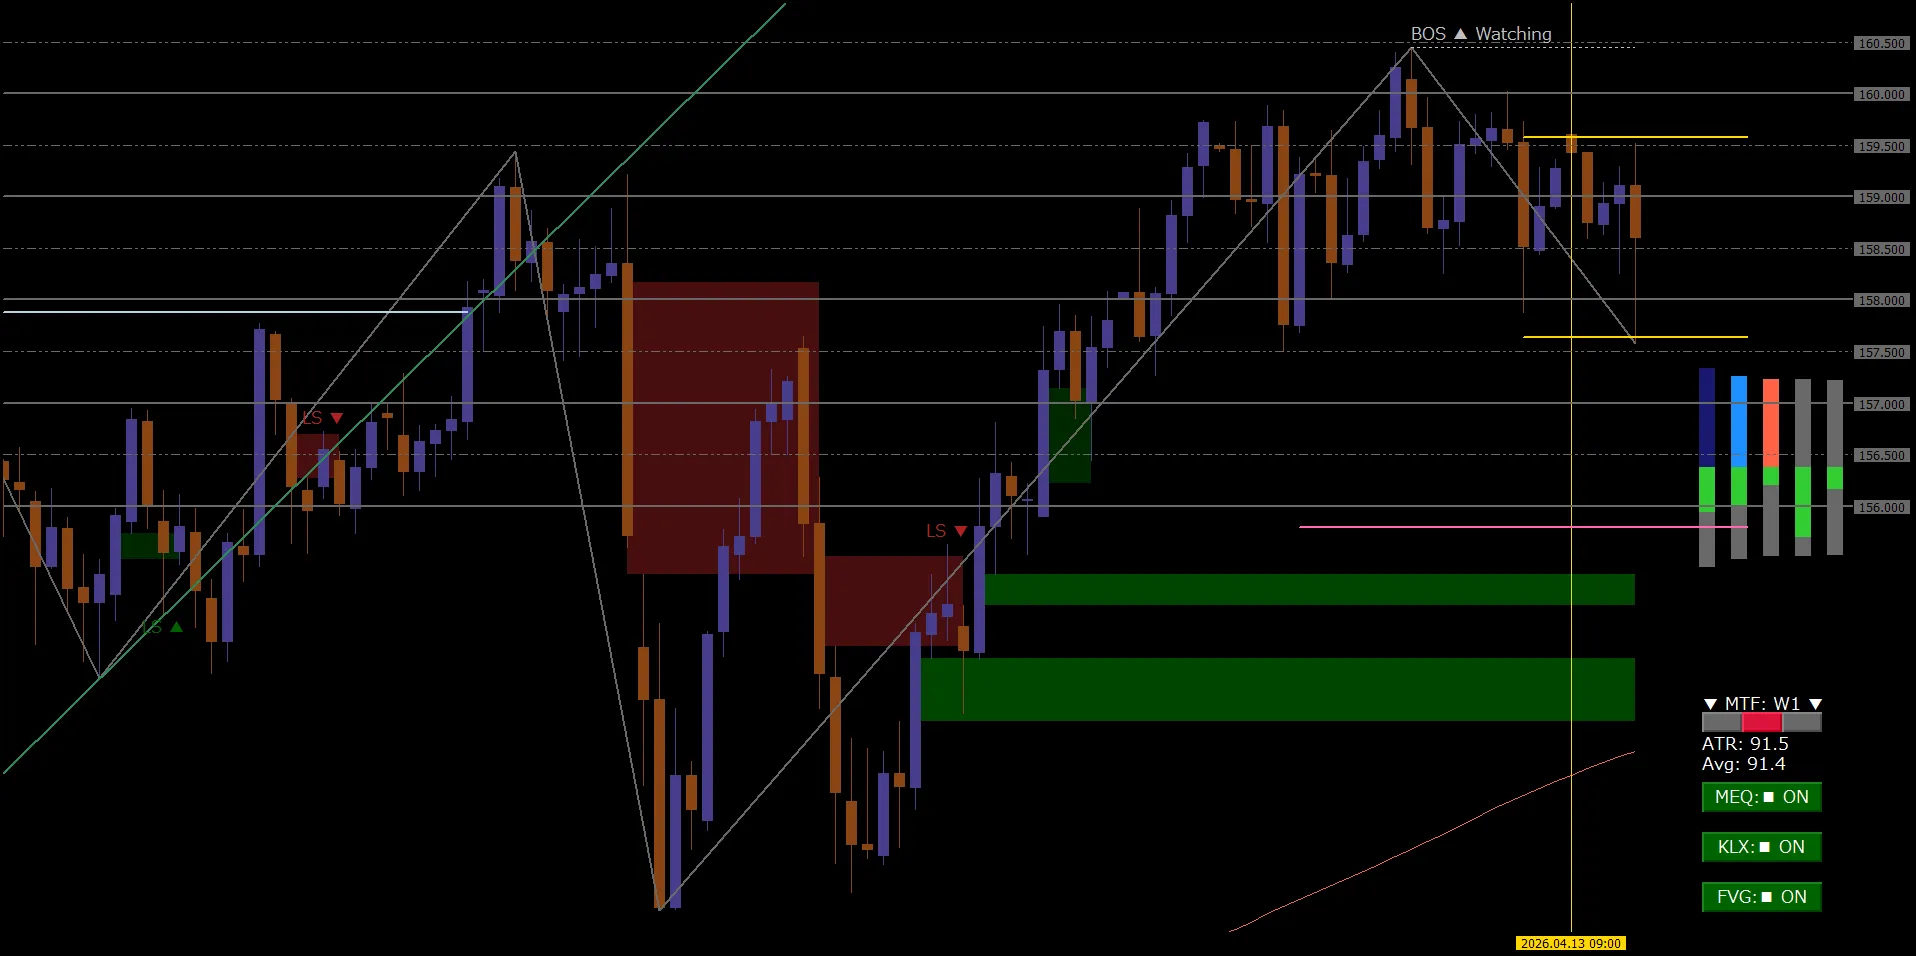
On the daily level, the trend is upward in a long-term sense, but reaching the large wall of 160 yen has led to a movement that seems to stabilize.
★Price Gap (FVG):The green band below is confirmed to be functioning as long-term support.
★Psychological Resistance at 160 Yen:As a correction phase after a big run, the indicators show cautious behavior.
[4-Hour] Medium-Term Structure: Downtrend and Structural Change
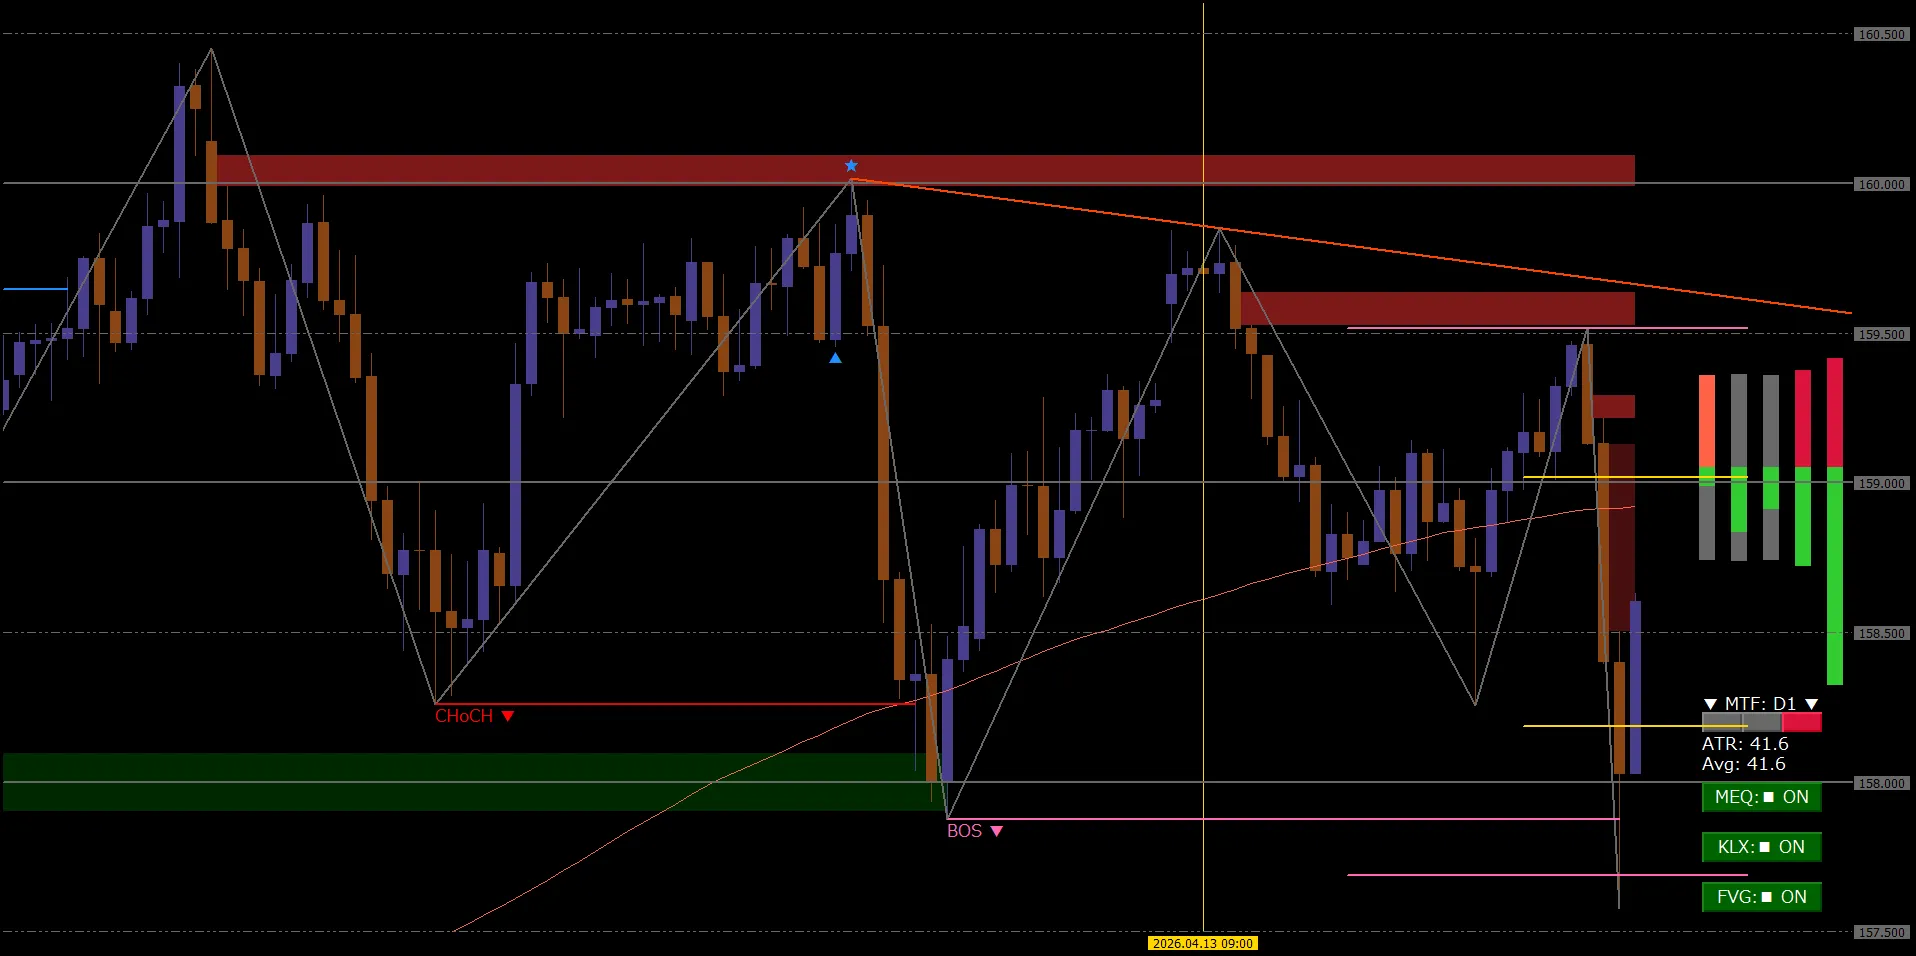
Looking across the week, unlike prior momentum, a downward movement with corrections continued.
★Lower Highs:From last week's rise, this week failed to make new highs and was pushed back.
★Structural Change (BOS):There are signs of a structural change at the 4-hour level, indicating a situation that is not easily approached with a simple long bias.
[1-Hour] Short-Term Structure: Change in Nature (ChoCH) and Visualizing Sell Pressure
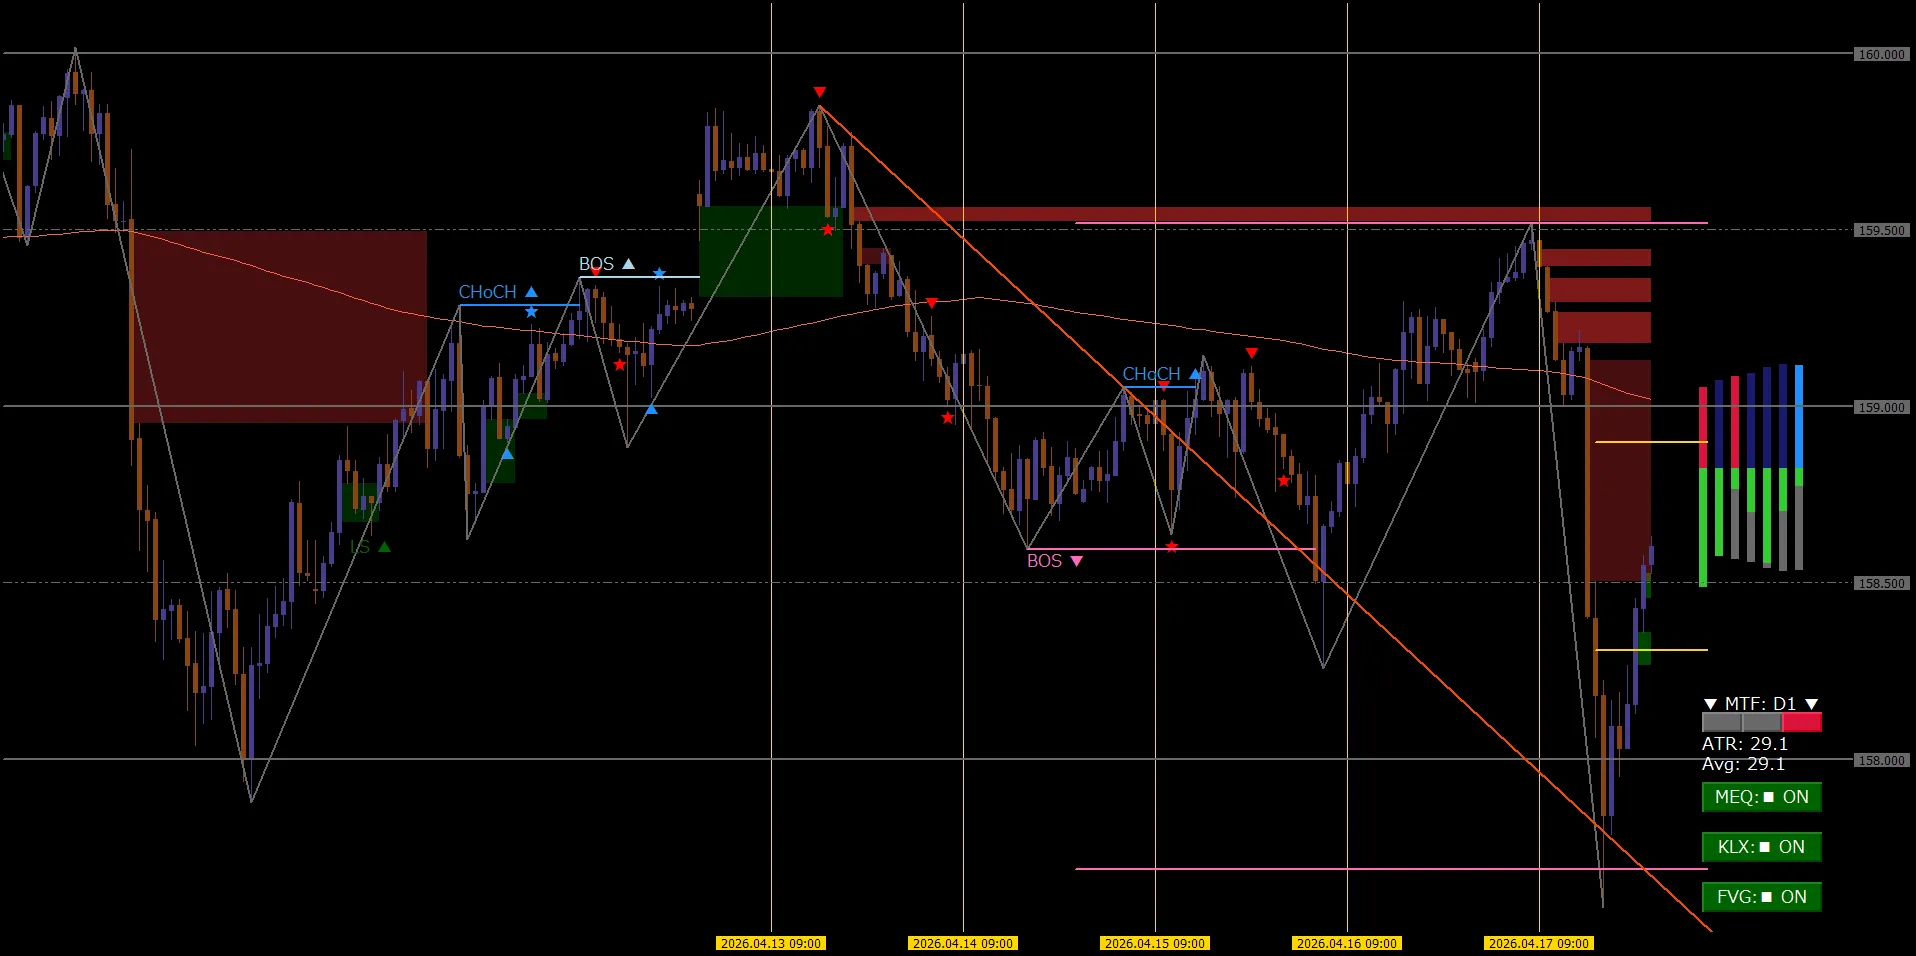
At the 1-hour level, the moment when market nature changed is depicted more clearly.
★Structural Turn (ChoCH):The momentum of ascent weakens, capturing a point where the short-term flow shifts.
★Concentration Zone of Sell Orders:Near 160 yen, the area visualized with red tones indicates stronger selling pressure due to overheating near that level.
Recognizing such“walls”in advance feels important.
[15-Min] Detailed Analysis: Environment Awareness via Indicators
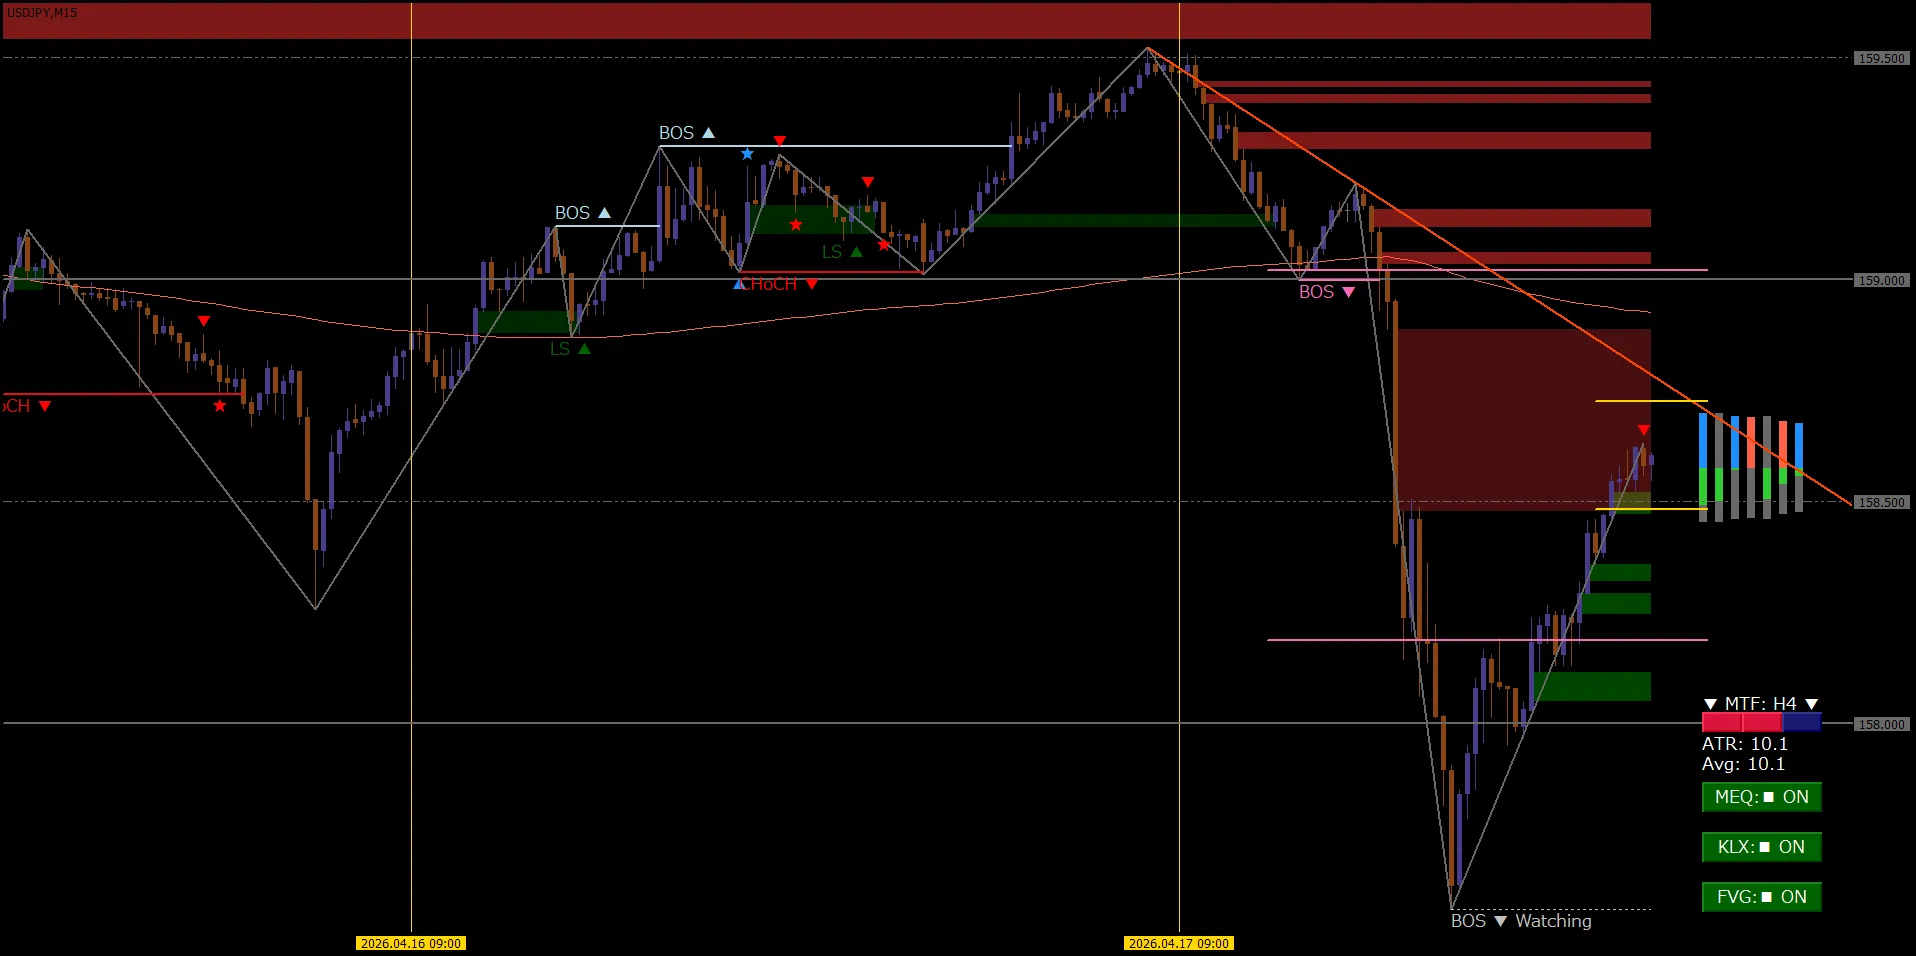
At the near-execution 15-minute chart, we examine the environmental awareness results indicated by each indicator.
★Overlap of Milestone Level (KiriLevelX) and Gap (FVG):The price reaction near a key level and the region shown by the logic clearly overlap.
★Refined Visualization:Rather than blindly following signals, by grasping the “shape of the current market” drawn by indicators, we can use it as more rational decision material.
Summary: Developer's Perspective
How did you feel about this week's market?
Before this very large milestone of 160 yen, the chart showed a different expression from previous rises.
As a part-time trader and engineer myself,“to make trading easier for myself”, I develop tools with that intention.
By organizing the market's complex movements as logically as possible and sharing them with everyone, I hope to move forward step by step.
There is no perfect tool or method, but I believe the accumulation of such analyses will become our solid strength someday.
Let’s keep up the effort together next week as well, within feasible limits.
For Those Who Want to Learn More About the Tools
This week's analysis uses DWM's fundamental ideas and how to visualize market environments simply; details are explained in the YouTube video below.
Please use it as a daily hint for environmental awareness.

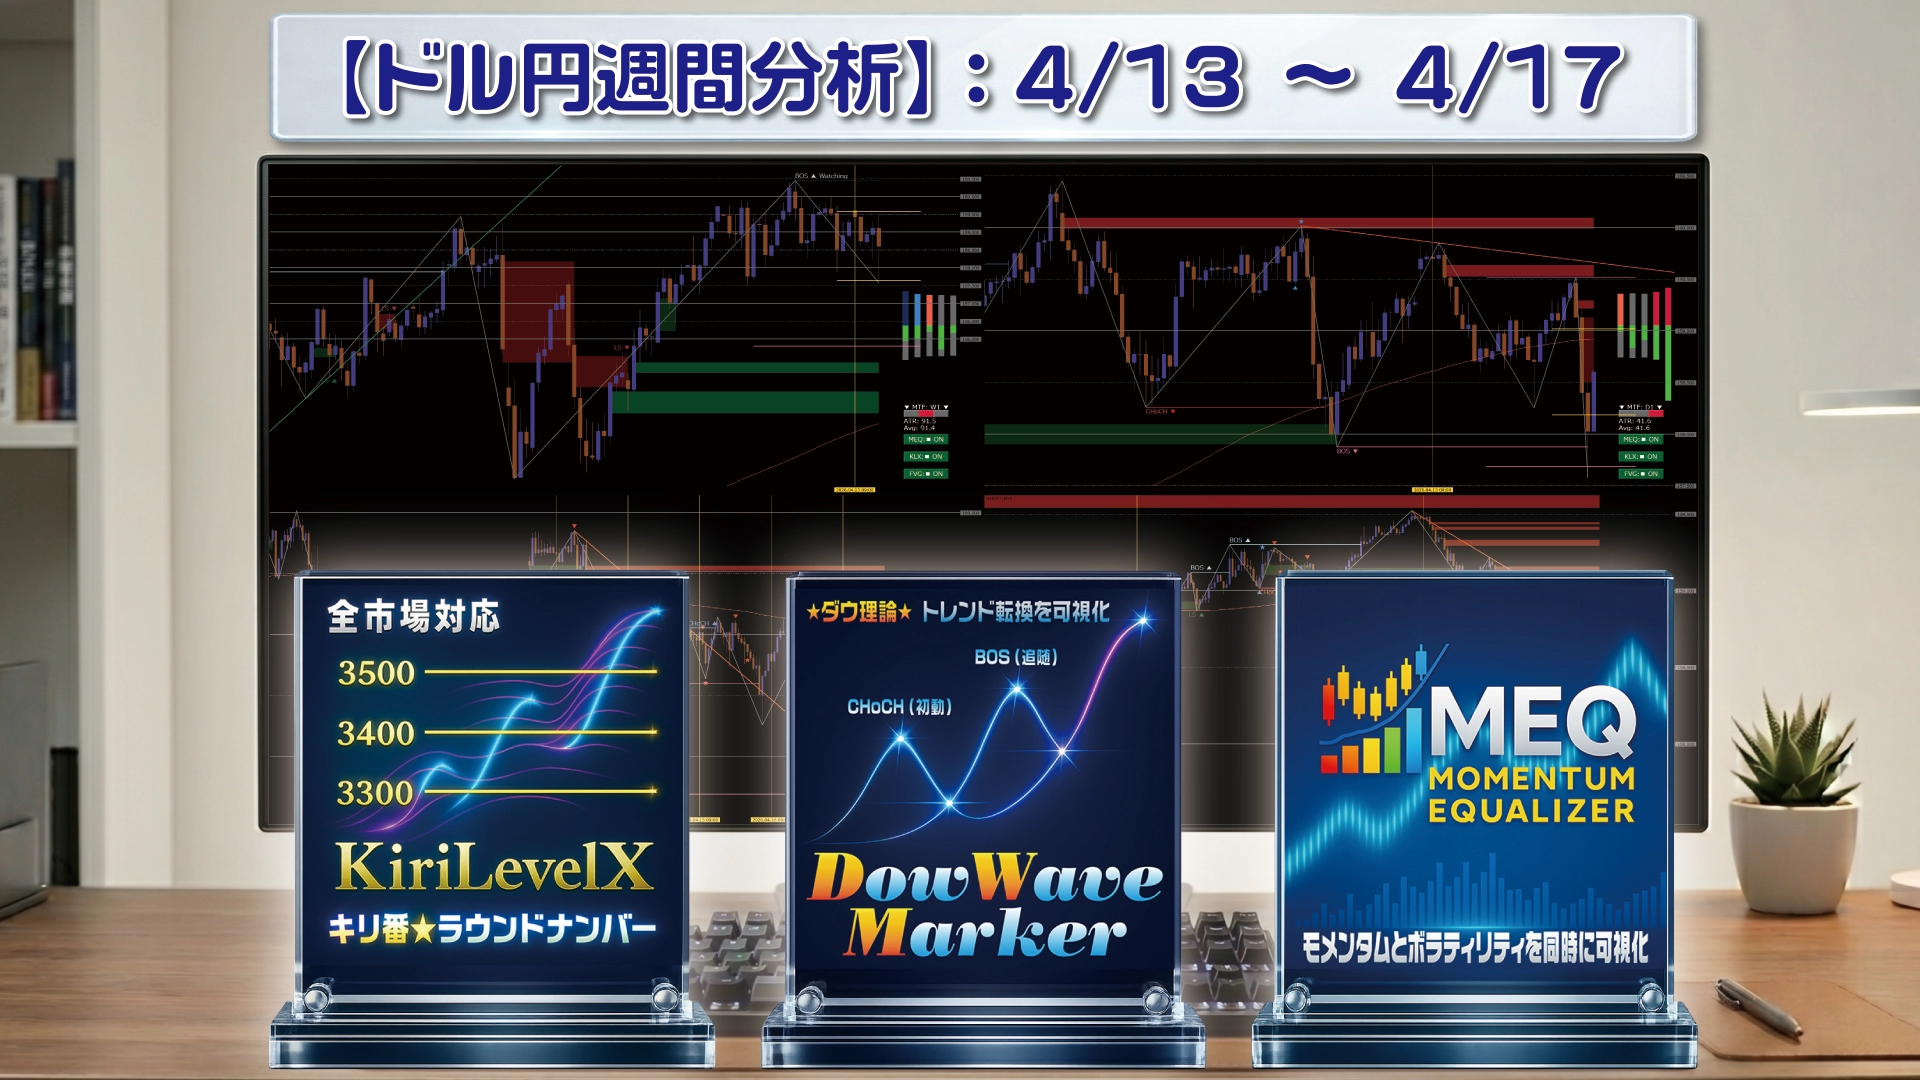
Introduction to the Indicators Used
I developed these tools with the intention of“making trading easier and more logical for myself”, and they are
available onGogoJungle product page.
◆ DowWave Marker (DWM) SMC Integrated Model
Automatically visualizes market structure to support decisive environment awareness.
https://www.gogojungle.co.jp/tools/indicators/72037
◆ KiriLevelX (KLX)
Automatically draws attention to “milestones (Key Levels)” used by many traders, aiding precise analysis.
https://www.gogojungle.co.jp/tools/indicators/65584
◆ MomentumEqualizer (MEQ)
Speeds up the market momentum using its own logic to support visual judgment.