

【TEPPAN Introductory Session 1】Are You Really Seeing That Pattern? Objectively View Chart 'Forma' with FINDER
What you see isn’t always what you get
See chart “patterns” objectively with TEPPAN FINDER
While looking at charts, have you ever felt, “this shape seems likely to go up,” or “this point might reverse”? That “vibe” is turned into a more readable map by pattern recognition charts through as much rule-based clarification as possible.
In three installments starting this time, we will introduce what can be done with the MT5 indicator “TEPPAN” series. The theme for Episode 1 is,TEPPAN FINDER—an indicator that finds “patterns” inside the chart, compares them, and assists in trading decisions. In the latter part of the article,the official version and,a time-limited free version for USDJPY M15 onlywill also be introduced.
First, what is a pattern
A pattern is a type of price movement that repeatedly appears on the chart. Many traders refer to patterns because they tend to revealthe balance of power between buyers and sellers ormarket psychology shifting from hesitation to acceleration and from acceleration to reversal. Of course, patterns do not guarantee the future. However, they serve as a map for questions like “where to enter,” “where to place a stop loss,” and “where to take profit.”
In other words, breakout types look for “patterns that tend to run after a breakout,” while reversion types look for “patterns that tend to revert after overextension.” Learning to distinguish these two will significantly change how you view charts.
What becomes visible on a chart when nothing is drawn?
First, take a look at a USDJPY M15 chart with nothing drawn on it.
How many patterns do you see here? If you see something, where would you enter? Where would you place your stop loss? Where would you target taking profit?
Some may answer this quickly. Others may feel, “I can vaguely see a shape, but I’m not confident.” This is precisely the difficulty of discretionary trading. Even when looking at the same chart, one person may see a triangle consolidation, another may see a reversal pattern, and another may see nothing at all. In other words,a naked chart is perceived differently by people.
TEPPAN FINDER is the entry tool to the TEPPAN series. On the product page you can see how FINDER / MATRIX / FINAL CHECK each play a role and how they connect as a whole.If you want to grasp the big picture first, checking the product page will make it easier to understand the content of this article.
TEPPAN FINDER will be sold as a standalone product. In addition to the regular standalone versiontime-limited free versionis also available. The time-limited free version isUSDJPY M15 onlyand usable untilApril 30, 2026 at 23:45 server time. (Currently awaiting listing approval, so not yet on sale)
For example, as in the supplemental image above,the blue lines indicate LONG-patterns and the red lines indicate SHORT-patterns. On the left,Ascending triangle (Asc Tri) andRectangle (Rect) are drawn in blue, organized as candidates targeting the up move. On the right,H&S (Head and Shoulders) is drawn in red, indicating a caution for the down move.
C55, C53, C62 are the evaluation values for each pattern. (C stands for Confidence; the number is a score out of 100.)
Also,the blue and red signals are focal points,the yellow horizontal line is the entry reference,the opposite horizontal line is the stop-loss reference,the dotted lines indicate staged take-profit candidates, and reading them this way makes the meaning of the displays easier to grasp.
In other words, TEPPAN FINDER is not only about finding shapes, but alsovisually organizing which direction to target, where to enter, and where to manage risk. This is what makes it practical for real trading.
Revisiting with breakout and reversal types changes the scene
First, the breakout types. With lines and labels added, shapes that were hard to spot with candles alone become easier to classify—“So this was a consolidation,” or “This was a breakout setup.”
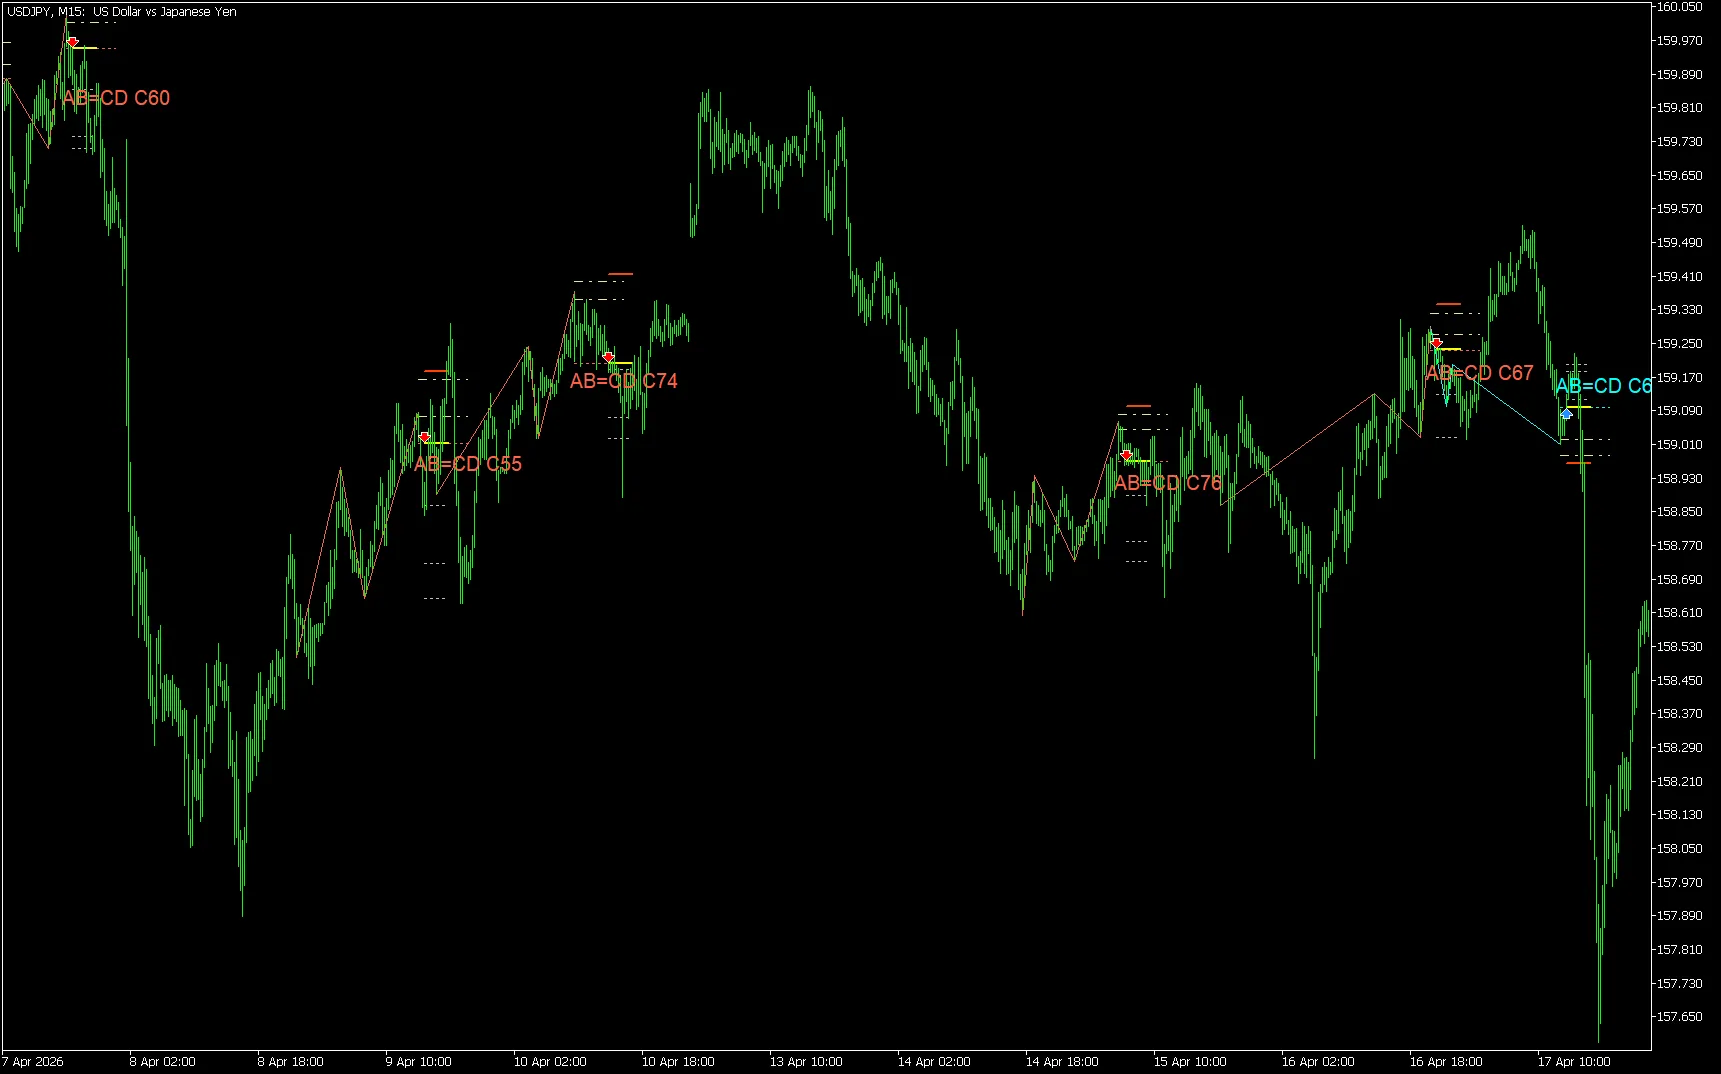
Next, when looking at reversal types, you will see places where a move is likely to revert from another angle.
What matters here isthat this is not an absolute correct answer. Markets always change, and the same shape can have stronger or weaker responses subsequently.
Additionally, TEPPAN FINDER prioritizes showing patterns that are somewhat formed, rather than forcing a shape early. It separates the moment a pattern is found from the decision to enter.
For example, while watching whether the formed pattern is really reacting or whether the trend is turning, you can consider entry candidates. Stops and profit targets are not placed by guesswork, butbased on reasons for those levels. This “drawing and then deciding” aspect is a practical feature of TEPPAN FINDER.
People see what they want to see
Nobel laureate Daniel Kahneman is famous for saying“What You See Is All There Is.”.
In simple terms,people tend to judge based on the information currently visible. In trading terms, a strong desire to buy makes you more likely to spot shapes that look upward, while a strong urge to sell makes you notice shapes that look downward.
However, the market does not move to please you. Therefore, rather than viewing charts subjectively,it is important to adopt an objective perspective for pattern identification.
TEPPAN FINDER is exactly a tool for that purpose. It doesn’t just “look for a shape,” butfinds pattern candidates with consistent rules, compares them, and supports decision making. This gradually brings more objectivity into discretionary trading.
Can be used not only in FX, but also in GOLD and Bitcoin
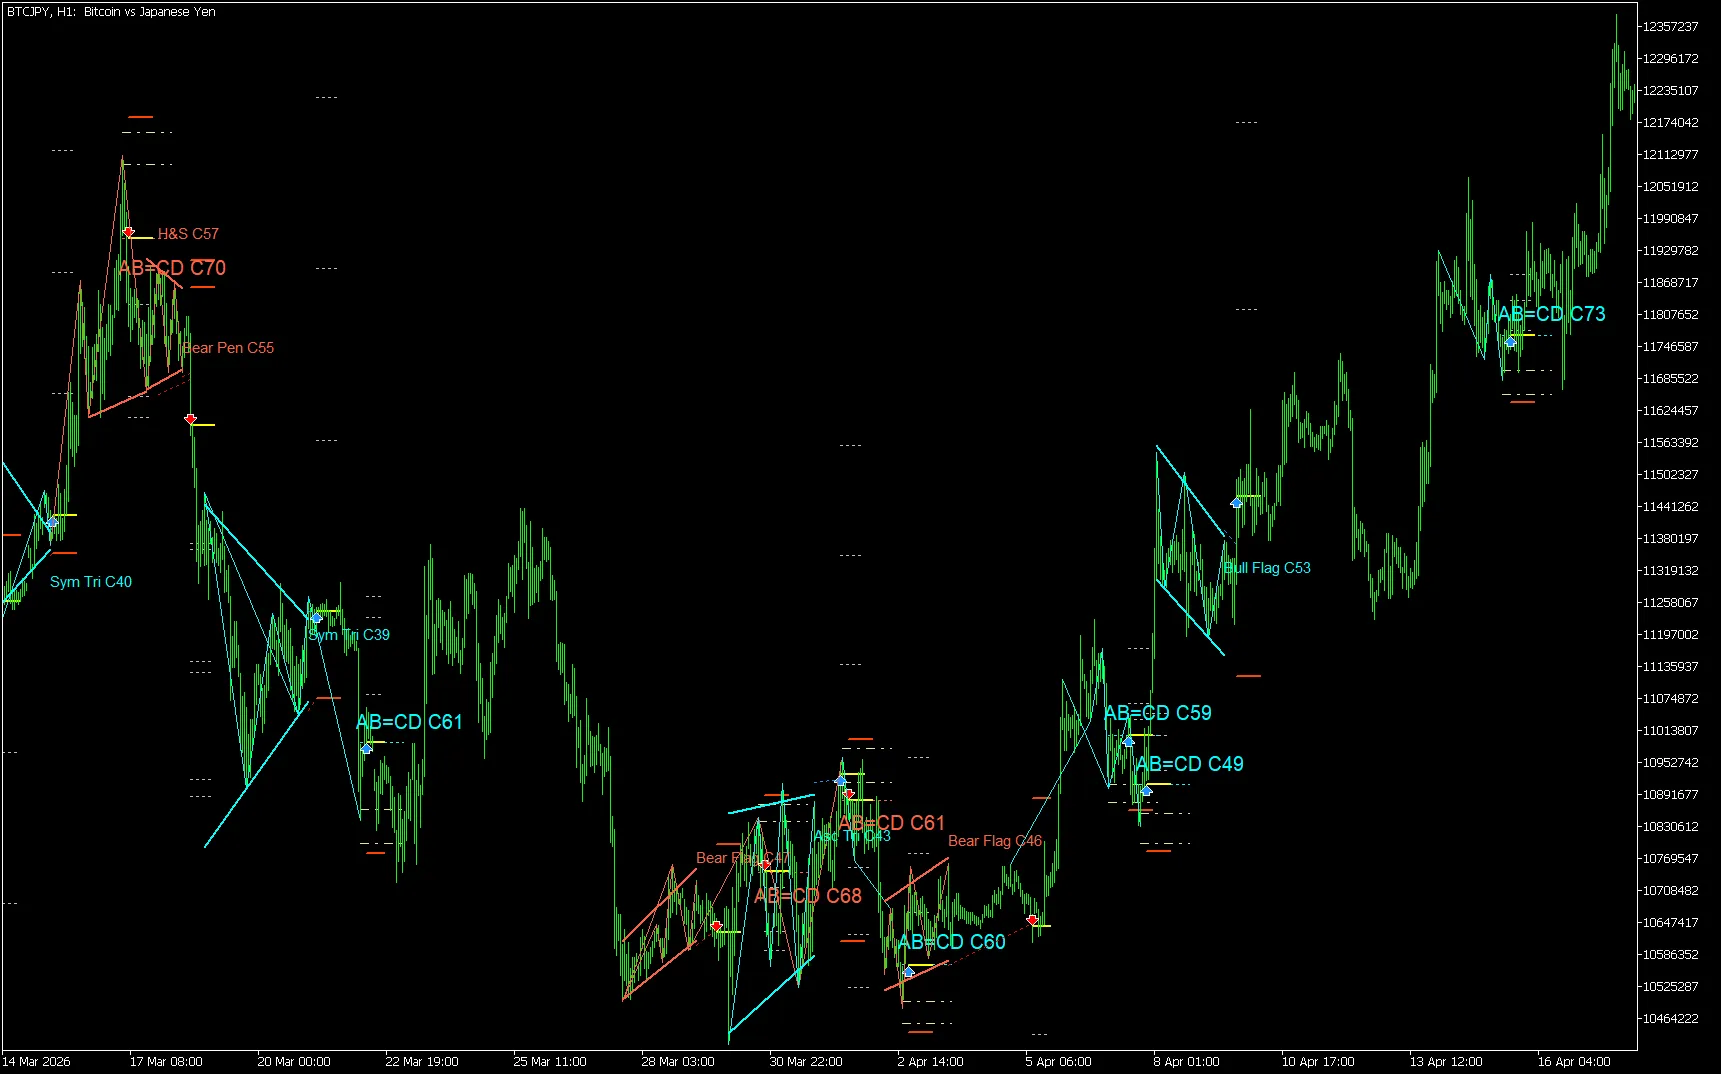
From what you have read, you might think this is about FX alone. However, TEPPAN FINDER’s approach is not limited to any single market.
If the instrument is available in MT5, you can search for patterns in markets with large price moves like GOLD or cryptos like Bitcoin, in addition to FX. In fact, looking at Bitcoin’s chart with both breakout and reversal patterns laid side by side helps organize where to target growth and where to watch for reversals more easily.
※The above usage is for the TEPPAN FINDER official version. The time-limited free version isUSDJPY M15 only,usable until April 30, 2026 23:45 (server time).
In other words, what we have introduced here is the1st capability of the TEPPAN series. First, with TEPPAN FINDER, youfind patterns inside the chart. This is the starting point of everything.
If you want to objectively view chart patterns first or try pattern visualization, please check the TEPPAN FINDER page.
In the next episode, we will discuss how tocomparethe candidates found.Using TEPPAN MATRIX and FINAL CHECKto enhance decision-making accuracy will be shown.
And in Episode 3, we will delve further into what can be done by combining the three-currency parity analysis tool“Intervention Aftermath PRO ver.8.4~”.