

Gold Analysis 2026/04/17
Yesterday's daily chart showed a shooting star on the downside.
Since it is a bearish candle followed by a shooting star, the impression is that selling pressure is strong.
【4-hour chart】
We are in an uptrend according to the Ichimoku system.
As long as we stay above the alined area around the 60-period moving average that shows regularity, the outlook is bullish, but breaking below this level in real body terms would make a buying outlook very difficult.
First, we should watch the area near 4773 for battle.
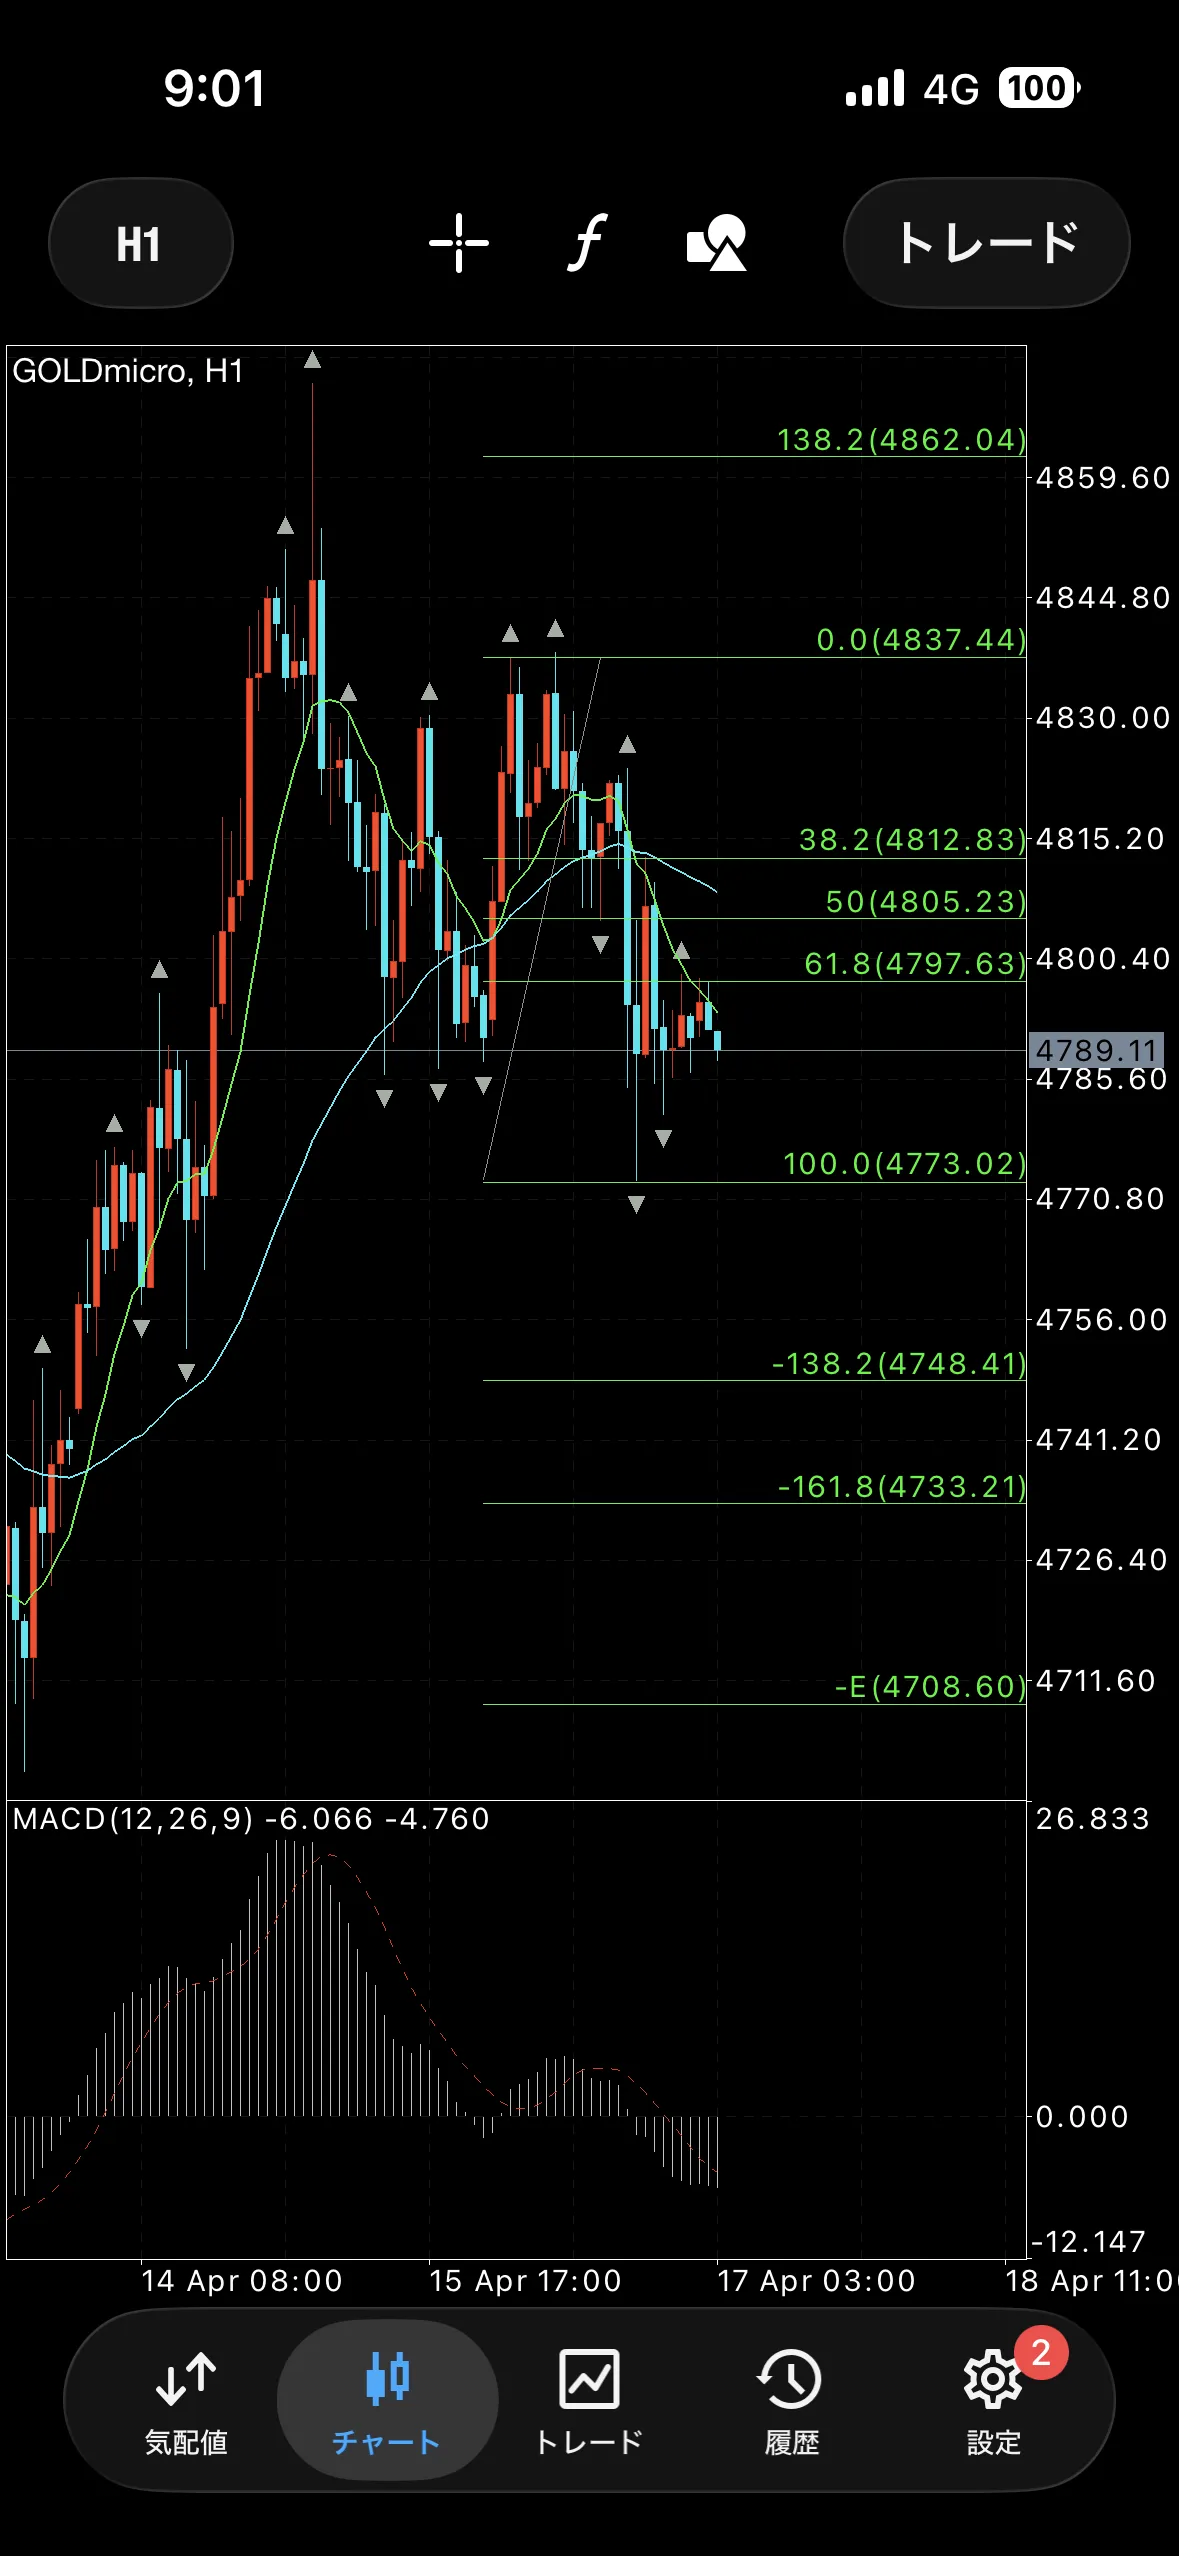
【1-hour chart】
Since the daily is a bearish candle, it may be wise to align with the daily direction here.
With a relatively large W% on the neckline, it might not be too late to wait for a break below this point.
MACD is breaking the zero line, so the initial impression is bearish.
【Sell defense lines】
4837
4812
4805
4797
【Buy defense lines】
4773
4748
4733